
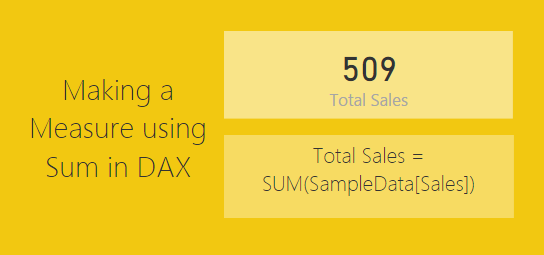
In our last post we built our first measure to make calculated buckets for our data, found here. For this tutorial we will explore the power making measures using Data Analysis Expressions (DAX).
When starting out in Power BI one area where I really struggled was how to created % change calculations. This seems like a simple ask and it is if you know DAX.
Alright lets go find some data. We are going to go grab data from Wikipedia again. I know, the data isn’t to reliable but it is fun to play with something that resembles real data. Below is the source of data:
https://en.wikipedia.org/wiki/Automotive_industry
To acquire the data from Wikipedia refer to this tutorial on the process. Use the Get Data button, click on Other on the left, select the first item, Web. Enter the webpage provided above in the URL box. Click OK to load the data from the webpage. For our analysis we will be completing a year over year percent change. Thus, select the table labeled By Year[edit]. Data should look like the following:
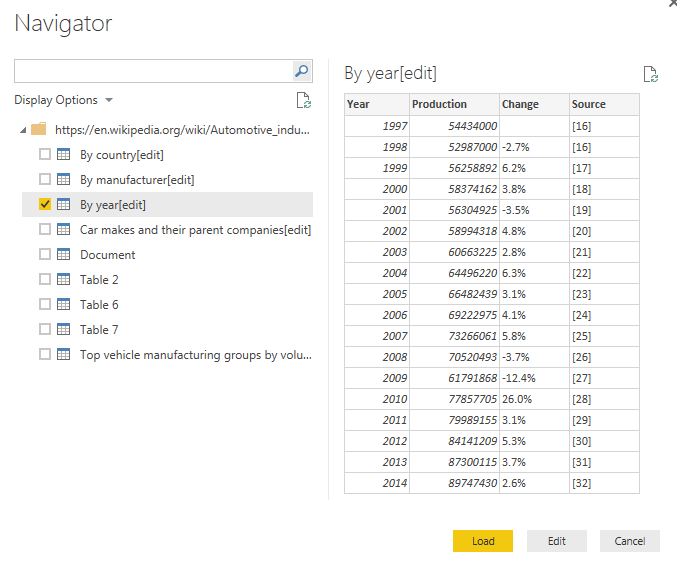
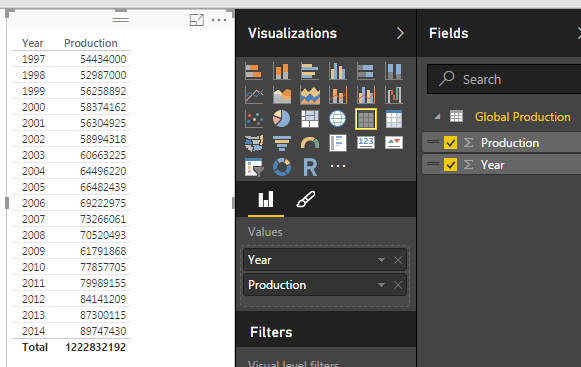
This is the total number of automotive vehicles made each year globally from 1997 to 2014. Click Edit to edit the data before it loads into the data model. While in the Query Editor remove the two columns labeled % Change and Source. Change the Name to be Global Production. Your data will look like the following:
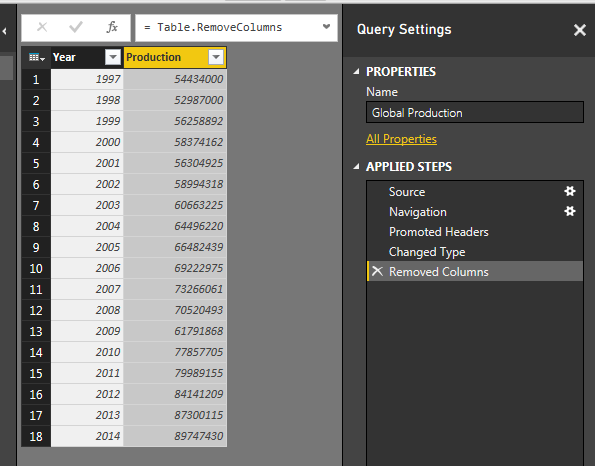
Click Close & Apply on the Home ribbon to load the data into the Data Model.
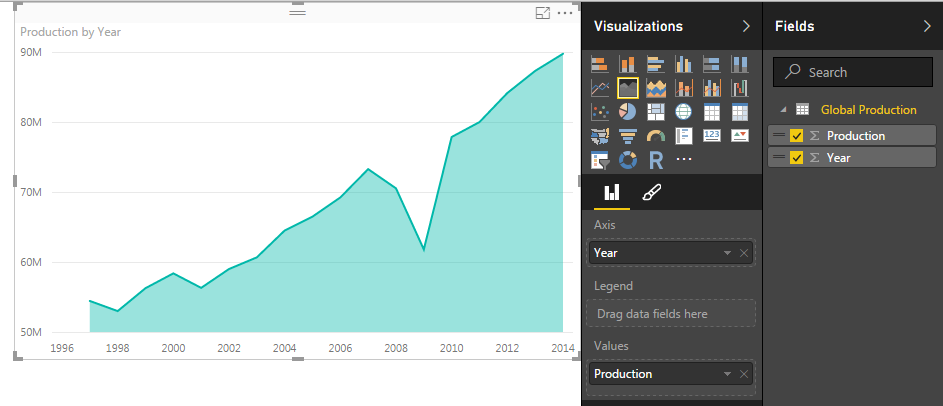
Add a quick visual to see the global production. Click the Area Chart icon, and add the following fields to the visual, Axis = Year, Values = Production. Your visual should look something like this:
Next we will add a table to see all the individual values for each year. Click the Table visual to add a blank table to the page. Add Both Year and Production to the Values field of the visual. Notice how we have a total for both the year and production volumes. Click the triangle next to Year and change the drop down to Don’t summarize.
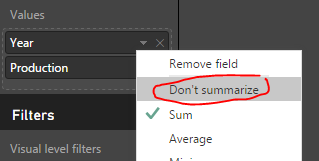
This will remove the totaled amount in the year column and will now show each year with the total of Global Production for each year. Your table visual should now look like the following:
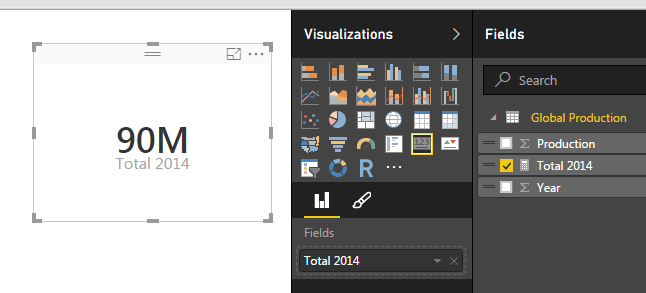
Now that we have the set up lets calculate some measures with DAX. Click on the button called New Measure on the Home ribbon. The formula bar will appear. We will first calculate the total production for 2014. We will build on this equation to create the percent change. Use the following equation to calculate the sum of all the items in the production column that have a year value of 2014.
Total 2014 = CALCULATE(sum('Global Production'[Production]),FILTER('Global Production','Global Production'[Year] = 2014))
Note: I know there is only one data point in our data but go alone with me according to the principle. In larger data sets you’ll most likely have multiple numbers for each year, thus you’ll have to make a total for a period time, a year, the month, the week, etc..
This yields a measure that is calculating only the total global production in 2014. Add a Card visual and add our new measure “Total 2014” to the Fields. This shows the visual as follows, we have 90 million vehicles produced in 2014.
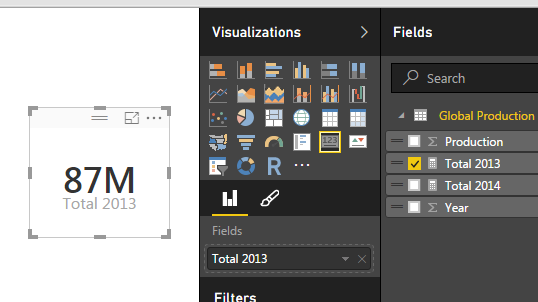
Repeat the process above instead use 2013 in the Measure as follows:
Total 2013 = CALCULATE(sum('Global Production'[Production]),FILTER('Global Production','Global Production'[Year] = 2013))
This creates another measure for all the production in 2013. Below is the Card for the 2013 Production total.
And for my final trick of the evening I’ll calculate the percent change between 2014 and 2013. To to this we will copy the portions of the two previously created measure to create the percent change calculation which follows the formula [(New Value) / (Old Value)]- 1.
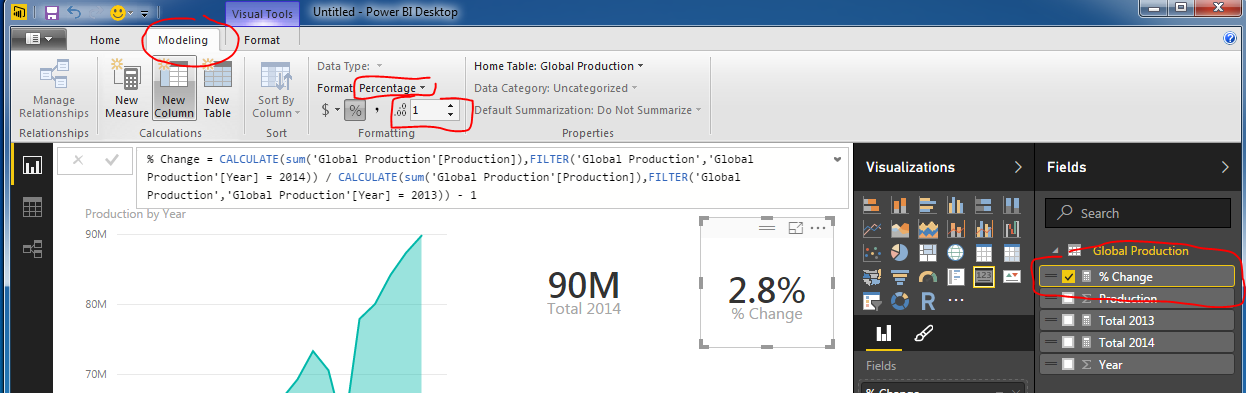
% Change = CALCULATE(sum('Global Production'[Production]),FILTER('Global Production','Global Production'[Year] = 2014)) / CALCULATE(sum('Global Production'[Production]),FILTER('Global Production','Global Production'[Year] = 2013)) - 1
This makes for a long equation but now we have calculated % change between 2013 and 2014.
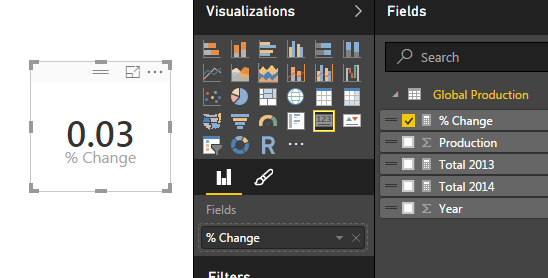
Wait you say. That seems really small, 0.03 % change is next to nothing. Well, I applaud you for catching that. This number is formatted as a decimal number and not a percentage, even though we labeled it as % change. Click the measure labeled % Change and then Click on the Modeling ribbon. Change the formatting from General to Percentage with one decimal. Notice we now have a percentage.
Thanks for working along with me. Stay tuned for more on percent change. Next we will work on calculating the percent change dynamically instead of hard coding the year values into the measures.
Want to learn more about PowerBI and Using DAX. Check out this great book from Rob Collie talking the power of DAX. The book covers topics applicable for both PowerBI and Power Pivot inside excel. I’ve personally read it and Rob has a great way of interjecting some fun humor while teaching you the essentials of DAX.
Please share if you liked this tutorial.

Can u show a demo to see %change week over week ? like: week2/week1 for series of weeks for 3-4 years
I have been getting a lot of questions about this exact tutorial. I will add it to by back log. Thanks for the suggestion.
Thanks for the information. I’m fairly new to Microsoft PowerBI and trying to figure out how to calculate “% of turnover”. I have multiple data sets to connect but also have a number of locations. I’d like to have a high level organization view of “%of turnover” but then using a dropdown for a specific location, have the data read only that locations turnover data and headcount. I’m sure it isn’t “easy” but I know it can be done. HELP!!! 🙂
Thanks in advance!
Bryan, Thanks for the comment. Here are some suggestions to get you started. When you are shaping your data, Extract Transform & load in the query editor and then Modeling with DAX. Keep in mind what you want your final visual to act like. From what you are describing, a slicer / filter manipulating a % turn over calculation will require a larger effort using the query editor. Your data table should contain all locations. It would be something like Column 1: Locations, Column 2:Time, Column 3:Headcount. This will allow you to select a location, and the measures will automatically update with the % turnover. The Time aspect gives you the comparison period which would be used in your measure. Hope that helps. Mike
I’d really like to figure out how to calculate the year over year percent change dynamically. this example has 2 measures that are for specific years. I have also seen an example where the 2 years to compare are selected on a slicer.
example the results i’m looking for in a table or matrix are
year production %change from last year
1997 500
1998 600 20%
1999 700 17%
2000 600 -17%
…
thanks in advance
Check out this detailed article on % change from SQLBI. https://www.sqlbi.com/articles/custom-year-over-year-calculation-in-dax/
This should allow you to get what you want.
Great article. Is there a way to calculate %change compared to fix year? For example, 2015 is a baseline year and I am interested in calculating % change for each year compared to 2015 like below:
2015 300 0.0%
2016 450 50.0%
2017 210 -30.0%
2018 500 66.7%
Yes, you would use a similar calculation to the following: Total 2014 = CALCULATE(sum(‘Global Production'[Production]),FILTER(‘Global Production’,’Global Production'[Year] = 2014))
This calculation does a sum of production and filters the year in the global production to 2014. Then you would use this measure [Total 2014] as the Original value as described in this article: https://www.calculatorsoup.com/calculators/algebra/percent-change-calculator.php
Thank you! Work perfectly! I have previously trouble with this since I used SAMEPERIODLASTYEAR function and on the line and cluster chart it did not show the change% between selected two selected period (2018 v 2019) correctly. It took into the chart also prior year change (2018 v 2017); thus summing two period change together. Thanks again.
Matrix table – City/Sales/Year – 2017& 2018. need formula for year/sales subtotal difference & % difference
Try this video from Enterprise DNA: https://www.youtube.com/watch?v=JNt-_QByeLk
Each and everything is so clear Mike. You’re a good author and PowerBI expert. I really appreciate it.