
Recently at work I’ve been working with a number of large data warehouses with time series data. Often when working on such data you need to incorporate a data calendar to compute date ranges. So, for this tutorial we will build a custom date table directly inside PowerBI.
Start by opening up power BI and clicking Get Data on the home ribbon, then select Blank Query. Like always make sure you start by re-naming the query into something meaningful. Change the name of the Query to Date List. Next enter the following equation into the formula bar:
List.Dates( #date(2016,1,1), 10, #duration(1,0,0,0))
Note: For more information on the M language you can visit here. Also, here is the link to the List.Dates function found here.
Once we enter the formula into the formula bar the list of dates will appear below.
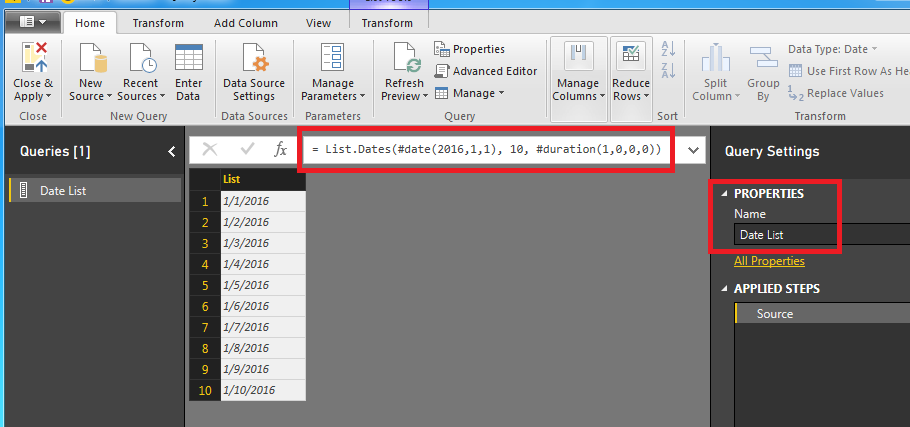
The quick explanation about the List.Dates function is below. I’ve simplified the variables below:
List.Dates( Start Date , Number of intervals , Type of interval )
While this is interesting it does not help us make a report that updates the date range dynamically. The real world use case for this would be you have a report with data that is being generated daily, say for example a website. Maybe you want a custom date range that automatically changes every day you log into PowerBI. For example if today is 08-20-2016, I want the first date to be today and then list the dates that previous 10 days.
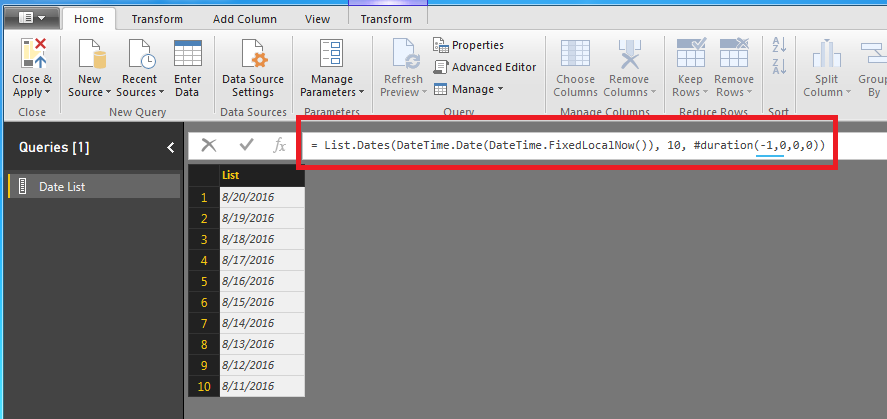
Now change the formula to the following formula:
= List.Dates( DateTime.Date( DateTime.FixedLocalNow() ) , 10 , #duration(-1,0,0,0) )
Note: In this equation we have changed the duration to -1. This is important to note because now our date table returns older dates. In our previous equation we used a positive 1 and we return future dates.
In this new equation we have defined the Start Date to the following statement : DateTime.Date( DateTime.FixedLocalNow() ) This is tricky because if you only use DateTime.FixedLocalNow() the statement will error out. The error occurs because the DateTime.FixedLoaclNow() is a date and time. The List.Dates function is expecting a Date only value. Hence why we use the DateTime.Date() function to remove the time stamp and only return today’s date.
It is most likely your date ranges will be different than the ones in the example because the DateTime.FixedLocalNow() function will be pulling in your computer’s current date.
Next modify the equation to now pull the last 90 days (highlighted in red below)
List.Dates(DateTime.Date(DateTime.FixedLocalNow()), 90, #duration(-1,0,0,0))
The list of dates is just that a list. We really can’t do to many other enhancements to our data with only a list of dates. Now transform the list into a table. Click on the Transform ribbon and select To Table. Notice now that we have a new column and a new applied step.
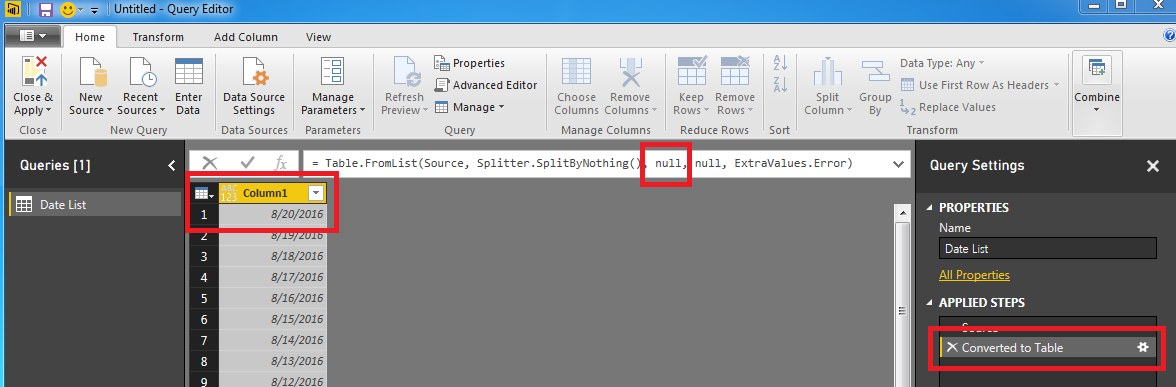
The code for the new applied steps is as follows:
Table.FromList(Source , Splitter.SplitByNothing() , null , null , ExtraValues.Error)
I colored the first null in the equation. This is actually a parameter that you can use to name the new column we just made. Tricky, Tricky, PowerBI. Modify the equation to the following:
Table.FromList(Source , Splitter.SplitByNothing() , {"Date"} , null, ExtraValues.Error)
Our table is updated and now has the name Date. Nice work!
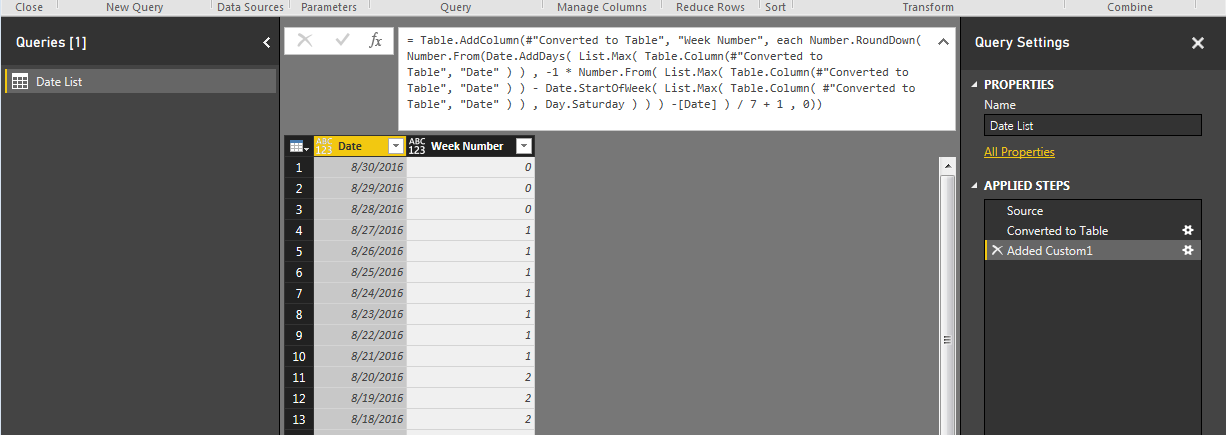
Now lets make our date list useful. Click on the ribbon labeled Add Column and then the button labeled Add Custom Column. Add the following equation to the new column and name it Week #, then click OK, to continue.
Number.RoundDown( Number.From(Date.AddDays( List.Max( Table.Column(#"Converted to Table", "Date" ) ) , -1 * Number.From( List.Max( Table.Column(#"Converted to Table", "Date" ) ) - Date.StartOfWeek( List.Max( Table.Column( #"Converted to Table", "Date" ) ) , Day.Saturday ) ) ) -[Date] ) / 7 + 1 , 0)
This equation defines the start of the week highlighted in RED. Since today is Tuesday 8/30/16, then the days 8/30 (Tues), 8/29 (Mon), 8/27 (Sunday) are considered week 0 or the current week. All dates prior will start with weekly increment.
Now we can add some logic to define week variables. Click on the Add Column ribbon and select the Conditional Column button. Using the drop downs in Column Name, Operator, Value and Output enter the following:
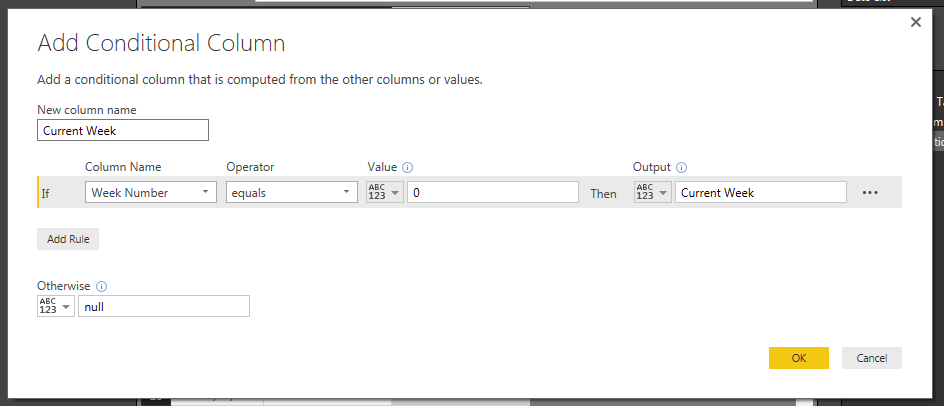
Click OK to proceed. We have now added an additional column with a text description of the week.
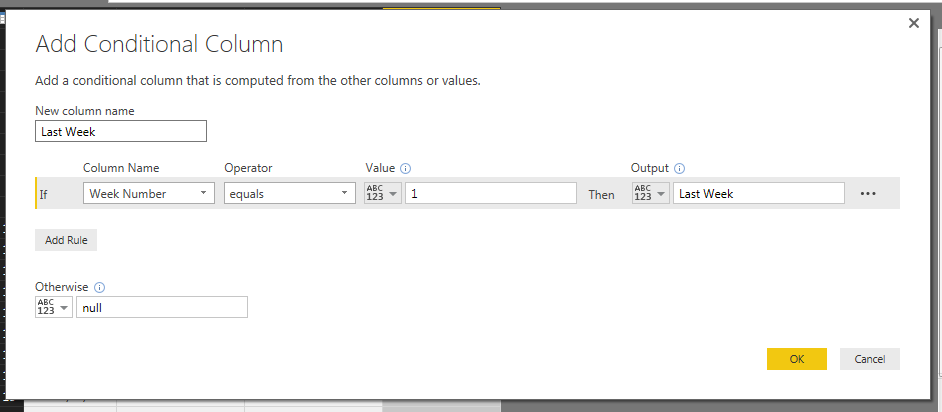
Following the add column steps mentioned above we will now add more week descriptions. Add the following conditional column for Last Week:
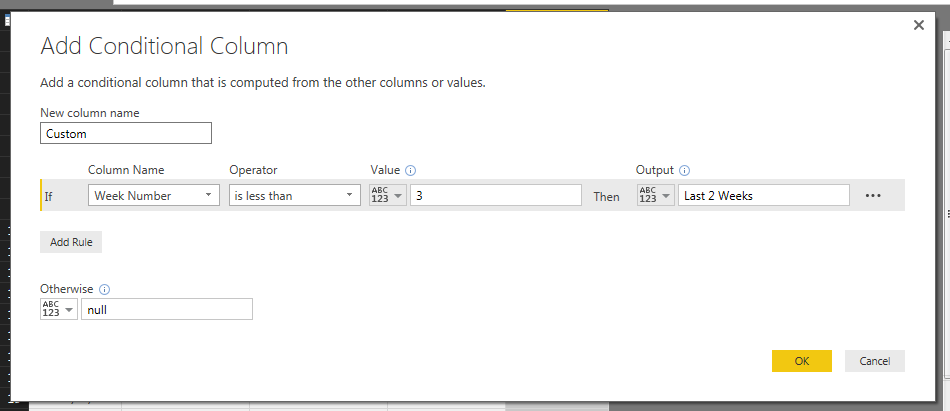
From here you can make custom columns for how you want to describe your data. In this example we will build last 2 weeks, 3 weeks and last 4 weeks. See the add conditional column logic for each of those respective weeks.
Conditional Column Logic for last 2 weeks:
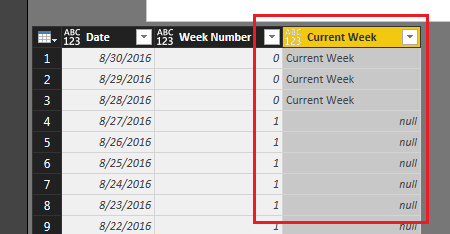
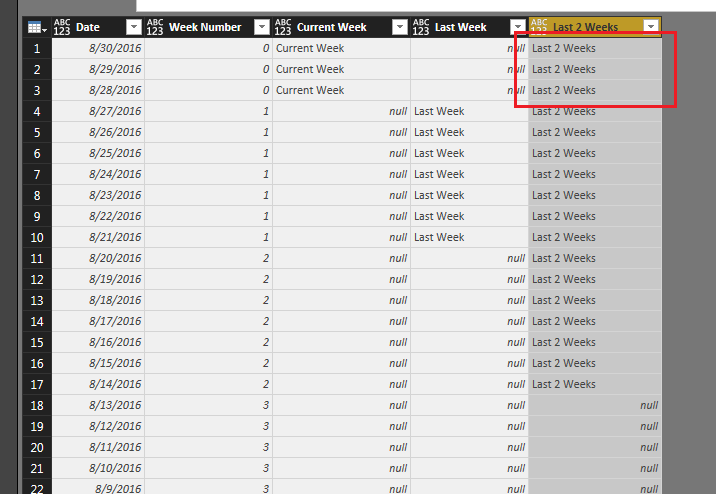
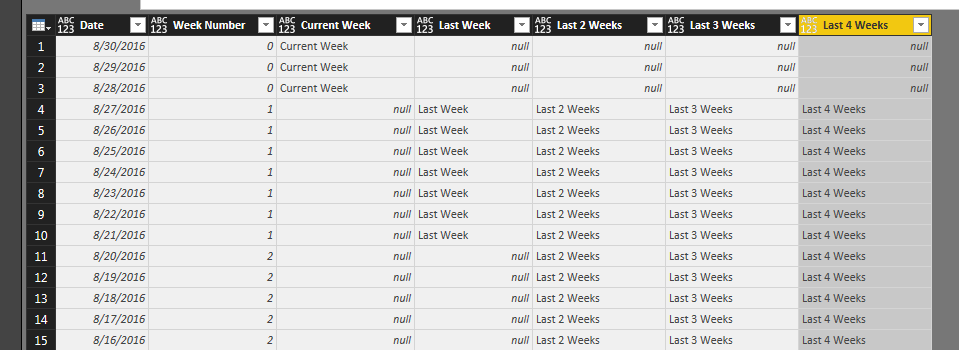
Note: When we added this conditional column we label week 0 as last 2 weeks. See image below as an example:
To fix this we modify the code that generated this column. The code initially states the following:
= Table.AddColumn(#"Added Conditional Column1", "Last 2 Weeks", each if [Week Number] < 3 then "Last 2 Weeks" else null )
We modify this code to the following: (changes highlighted in bold)
= Table.AddColumn(#"Added Conditional Column1", "Last 2 Weeks", each if [Week Number] < 3 and [Week Number] > 0 then "Last 2 Weeks" else null )
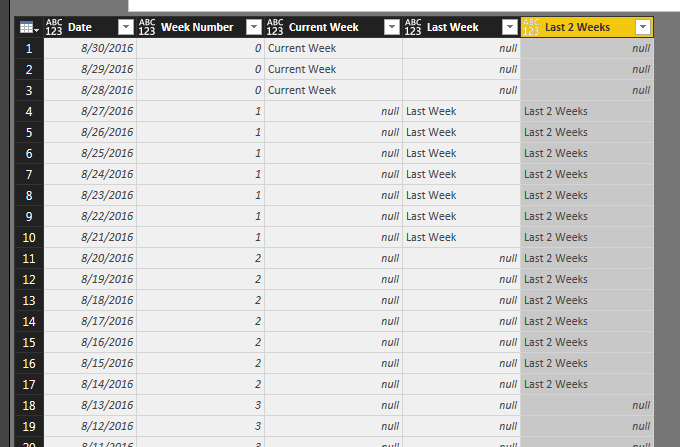
This now removes the first three days from our Last 2 Weeks column reflecting a more accurate picture of our time ranges.
Next we will add the Last 3 Weeks column and the Last 4 weeks column. Each time we will modify the add column code to remove the first three dates of the current week.
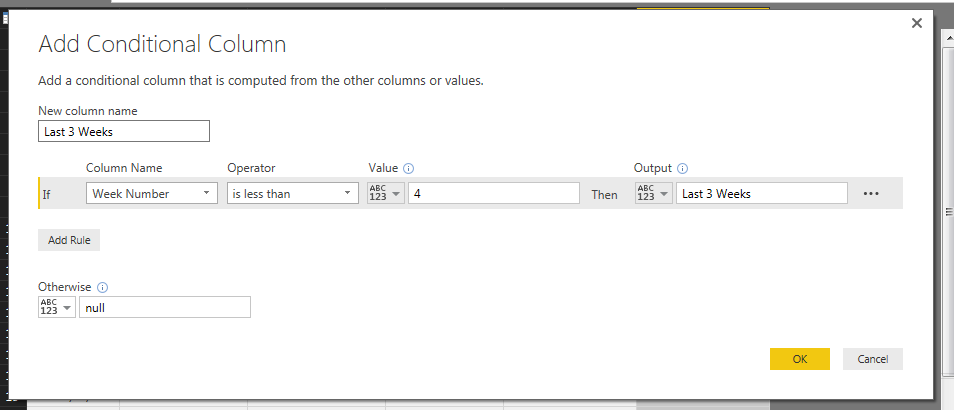
Last 3 Weeks auto generated code:
= Table.AddColumn(#"Added Conditional Column2", "Last 3 Weeks", each if [Week Number] < 4 then "Last 3 Weeks" else null )
We modify to the following to achieve the correct Last 3 Weeks data range: (changes highlighted in bold)
= Table.AddColumn(#"Added Conditional Column2", "Last 3 Weeks", each if [Week Number] < 4 and [Week Number] > 0 then "Last 3 Weeks" else null )
Add the Last 4 Weeks column:
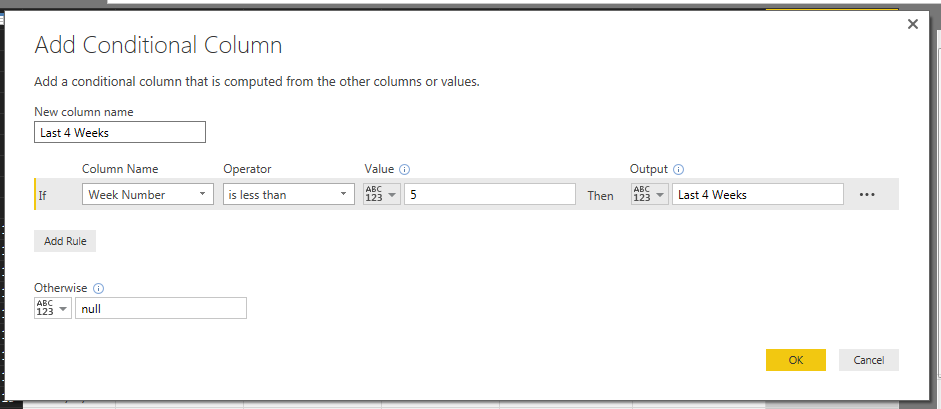
Last 4 Weeks auto generated code:
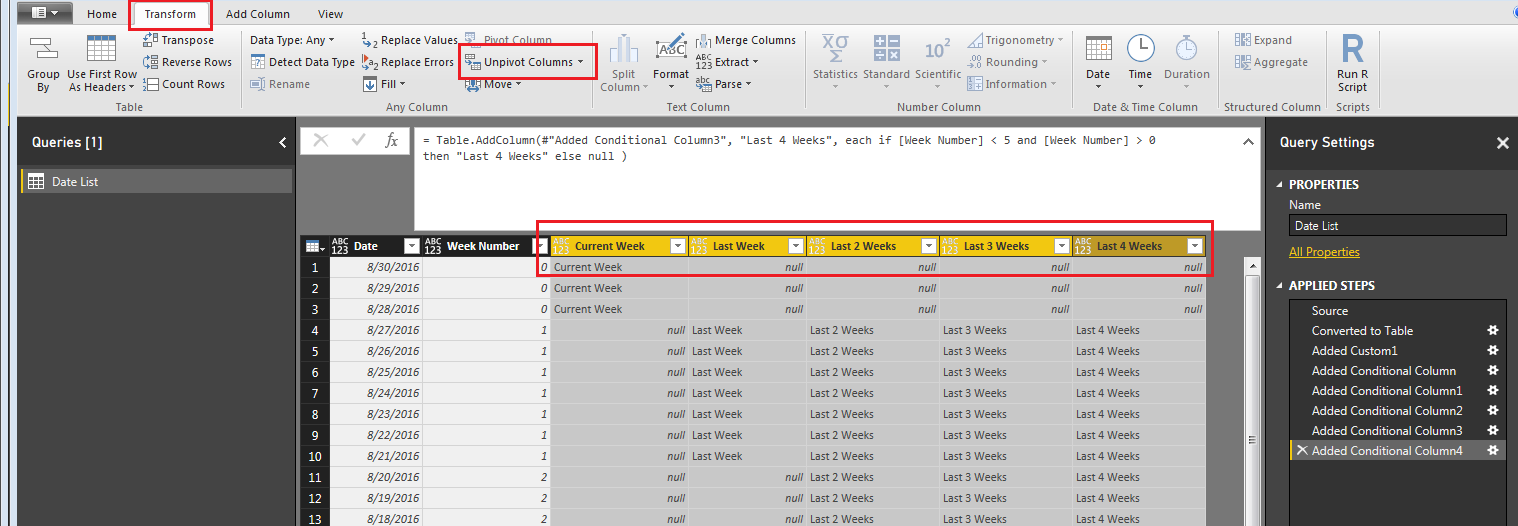
= Table.AddColumn(#"Added Conditional Column3", "Last 4 Weeks", each if [Week Number] < 5 then "Last 4 Weeks" else null )
Modify the code the following to correct the column: (changes highlighted in bold)
= Table.AddColumn(#"Added Conditional Column3", "Last 4 Weeks", each if [Week Number] < 5 and [Week Number] > 0 then "Last 4 Weeks" else null )
Nice job so far. We are almost to the end now. After all those additional columns you should have something that looks similar to the following:
Next we will pivot all the data down to one column. This will enable us to select a time period and automatically have our date table update to the specific range.
First, shift select the following columns, Current Week, Last Week, Last 2 Weeks, Last 3 Weeks, and Last 4 Weeks. Then on the Transform ribbon click the Unpivot Columns button.
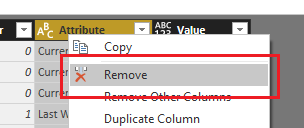
Next delete the Attribute column using a right click on the Attribute column and selecting Remove Columns.
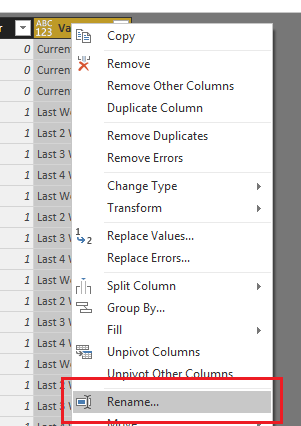
Rename the Value column to Selector by right clicking on the Value column.
Modify each column to have the correct Data Type on the Home ribbon.
Date column data type should be Date
Week Number column data type should be Whole Number
Selector column data type should be Text
Note: It is important to always check your data types for each column before you leave the Query Editor. If you don’t you’ll find that the visuals that your trying to build later on on the page view will not work as expected.
Next, click the Home ribbon and select Close & Apply. You can now build the following visuals:
A slicer for the Selector column:
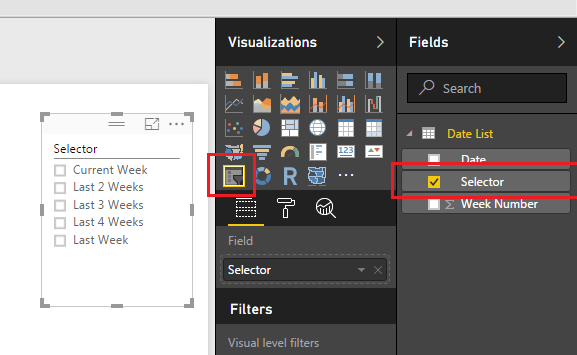
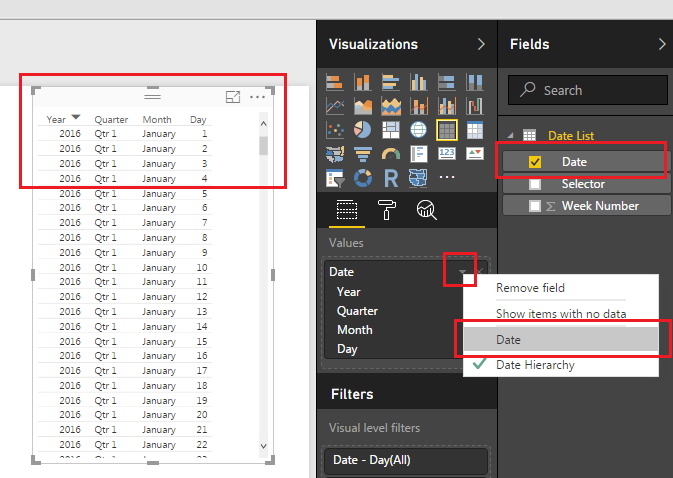
Table visual for the Date column:
Note: When you use the Date Column as the data source for the Table Visual the data will automatically be added as a Date Hierachy. This does not work well with our data so you will need to change the date from a Date Hierarchy to a standard Date. To do this click the little triangle next to the Date in the Values box. Then select Date.
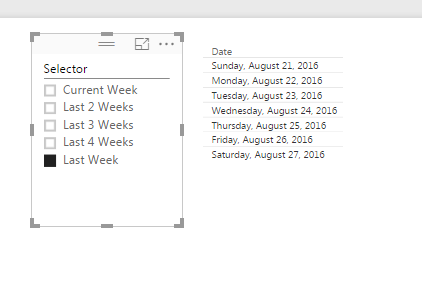
Now you can finally play around with your data and by selecting different items in the Selector slicer you can filter down to different date ranges. Below I selected the Last Week item, which filters down my dates to only the 7 days from last week.
Nice job making a custom date table in PowerBI. The nice part about this table is that it will always refresh with the latest dates whenever the queries are refreshed for this PowerBI file.
Bonus: For those of you who want to cheat and just have the M code to generate this custom date table it can be used from here:
let
 Source = List.Dates(DateTime.Date(DateTime.FixedLocalNow()), 90, #duration(-1,0,0,0)),
 #"Converted to Table" = Table.FromList(Source, Splitter.SplitByNothing(), {"Date"}, null, ExtraValues.Error),
 #"Added Custom1" = Table.AddColumn(#"Converted to Table", "Week Number", each Number.RoundDown( Number.From(Date.AddDays( List.Max( Table.Column(#"Converted to Table", "Date" ) ) , -1 * Number.From( List.Max( Table.Column(#"Converted to Table", "Date" ) ) - Date.StartOfWeek( List.Max( Table.Column( #"Converted to Table", "Date" ) ) , Day.Saturday ) ) ) -[Date] ) / 7 + 1 , 0)),
 #"Added Conditional Column" = Table.AddColumn(#"Added Custom1", "Current Week ", each if [Week Number] = 0 then "Current Week" else null ),
 #"Added Conditional Column1" = Table.AddColumn(#"Added Conditional Column", "Last Week", each if [Week Number] = 1 then "Last Week" else null ),
 #"Added Conditional Column2" = Table.AddColumn(#"Added Conditional Column1", "Last 2 Weeks", each if [Week Number] < 3 and [Week Number] > 0 then "Last 2 Weeks" else null ),
 #"Added Conditional Column3" = Table.AddColumn(#"Added Conditional Column2", "Last 3 Weeks", each if [Week Number] < 4 and [Week Number] >0 then "Last 3 Weeks" else null ),
 #"Added Conditional Column4" = Table.AddColumn(#"Added Conditional Column3", "Last 4 Weeks", each if [Week Number] < 5 and [Week Number] > 0 then "Last 4 Weeks" else null ),
 #"Unpivoted Columns" = Table.UnpivotOtherColumns(#"Added Conditional Column4", {"Date", "Week Number"}, "Attribute", "Value"),
 #"Removed Columns" = Table.RemoveColumns(#"Unpivoted Columns",{"Attribute"}),
 #"Renamed Columns" = Table.RenameColumns(#"Removed Columns",{{"Value", "Selector"}}),
 #"Changed Type" = Table.TransformColumnTypes(#"Renamed Columns",{{"Date", type date}, {"Week Number", Int64.Type}, {"Selector", type text}})
in
 #"Changed Type"


Hello Mike,
I got to your blog thanks to reference from Adam Saxton and so far I must confirm on his comment: you are killing it! (in case I got it right 🙂 Great post on dates. Thanks!!
Hi Mike,
Great article! I am trying to change the number of days table can go back. I want 2 years of dynamic date table. I tried adding 730 where you have 90 but still doesn’t show right results. Not sure what I am doing wrong.
In the Query editor between the step labeled “Added Conditional Column4” and Unpivot Columns, you should add additional steps that denote additional time slicers that you need. For, example if you need the last 6 months, you would have to add a new column with the following formula:
if [Week Number] < 26 and [Week Number] > 0 then “Last 6 Months” else null
Also, if you wanted to add the last year, add a column with the following equation:
if [Week Number] < 52 and [Week Number] > 0 then “Last 52 weeks” else null
What is happening, is that when you use the Unpivoted Columns command any values that have a null are ignored and not brought in. By adding more columns that accommodate the longer date ranges you are able to build the correct length of the reference date table.