
Milwaukee Brew City PUG – April 2020
The Milwaukee Brew City PUG for April kicks off with some quick updates and highlights of upcoming events. We spend a quick minute on why we’re so excited about the fantastic line up of webinars […]

The Milwaukee Brew City PUG for April kicks off with some quick updates and highlights of upcoming events. We spend a quick minute on why we’re so excited about the fantastic line up of webinars […]

I was recently working on some new ideas for a Scrim when I stumbled upon something interesting. A scrim is pretty specific in its layout, and this one is no different. The images are set […]
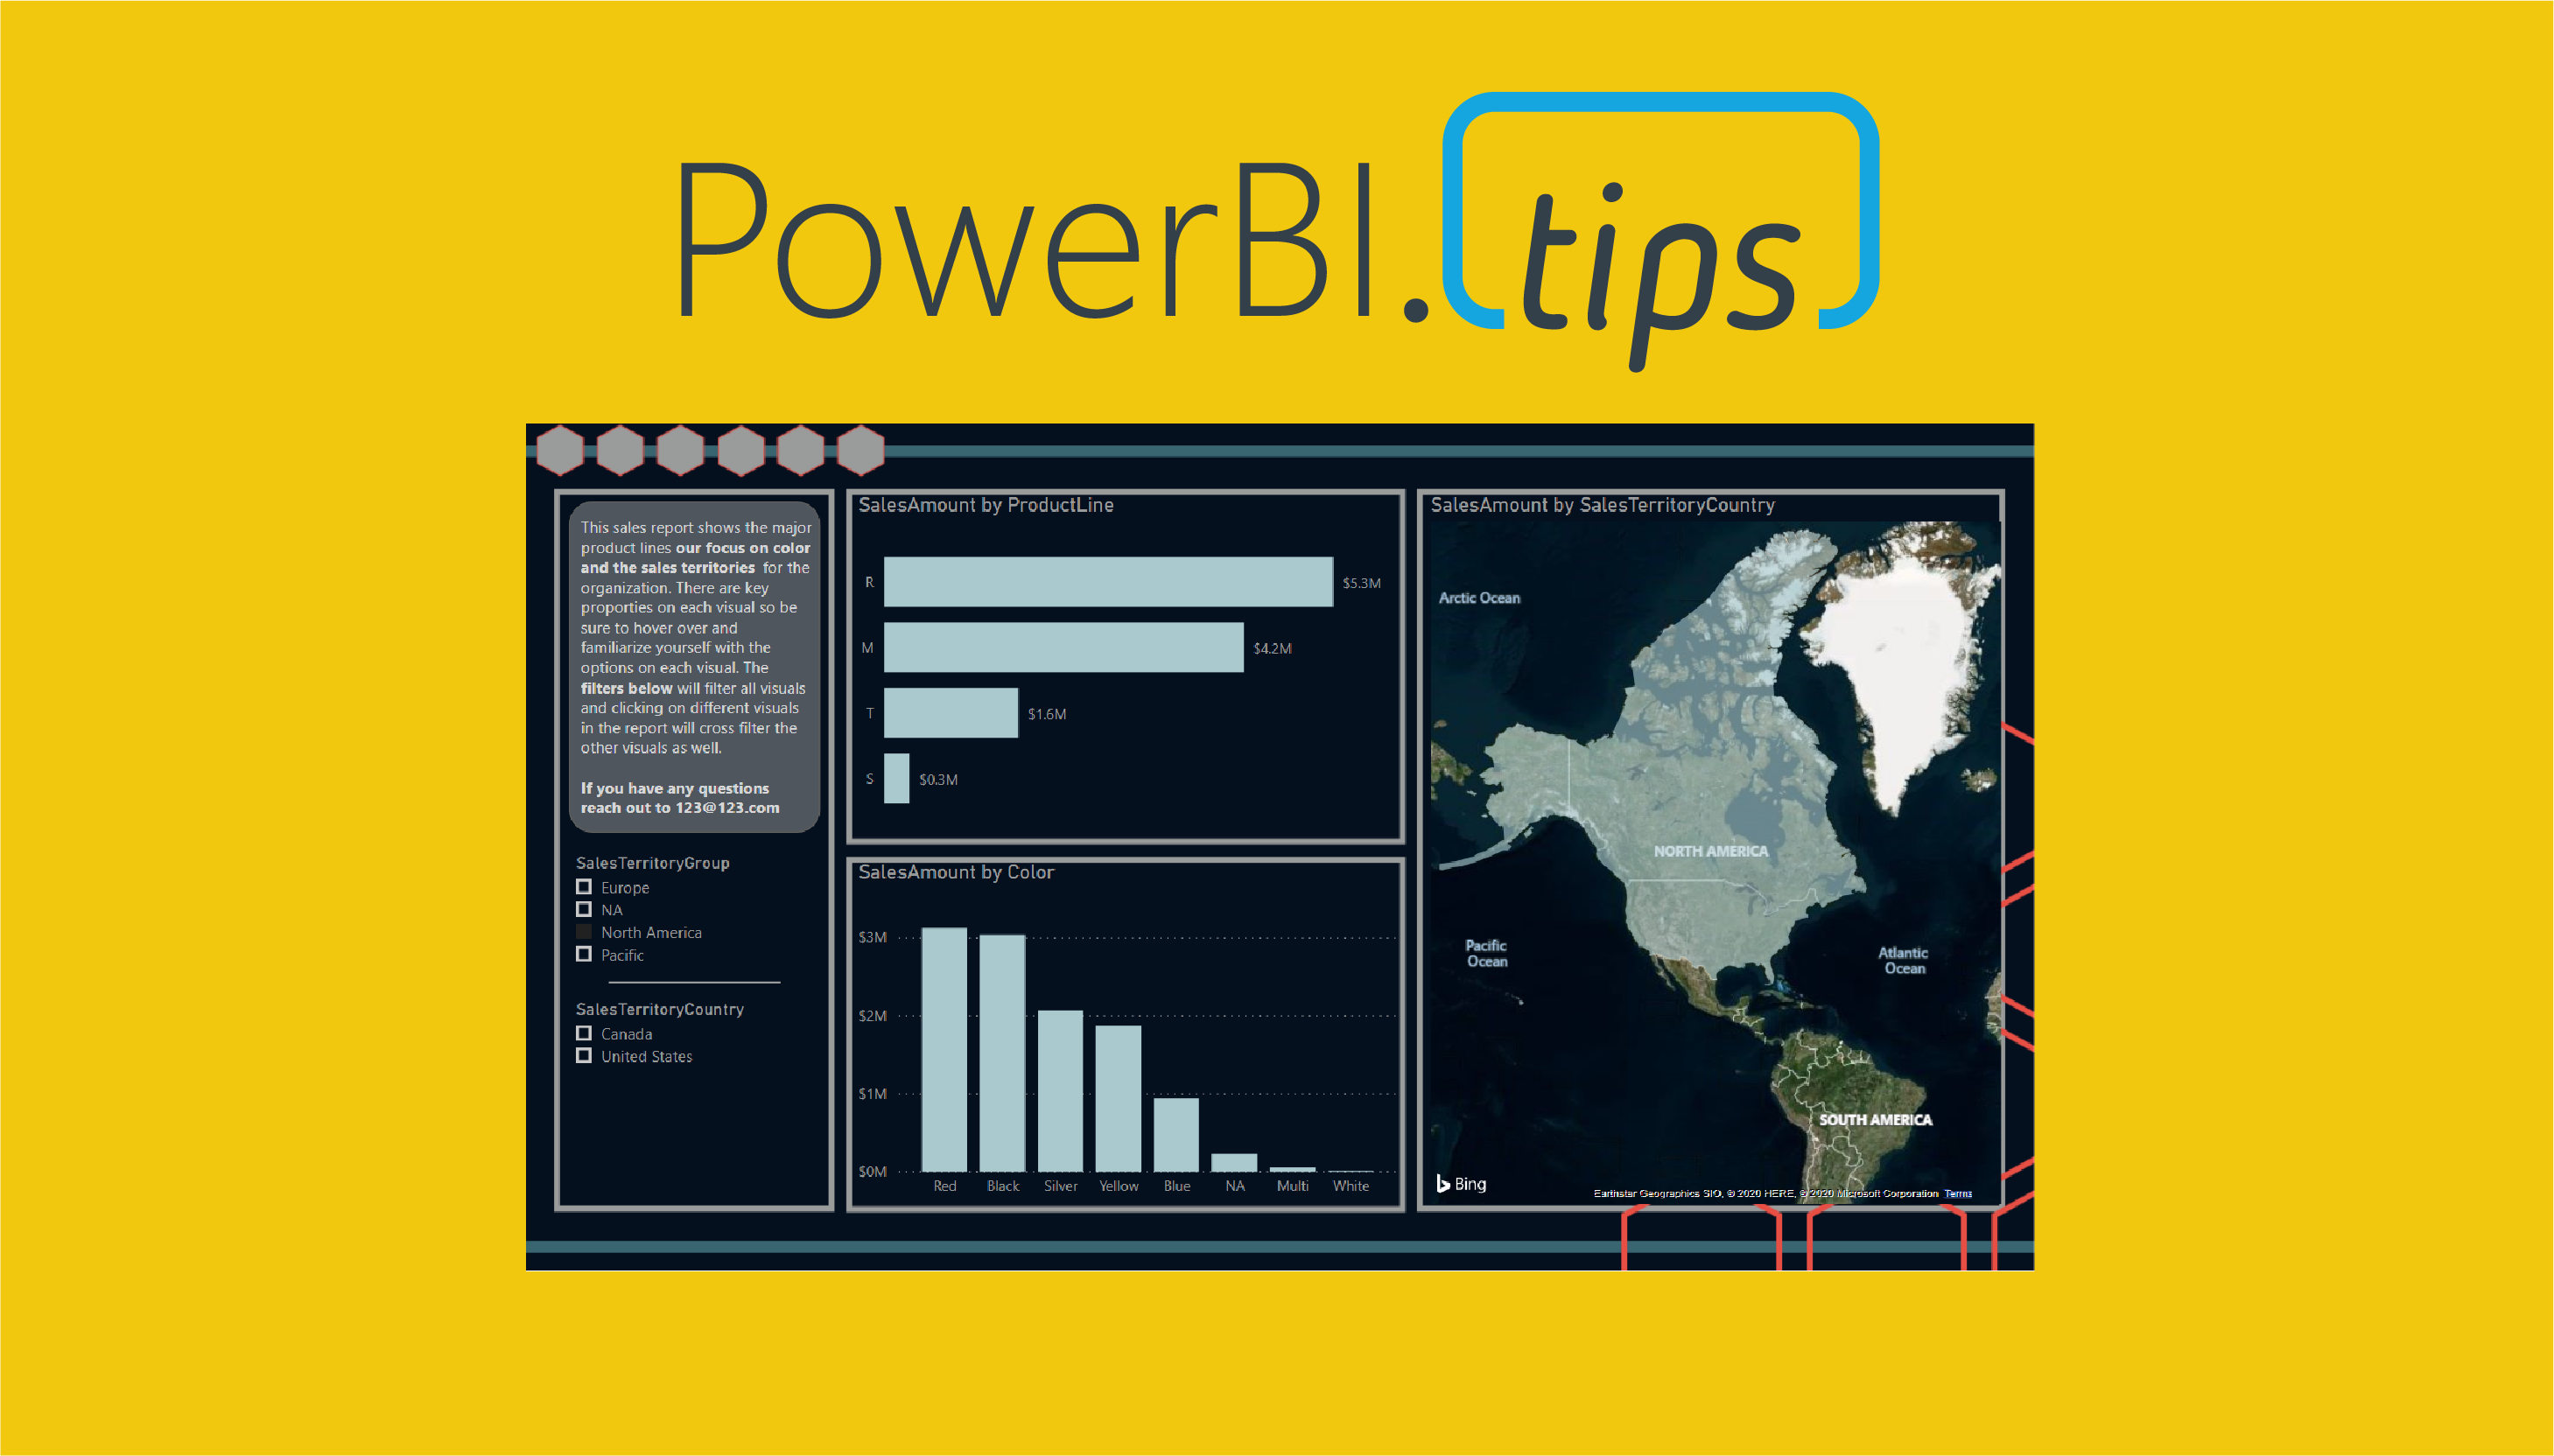
As a report author it is important that you build the necessary context for your end users. The main areas most often needing context either relate to the data or functionality contained within the report. […]
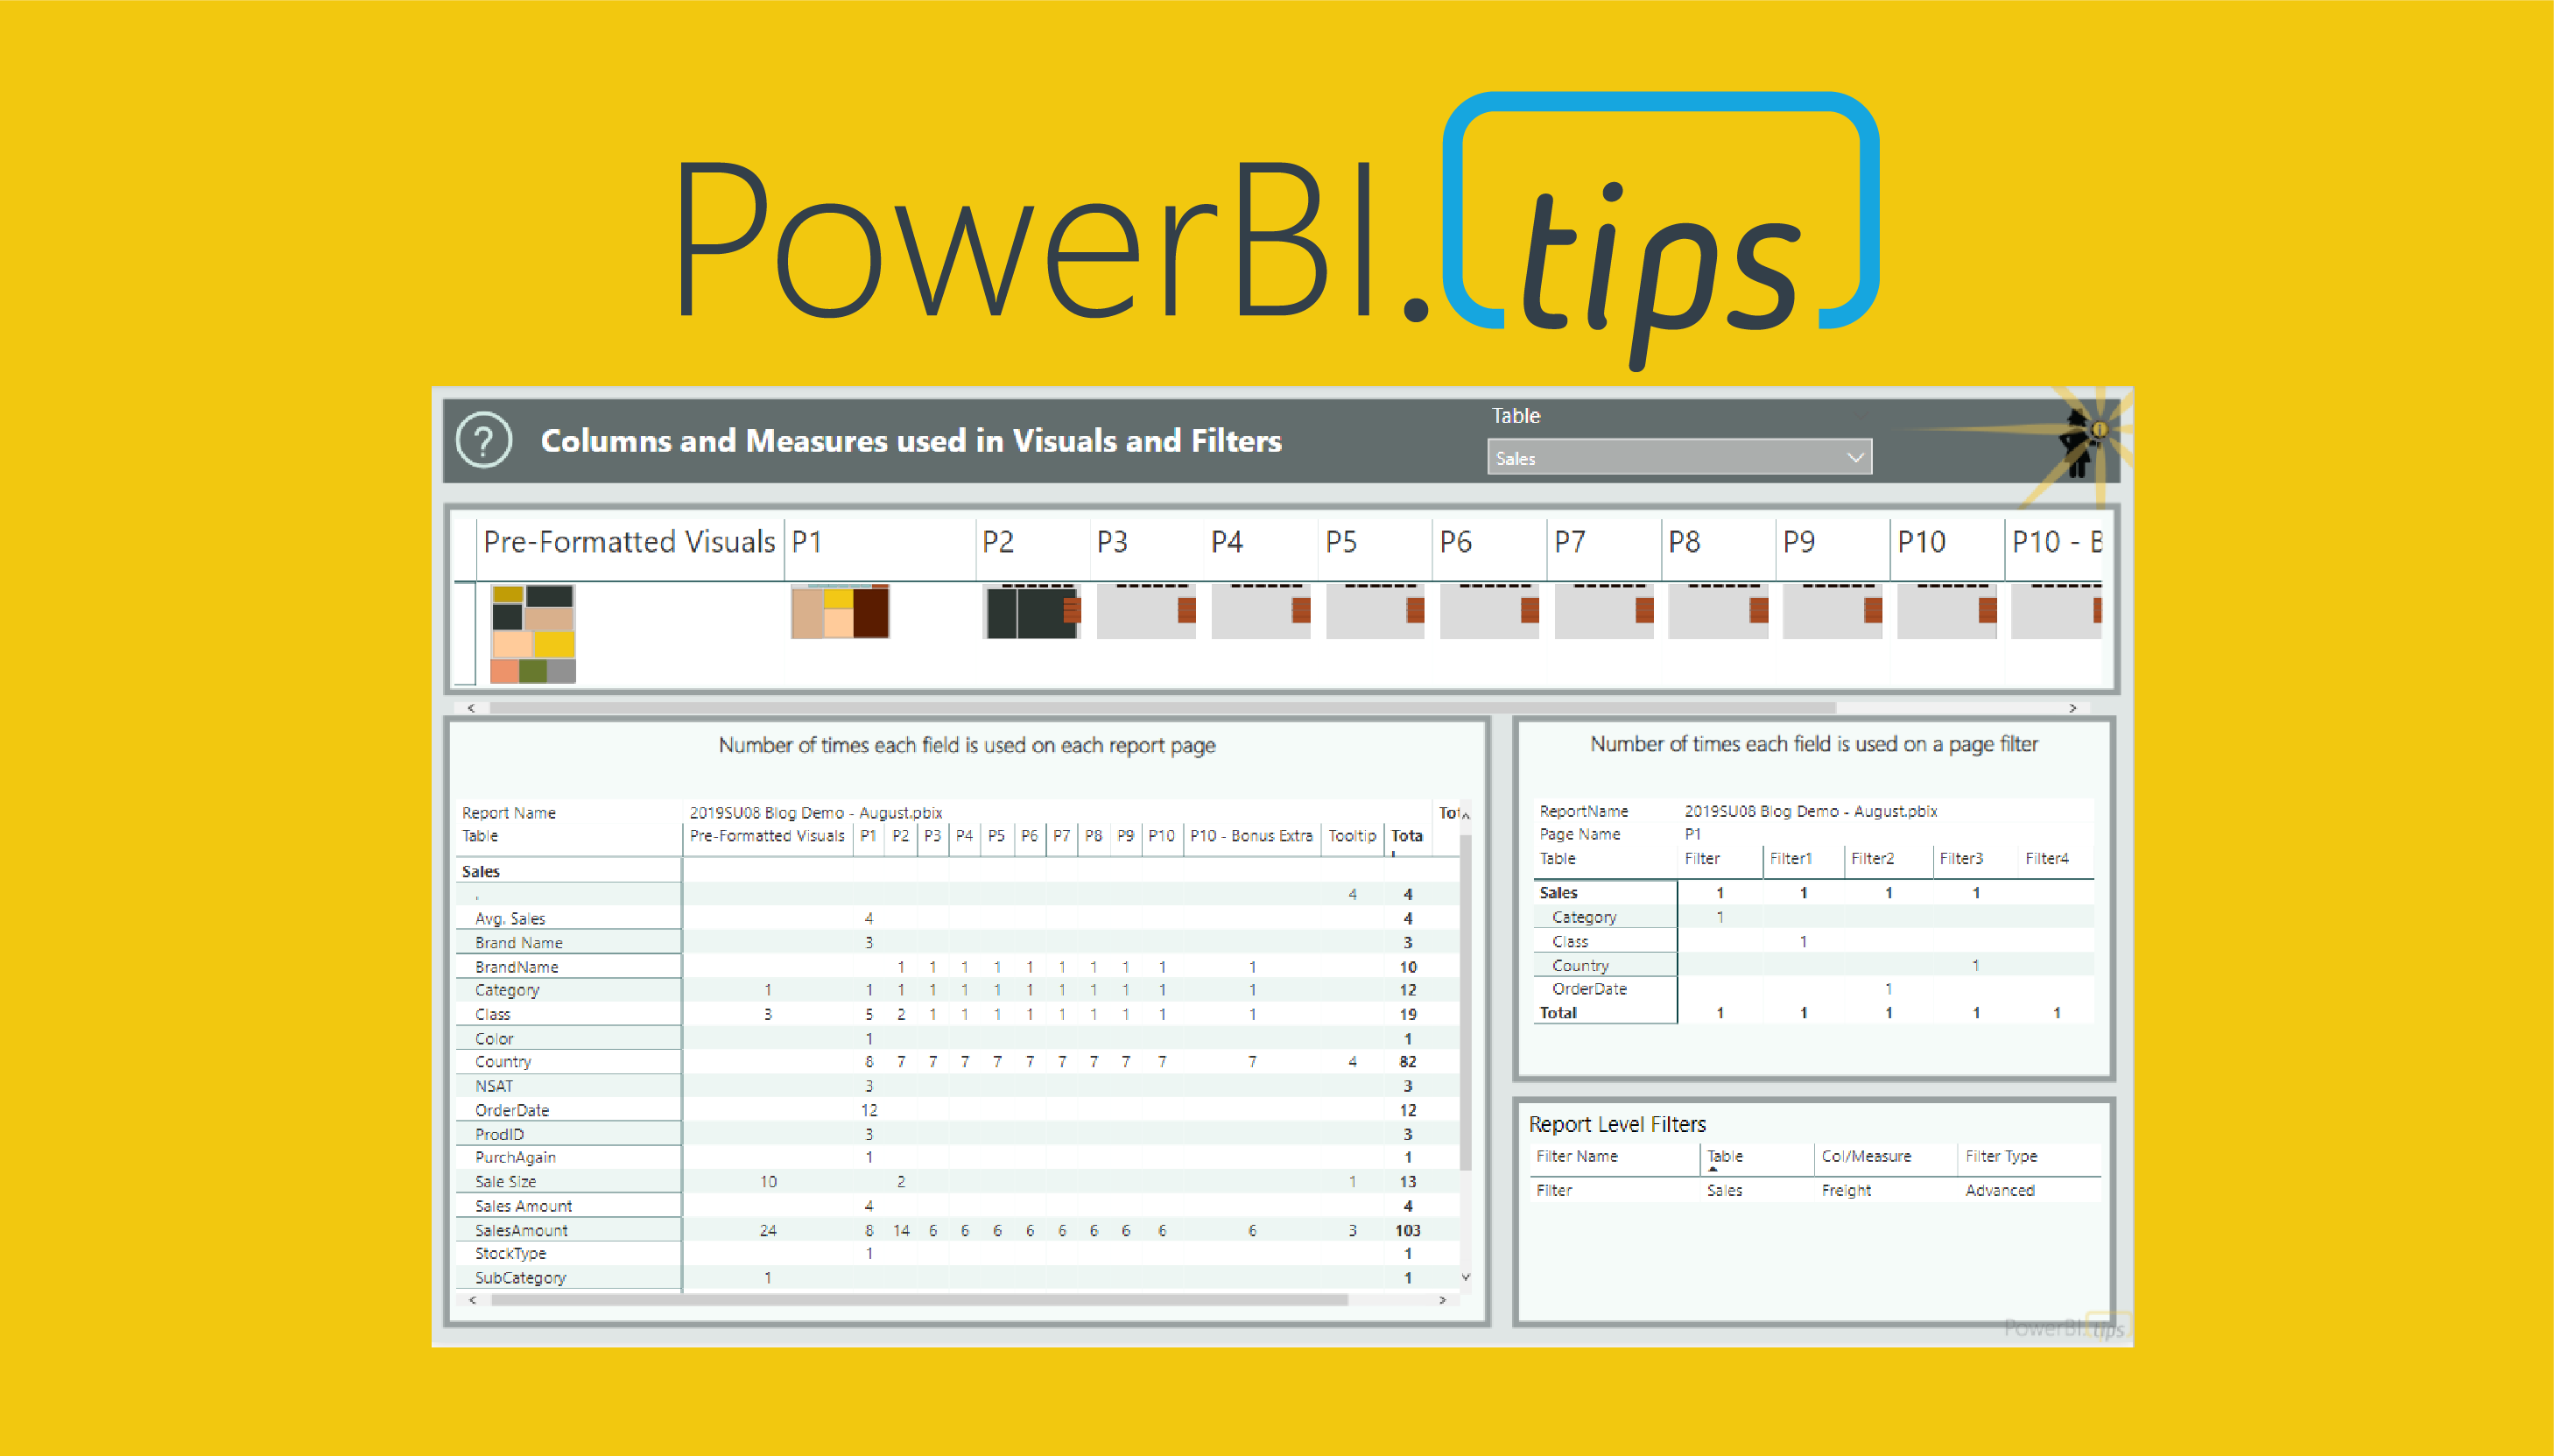
If you’re like me, building a data model in Power BI is an iterative process. Sometimes, you try out different ways of writing measures before you hit on the one that’s right. You end up […]
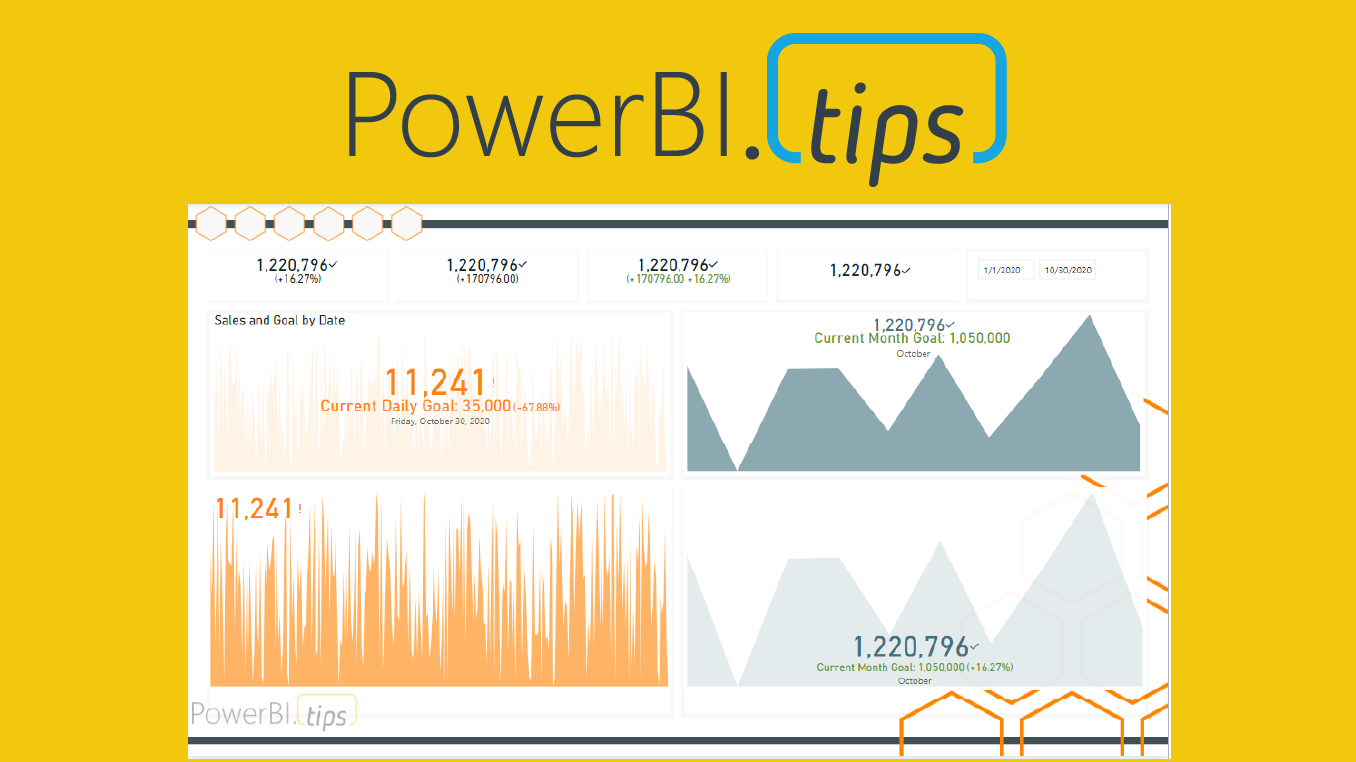
KPIs are a key visualization type used to convey high level metrics to the end users. They provide an at-a-glance metric that allows business users to know whether they are on track or off-track. Over […]
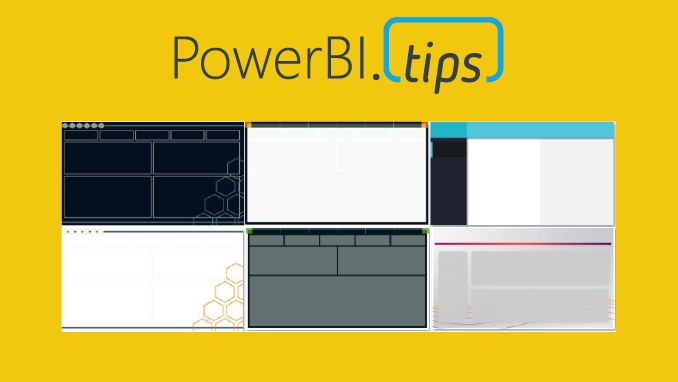
PowerBI.tips is excited to announce our new tool to help you build the best looking reports, Scrims. We’ve built out a fast and easy solution for snapping visualizations into place while giving your reports the […]
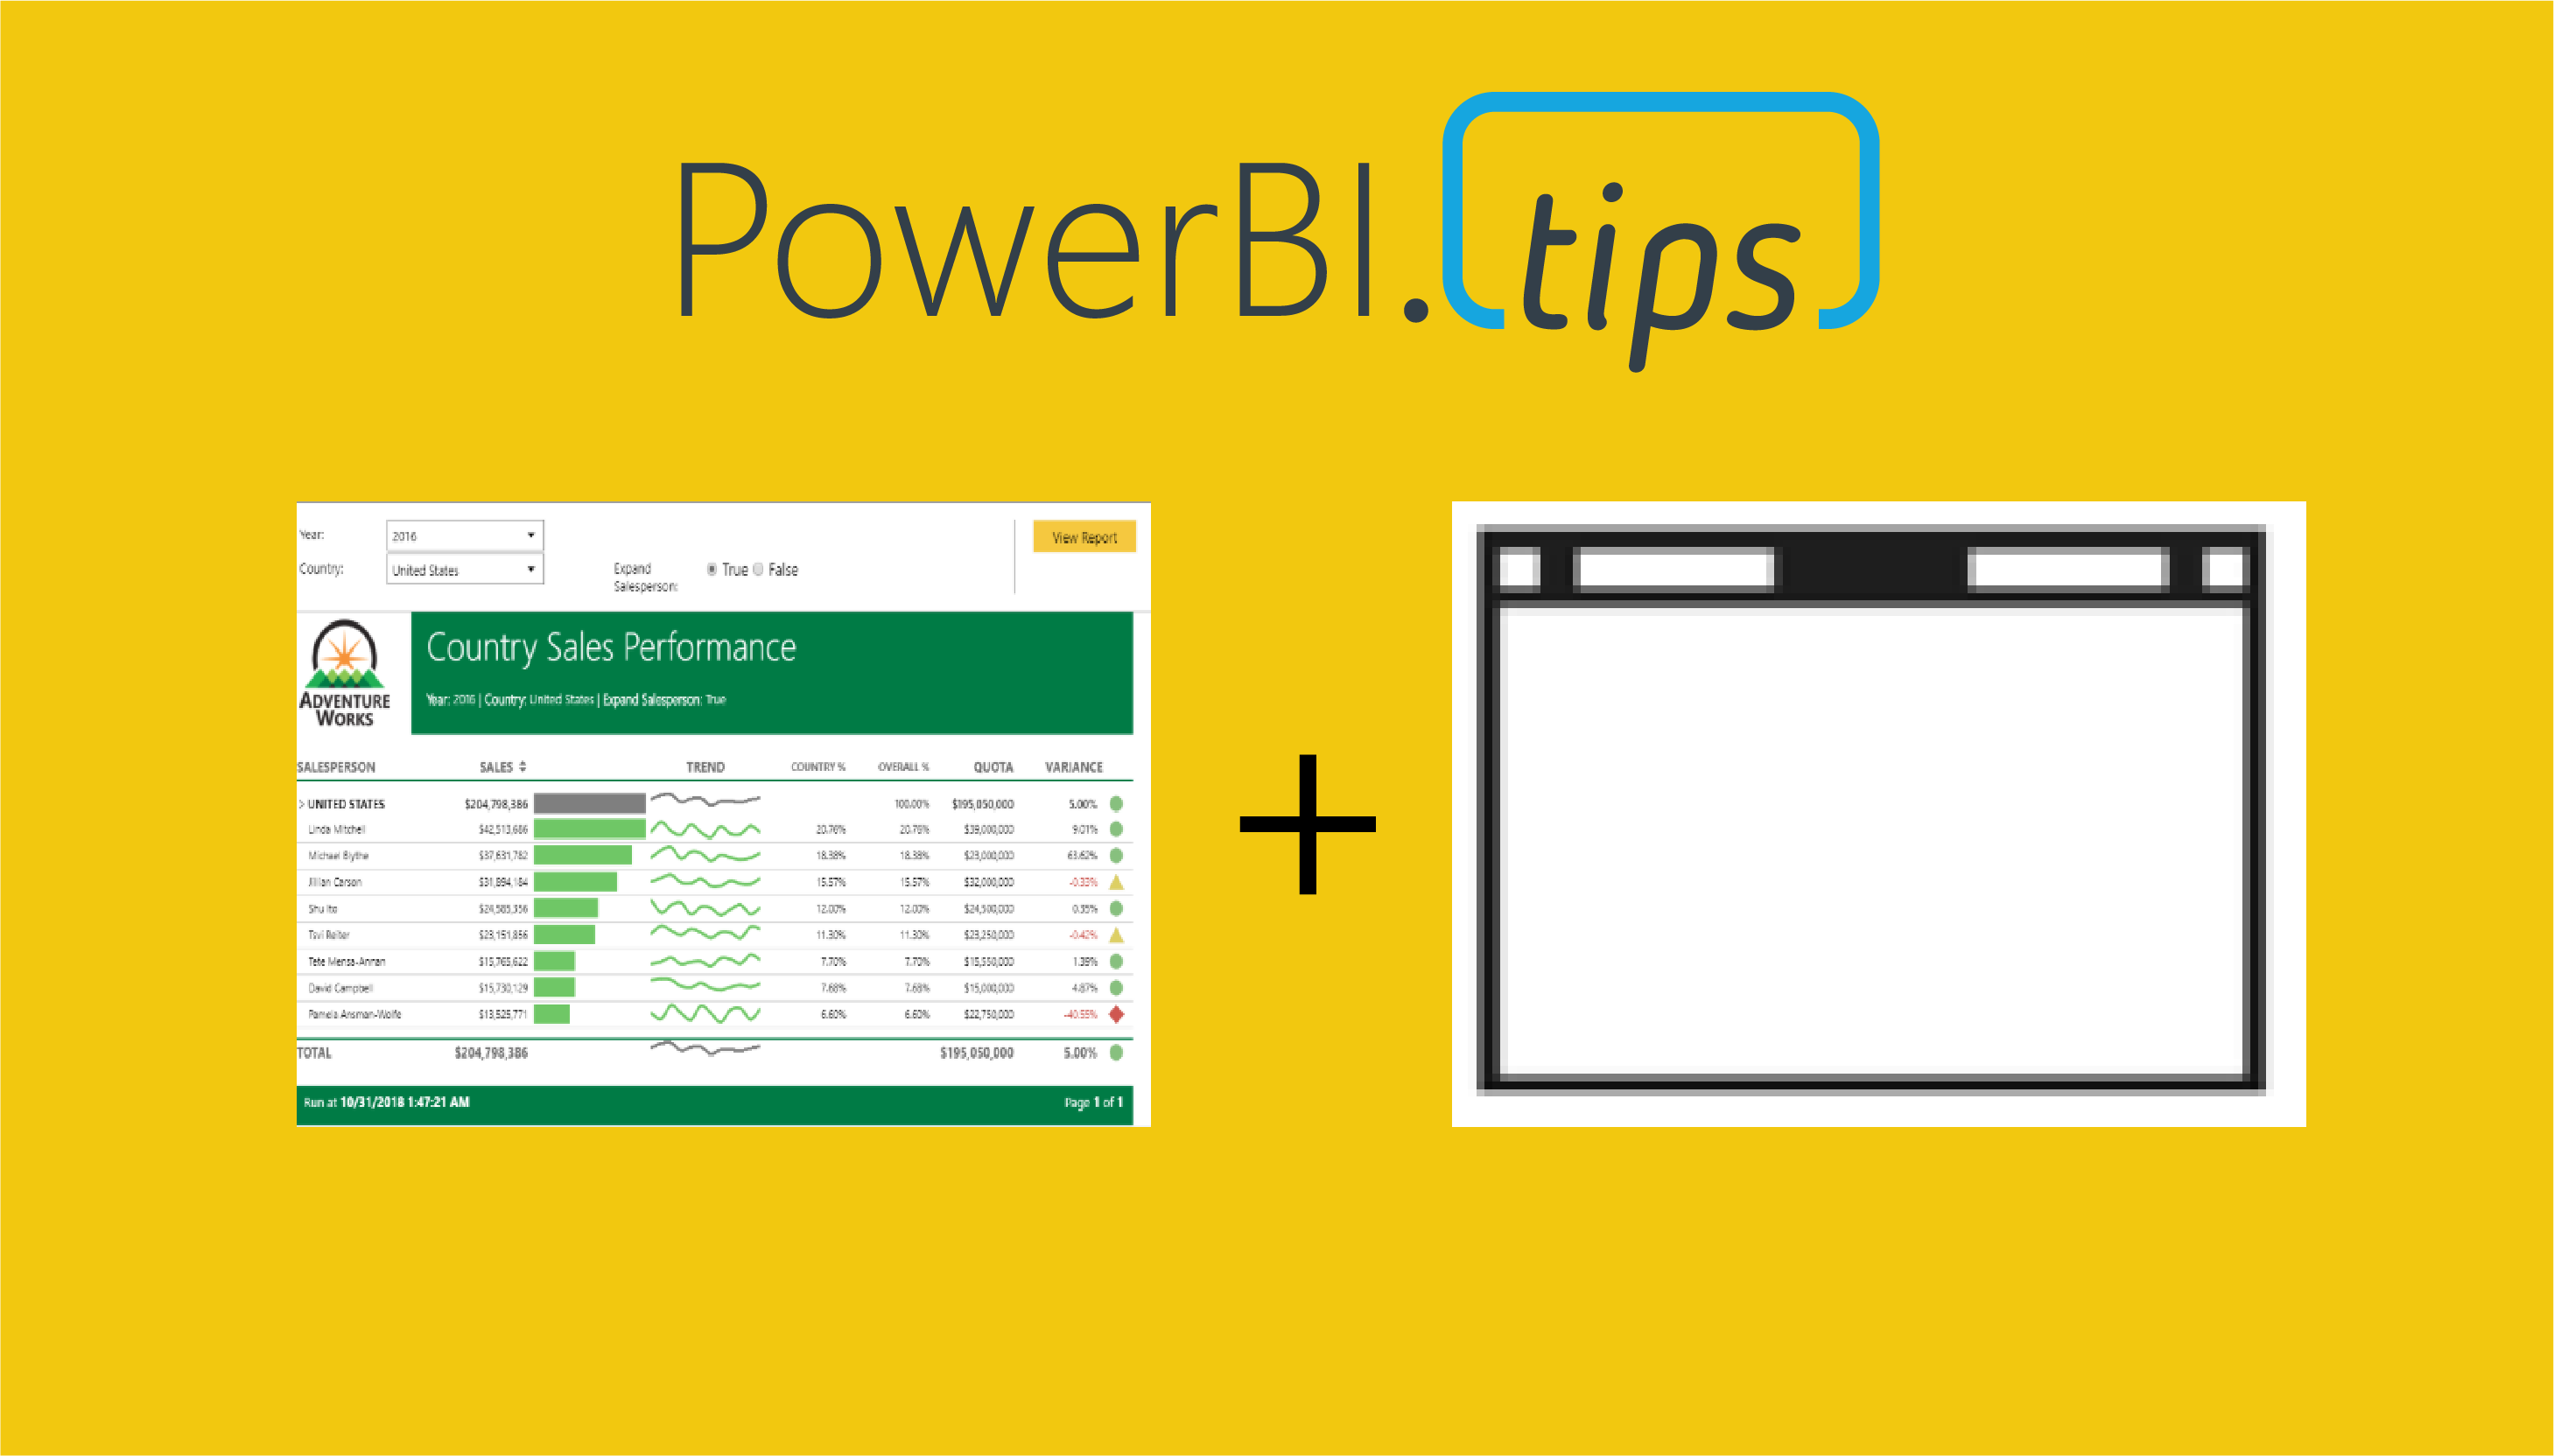
Over the course of time Power BI has come to encompass a wide variety of technologies and tools. One such product that has been integrated into the suite of Power BI is paginated reports. Before […]
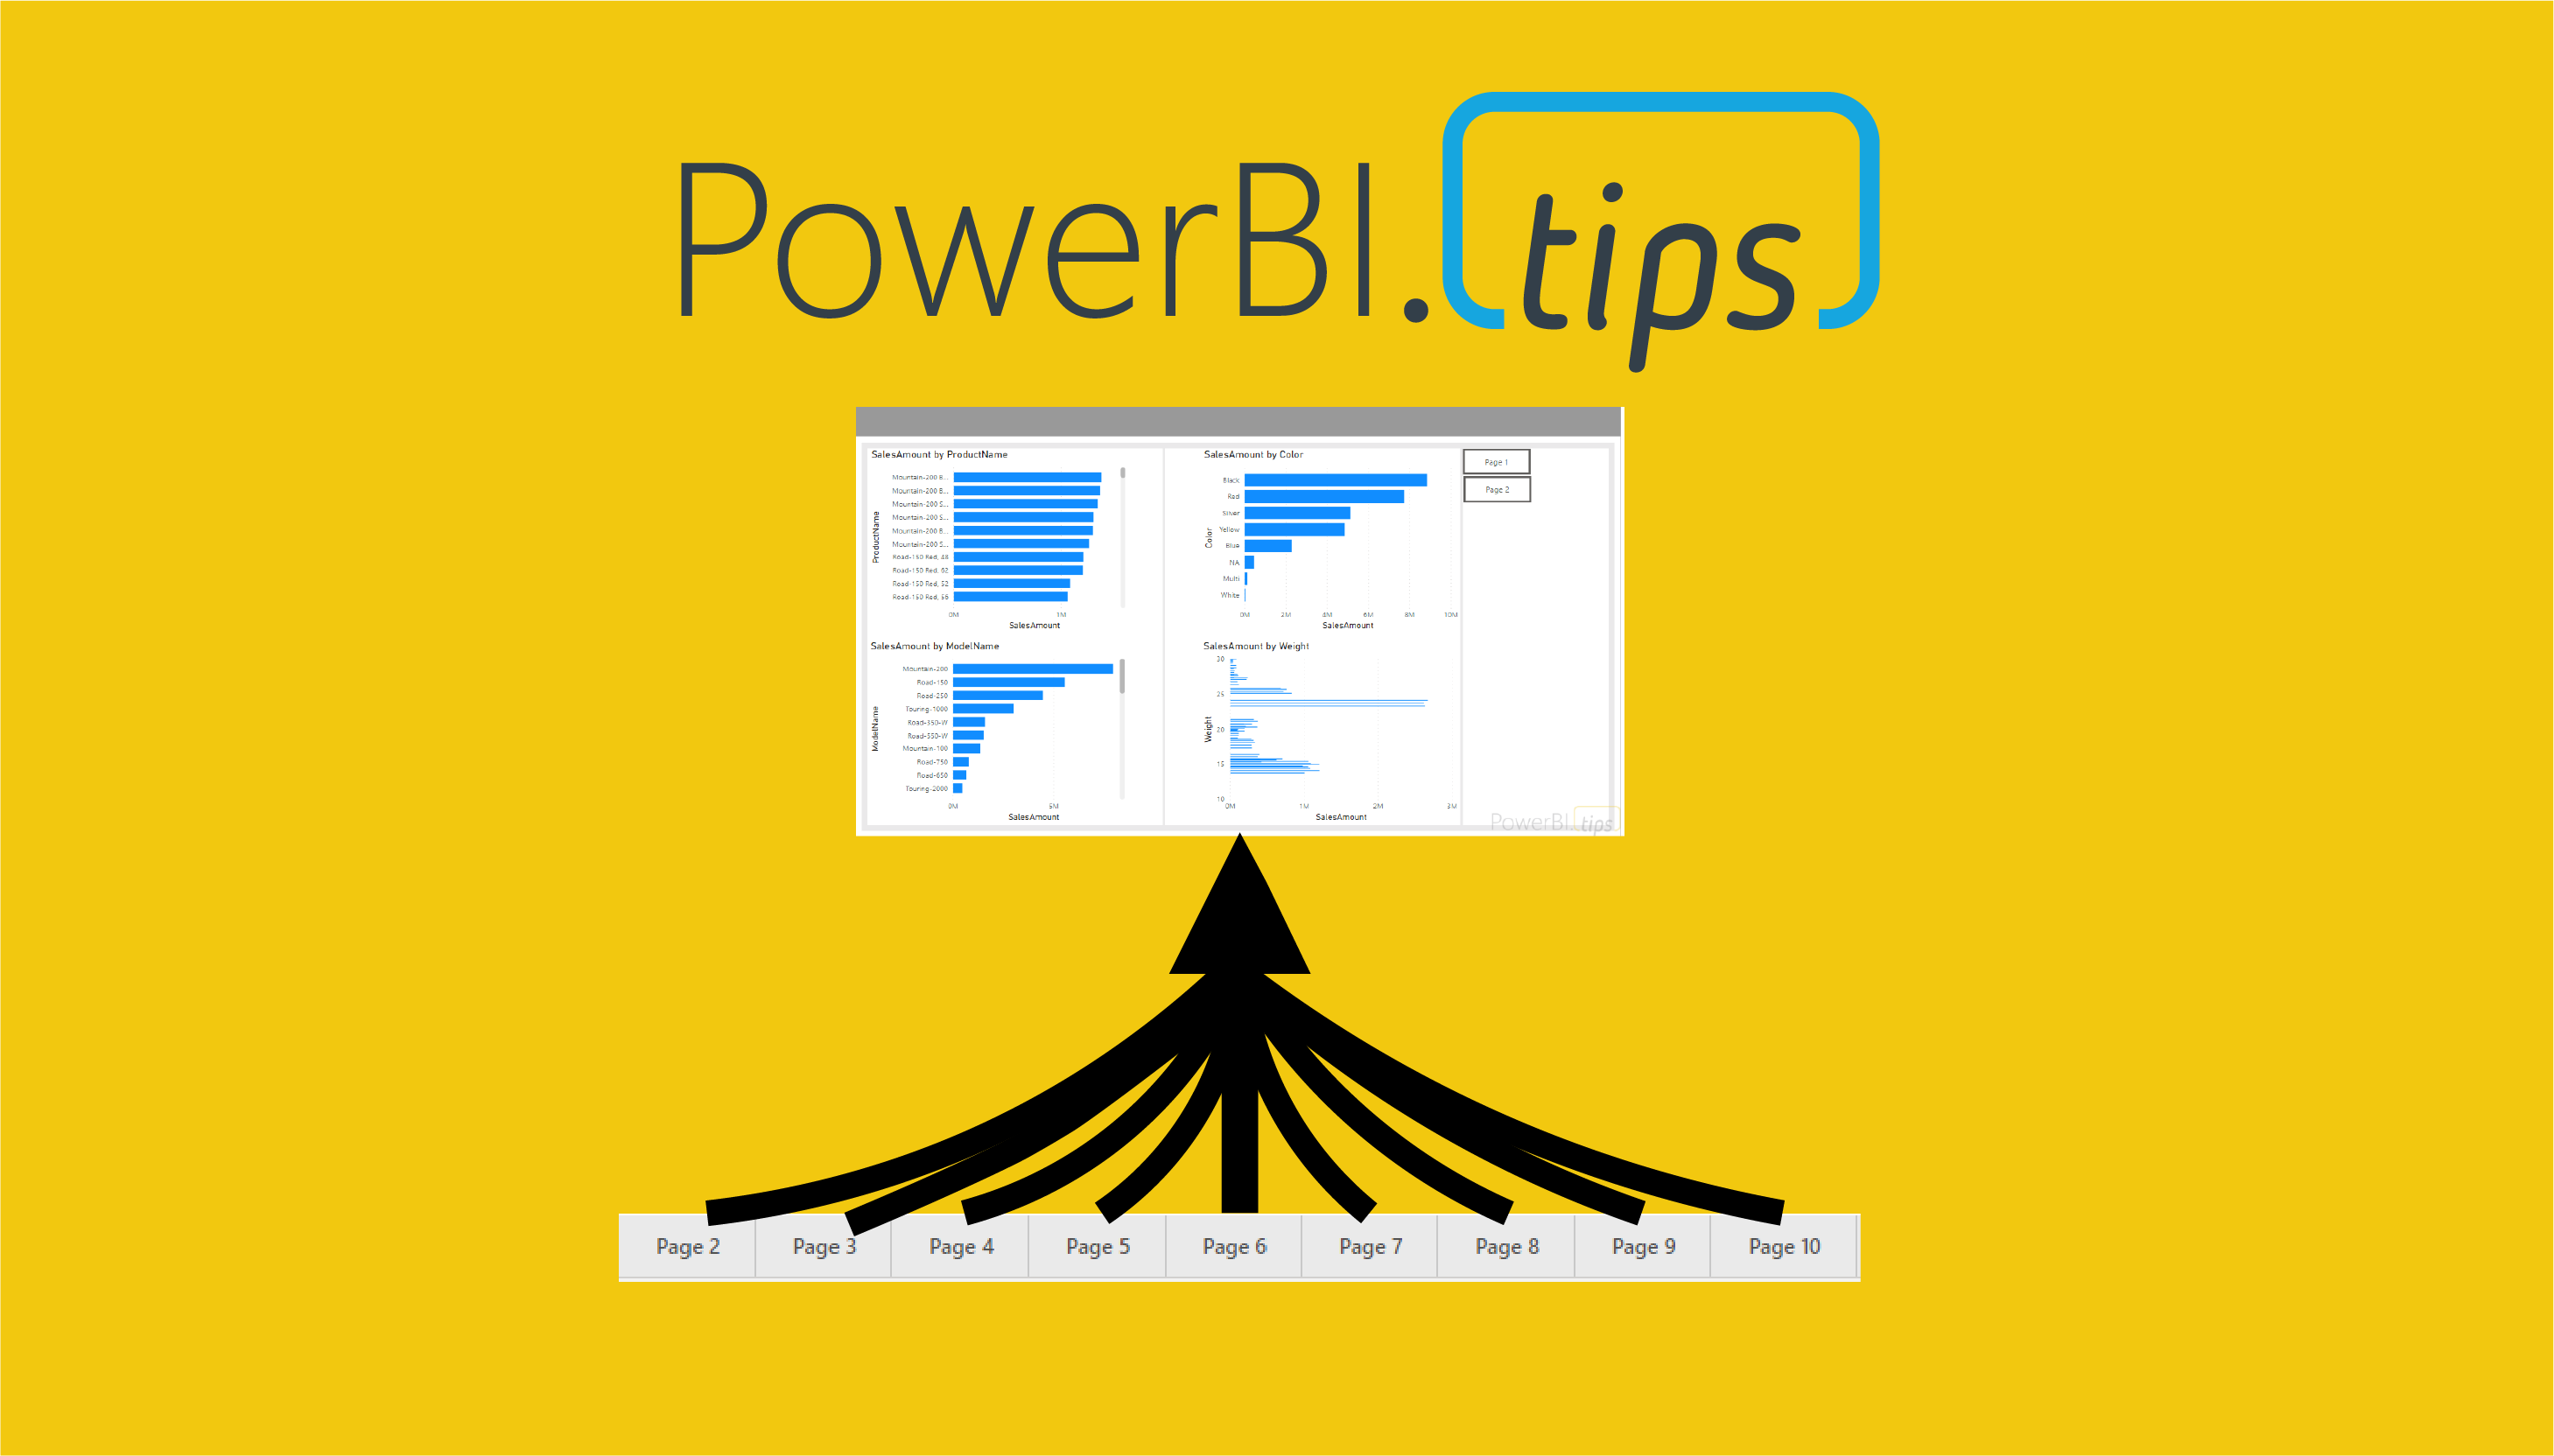
We do a ton of Layouts here at powerbi.tips and with the introduction of the new visual grouping feature I was looking for different ways I could utilize that functionality to make templates for different […]
Power BI requires a gateway for refreshing on premises data sources. There are a myriad of different data sources that you can create and two different ways you can set up the gateway. The first […]

As a user that builds Power BI reports, did you know the different technologies that come into play when you interact with the tool? This is one of the first questions I ask to new […]
Copyright © 2024 | MH Magazine WordPress Theme by MH Themes