Report Visualization Tips
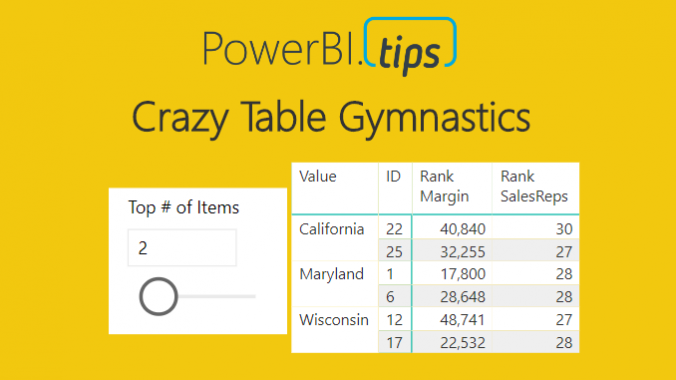
Crazy Table Gymnastics – Part 1 – Dynamic Column Categories
When I teach Power BI to new users, there are typically questions about how to get Power BI to act more like Pivot Tables in Excel. Through my discussions, two key pieces of functionality stand […]