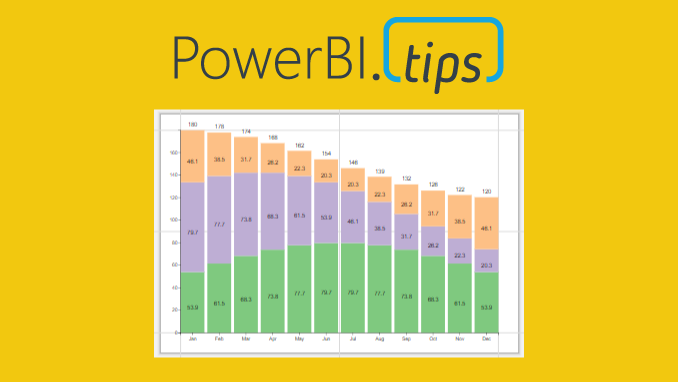
For this week we are building a stacked bar chart on https://Charts.PowerBI.Tips. While you can build this type of chart within Power BI Desktop this video is more of an example showing how you can build a similar custom visual chart. There are two areas that i’d like to point out.
- When working with a chart you can add a Legend to a shape object (2:40)
- Adding a grand total requires an additional Glyph (3:14)
While these two tips are pretty simple it really does help you when building more complex custom visuals.
Watch the Tutorial
Download this Custom Visual
If you liked this visual and want to download it, head over to this repository to download.
Learn More About Custom Visuals
We have been working hard to help you learn how to make custom visuals. Check out our full YouTube Playlist to learn more about using Charts.PowerBI.Tips.
If you like the content from PowerBI.Tips please follow us on all the social outlets. Stay up to date on all the latest features and free tutorials. Subscribe to our YouTube Channel. Or follow us on the social channels, Twitter and LinkedIn where we will post all the announcements for new tutorials and content.
Introducing our PowerBI.tips SWAG store. Check out all the fun PowerBI.tips clothing and products:
Check out the new Merch!