Welcome to a fast way to create reports, that look good. Watch the video below to learn how to use layouts to increase your reporting productivity.
Purchase these layouts and get started today:
[products category=”Layouts” Tag=”Paid”]
Additional Samples of Layouts:
[products category=”Layouts” Tag=”Free”]
Here is how to use and connect your data with Layouts.
What is in Each Download?
Each Layout download from PowerBI.Tips includes a minimum of three files:
- Demo file (denoted by Demo at the end of the file name)
- Layout file
- Instructions PDF
Demo File
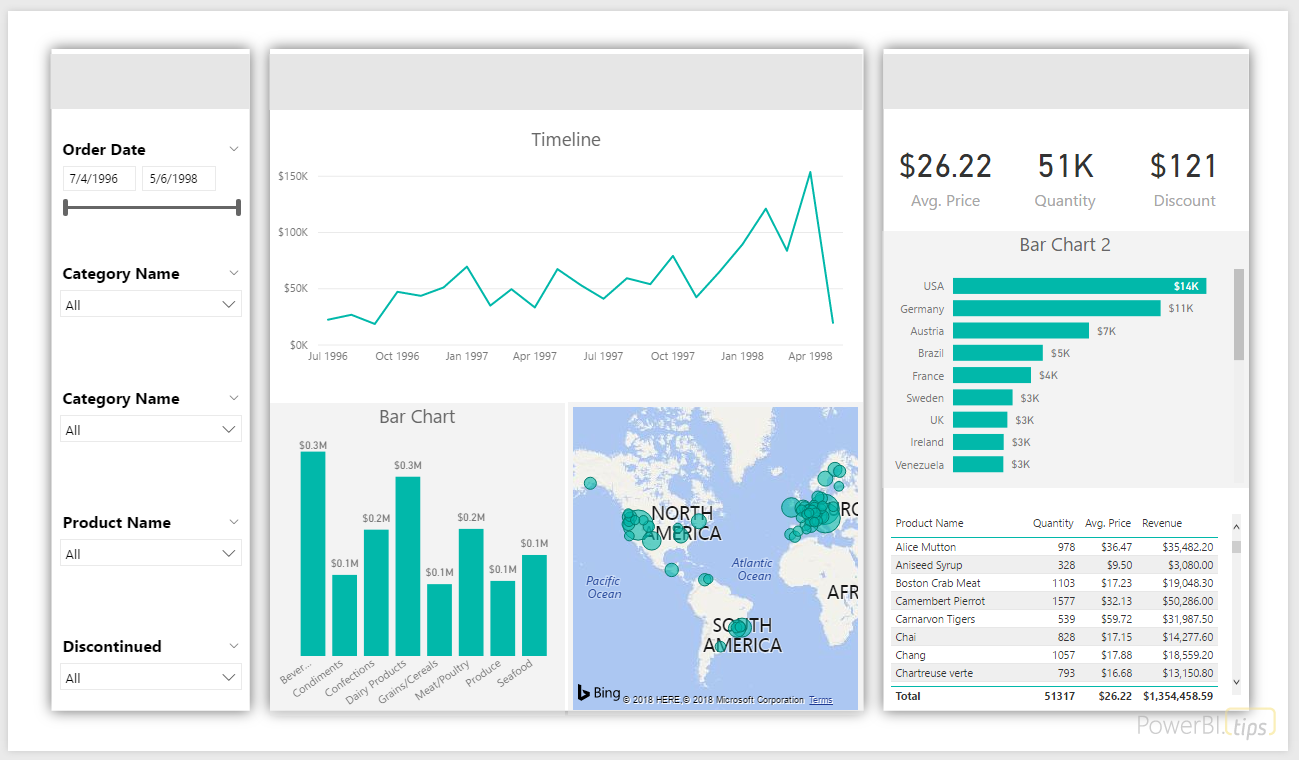
The Demo file is a Power BI Desktop file (PBIX) that is prepopulated with a data. This file is intended so that you can review the properties of each visual. This is considered the completed form of the report. See sample Demo file below:
Layout File
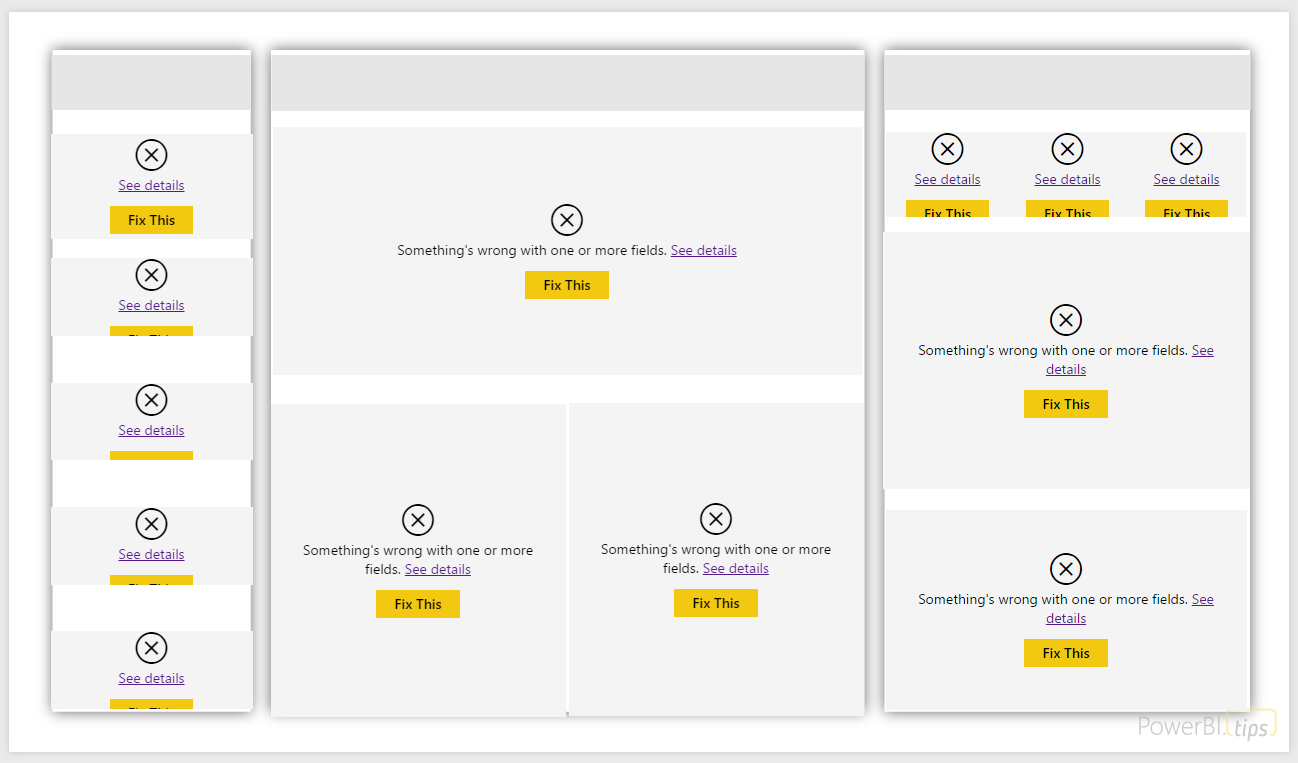
The Layout File is exactly the same as the Demo file with the exception of a data source. Since there is no data source connected to the screen two issues will arise.
- You might see some warning screens, just click Close. See explanation below as to why these appear.
- All the visuals appear broken. Don’t worry, this is ok, it just looks bad when you get started. As you populate column fields into the visuals the “Fix This” buttons will disappear.
Here is the Initial view of the Layout without any data sets.
Possible Error Messages:
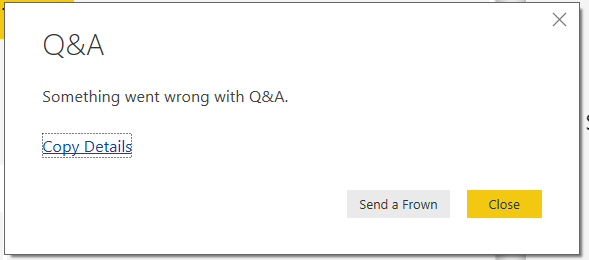
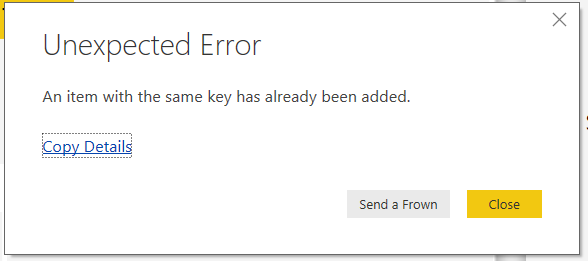
Note: When you open this file, you might get an error about Q&A or “An item with the same key has already been added”. These errors are caused because there is not a dataset within the Power BI file. Just click Close and proceed working with the Layout File. As a side note I have not experienced any issues with error messages after a dataset has been connected.
Instructions Page
This is where the instructions for the layout will be contained. Some layouts will have some special instructions. The special instructions will be included in the instruction sheet.
Getting Started with Layouts
- Open the *** Layout.pbit file.
Note: you may have some errors upon initially opening the document, just click Close and errors will disappear. See explanation as to why they are there by following this link.
- If any error messages appear, click Close.

Possible Q&A Error Message - Load your data using either, Get Data, Recent Sources, or Enter Data.
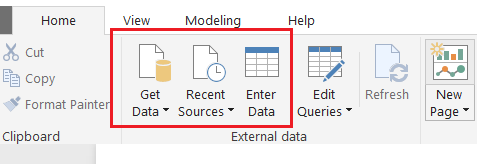
Get Data - Once you are done loading and editing your data in the Query Editor. The Data tables should now be displayed in the Fields panel on the right side of the screen.
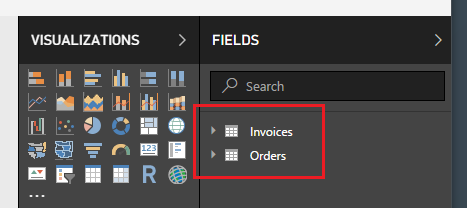
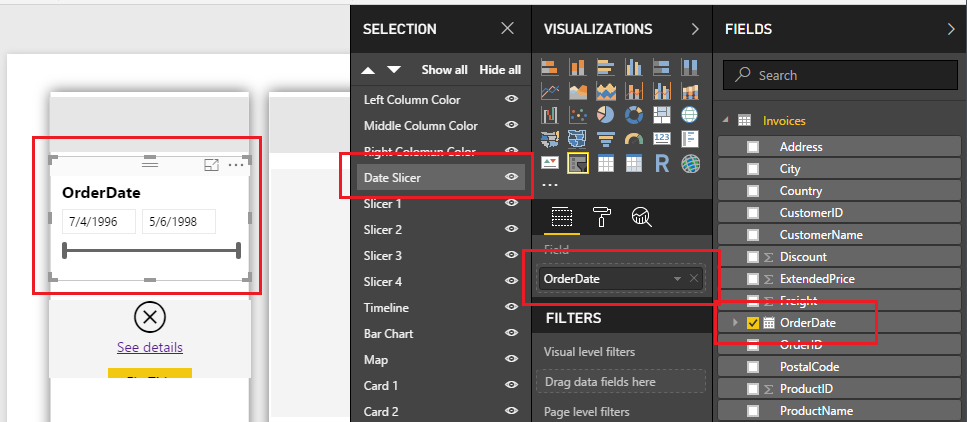
Added Data in Fields Pane - Open the Selection Pane by clicking on the View ribbon and selecting the check box titled Selection Pane. You will notice all the items on the page are labeled. By selecting one of the times on the selection pane you can view which fields are missing. In this example, we selected Date Slicer. By selecting the date slicer we see an error in the fields window with the Caution This means the data model is missing that field name. Simply grab a column from one of our newly added tables and repopulate the field value.
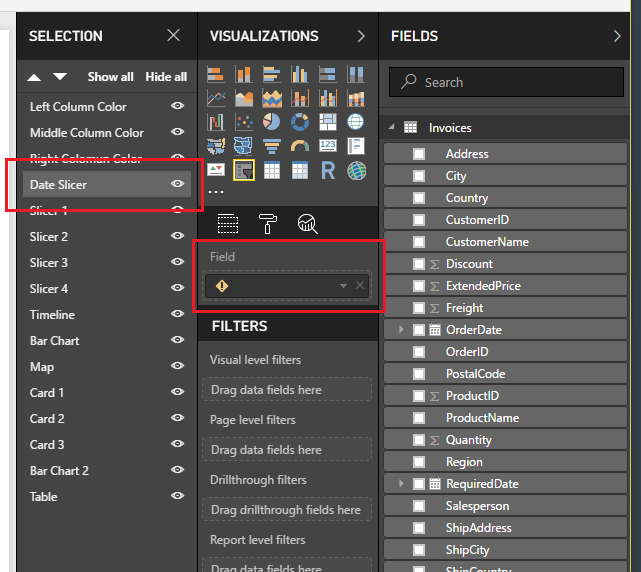
OrderDate was added to the missing field. This fixes the visual error and then populates Order Date on the report page.
Note: in some cases where visuals are able to accept multiple fields the broken field will not disappear when you add your new column. If this happens simply click the X next to the broken field to fix the visual. ****Warning. Do not remove the field before you have a valid field in the visual. If you do this, the visual itself will be deleted.****
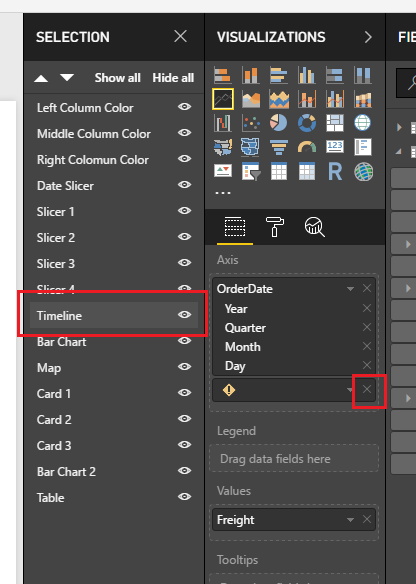
- Repeat for every visual on the page, and your report will be complete.
- Once you are all done make sure you save the report.
Additional Features
Modifying Shape Colors
Some layouts will have shapes inside that enable custom color selection. Shapes intended for coloring will be marked as such within the Selection Pane.
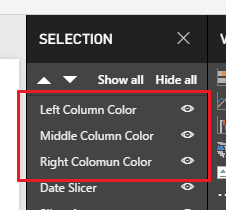
To modify the color shapes, select the shape and then modify the Fill Color found in the Format Shape pane under the Fill section.

Layouts Are Custom
Each layout is a totally custom setup. Each visual has been modified in a way to make the presentation of the data look the best. This means in some cases the visuals fonts, labels, label precision, x or y axis has been turned off or modified in some way.
Since the layout has been highly stylized, you may not recognize the visual or feel like something is missing, for example the y-axis. This was intentional and done to tell the data story.
You can modify all the properties by clicking on the visual and selecting the Paint Roller to modify the properties.
Duplicating a Page
Once you have found a layout that you like, you might want to reuse that page layout multiple times. To reuse a layout, simply Right Click on the report layout tab that you like and select Duplicate Page.
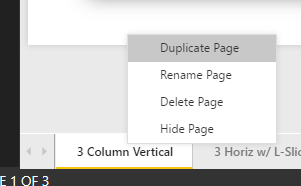
Delete Unwanted Page
Most layout files will contain multiple report pages. Some layout documents have multiple layouts per PBIT file. Thus, there will be situations where you want to delete un-needed pages. This is a simple Right Click on the report tab that you wish to remove and selecting Delete Page.
The Layout files are created with many different report tabs, so you can have incredible flexibility. For example, you may want a main page with two (2) visuals, and slicers, but later in the report you need a three (3) column layout. By including many different designs within one PBIT Layout file you can choose what works best with your data.
Visuals Layout in Selection Pane
In the selection window there will be multiple items which represent each item on the report page. Each item in the Selection pane will attempt to be laid out with applicable names and in order of left to right typically. There will be some exceptions to this rule, but items will be laid out as intuitive as possible.
Note: If you don’t see the selection window you can turn this on by clicking on the View ribbon, and then checking the box titled Selection Pane.
Report Pages Background
Each Layout Report page will come with a background image. If it is desired this background image can be removed. To remove the background image, make sure no visuals are selected. This can be achieved by pressing the ESC key. Then in the Visualizations pane expand the Page Background. To remove the background image, click the little X next to the image name, found under the Transparency setting. By default, the Image Fit is set to Fit.
Caution: If a background image is removed, it can’t be replaced. So, once it is gone, you won’t be able to re-apply a background image.
Changing Visuals
Now, not all layouts will be able to meet your report needs. Maybe you want to add a custom visual, or maybe change a visual from a map to a bar chart. Even though this is a predefined layout you can easily change the visual. To change the visual first select the visual you want to change, and then on the Visualizations pane click a new visual type. It is that easy.
Moving Visuals
All the visuals on each report page are locked by default and therefore you cannot move them with the mouse. This is a setting that has been turned on. The setting is called Lock Objects and it can be changed by navigating to the View Ribbon and then Unchecking the Lock Objects item. By unchecking this feature, you will be able to move the visuals around the page.
Adding Custom Report Themes
The layouts have been made using the default colors for Power BI Desktop. However, once you have connected your data you can easily add your own color theme. If you need help making color themes using JSON you can use this free Theme Generator to help add custom colors to your report. For the full specification on the Reports Themes visit the official Microsoft documentation page.

