


We are going to kick this blog off with a simple example of how to load data from excel into Power BI Desktop.
Note: I’m a firm believer of always understanding your data. If you are receiving data files or extracts from an automated system or from an individual, trust me it will make a difference. So, make sure you understand the source of the data and how the structure of your data may change over time. For example, you have have a column that has both text values and number values; or the data may add additional columns in the future. Thus, the data load into Power BI Desktop (PBID) will need to be flexible.
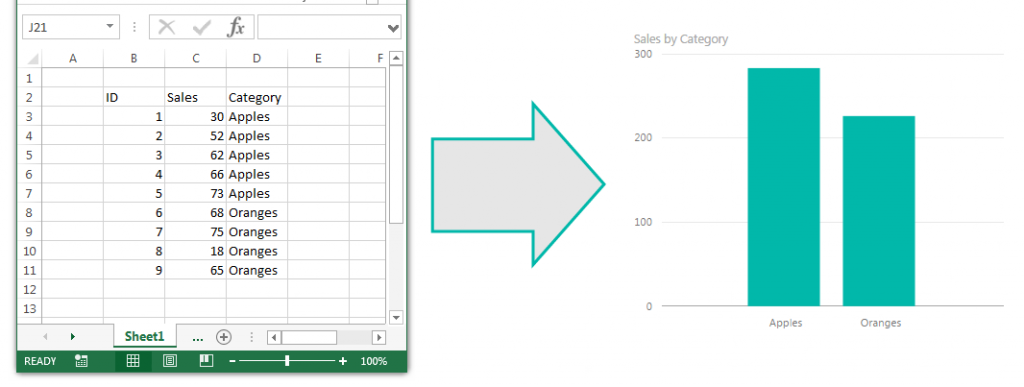
Lets start off with some simple data in excel:
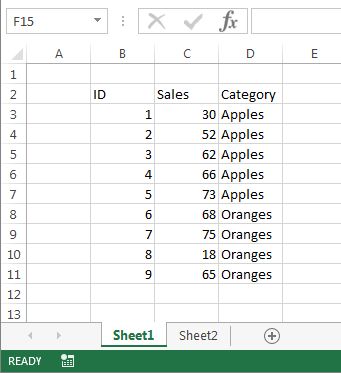
We have three columns of data, two have number in it and one has text values.
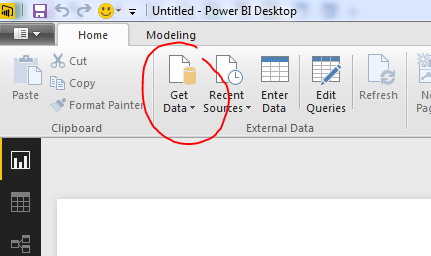
For now we will close out of excel and jump over to Power BI Desktop. Once the program loads we will click the Home ribbon then select the Get Data button.
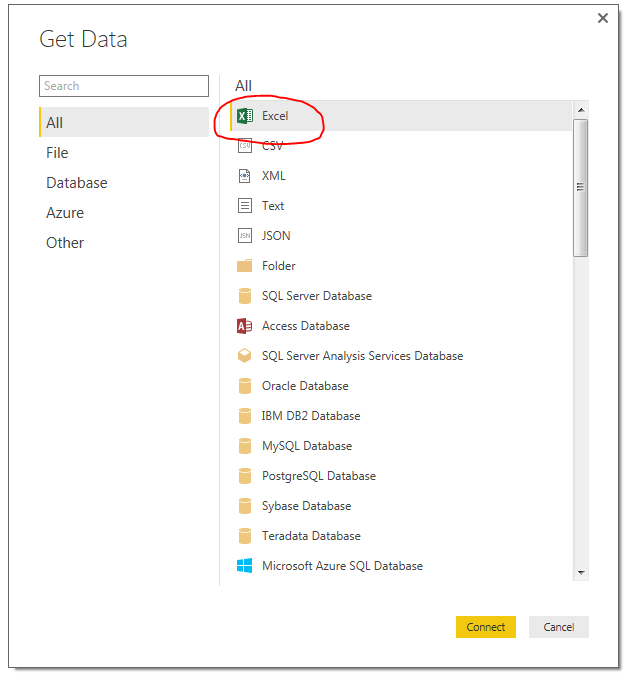
After pressing the button a new menu will pop up showing us all the sources where data can be ingested from. The very first item in the list is Excel. Click the Excel then click the Connect button in the lower right hand corner.
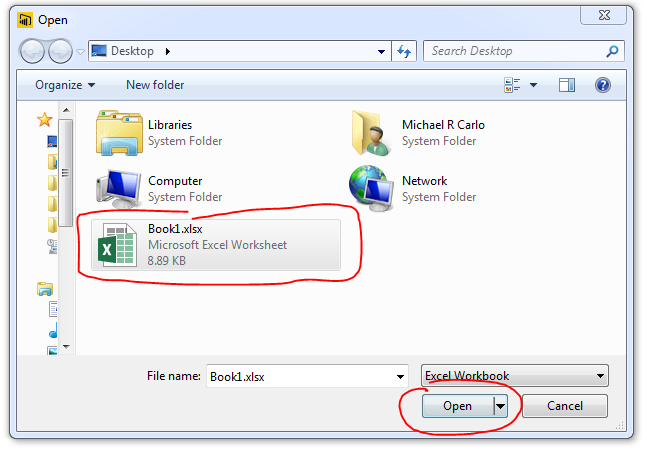
After clicking Connect a new window will pop up asking for the location of the Excel file. Navigate to our sample data called Book1.xlsx you can down load the actual file I used here: Book1 I saved my Book1.xlsx file on the desktop of my computer. Select Book1 and then Click Open.
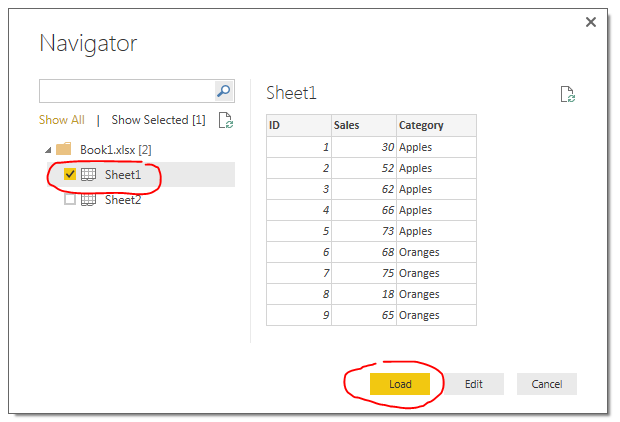
Next we are presented with the Navigator screen that reveals what is inside the workbook. There are two sheets. For now we are only interested in the data on Sheet1. Select Sheet1 and then click Load. This will load our data from Sheet1 into the Power BI Desktop data model.
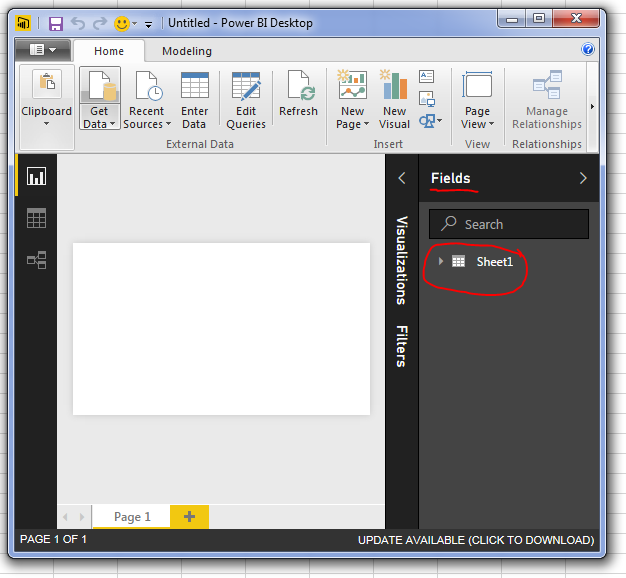
Now our data has been added to the Power BI Desktop data model. The data and the various columns we loaded can be found in the tool bar at the far right of PBI called Fields.
Tech Tip: Power BI Desktop (PBI) opening the file and loading the relevant data into the memory of the computer. This has an approximate 4 to 1 compression ratio. In practical terms this means that a 100MB file will only consume 25MB of file size in PBI when it is saved. This is extremely useful as the data model can be quite large when loading multiple data files but the PBI file will compress down to a manageable size.

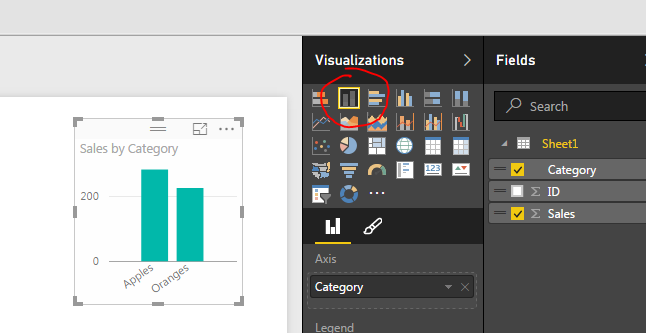
Finally, the Sheet1 data table can be expanded into is respective columns by clicking the triangle next to the table icon. Finally you can drag and drop the column names into the visualization page to begin making visualizations. For this demo I used the Category Column and the Sales column to make a table.
By selecting a different visualization in the visualizations bar you can change your data table into a Bar Chart.
Well that is it for the first tutorial. Share your thoughts and comments below. Let me know if you have any suggestions on what you would like to see next.