
A common ask from users is the ability to view data related to visuals in excel. While there is an option to export data, the format is often unfriendly and has limitations. What’s more, this data becomes disconnected and is not updated if a user looks at after the data is refreshed.
This post will explore a way to add a pre-built excel report that can be designed in advance with company branding and advanced features or VBA. Additionally, it will be linked to the report’s data model via live connect. This means it will continue updating if reopened, as well as maintaining Row Level Security.
End Result
The end result will be a download button that can open a well designed excel report.
Video
This content was demonstrated at the Milwaukee Brew City User Group in February 2020. You can watch the video recording and see the steps detailed below.
Step 1 – Connect to Excel
There are two ways to connect:
Option 1:
This option may not be available to you depending on your office license.
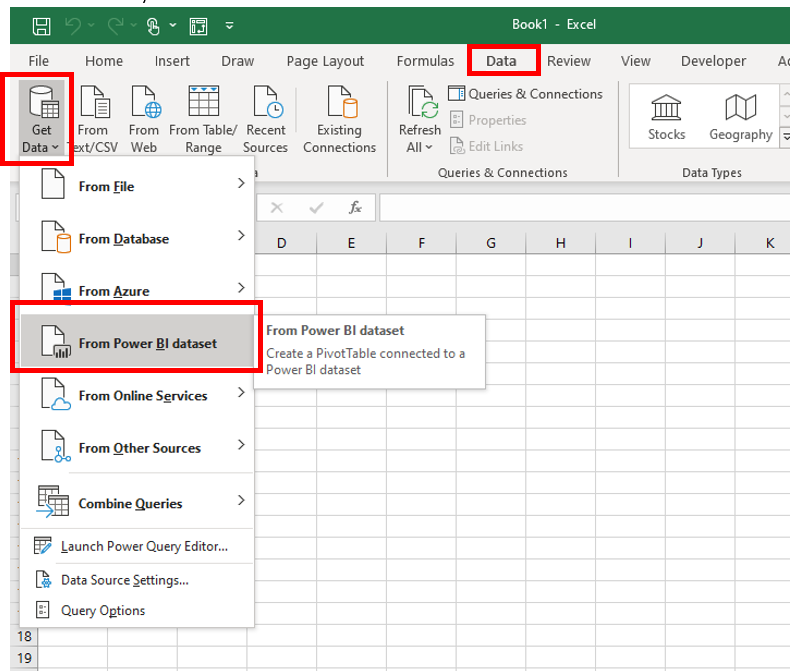
Open Excel and navigate to the data tab. Click Get Data the select “From Power BI dataset”.
From the list, select the report that contains the model.
Option 2:
The other way is to navigate to the service (app.powerbi.com) and open the report that contains the model. Click the ellipsis and select Analyze in Excel.
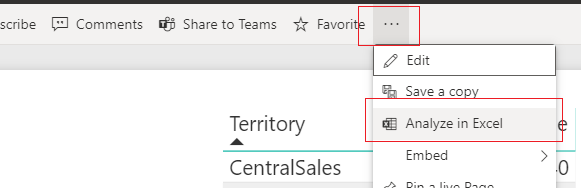
This will download a file which has the extension “ODC”, which stands for Office Data Connection. This file contains information that will tell excel how to connect to the dataset on the service.
For more information, see:
https://docs.microsoft.com/en-us/sql/reporting-services/report-data/use-an-office-data-connection-odc-with-reports?view=sql-server-ver15
Click on the file to open in excel. Once opened, Excel will present you with an empty PivotTable. If you check the PivotTable fields you will notice that you can now see the fields and measures. The same ones which were created in your Power BI model.
We have now live connected to the model we have published in Power BI service. This works the same as using a live connection in Power BI. Your Excel file has access to all the logic and data is updated as soon as the model is updated. Refreshing the data source in Excel pulls the latest data directly from the Power BI model.
Step 2 – Develop a report
The PivotTable in the report is an OLAP (Online Analytical Processing) PivotTable and has a few differences from standard PivotTable made from flat data.
Just like Power BI, dimensions from multiple tables can be used in the same PivotTable. The relationships set up in the model will be observed.
Only explicit measures may be used in the VALUES section of the PivotTable. This means that unlike Power BI, you cannot drag a numeric column into VALUES and select a summarization (also known as an implicit measure). All values must have a specific measure written in the model file (or use an extension OLAP pivot table tools).
The PivotTable sends a new query each time some element in Excel is changed. For example, if you apply a filter, Excel will send a new query to the model. This works similar to the Direct Query mode in Power BI.
Now we have a connection set up, you can make a pre-defined report that you can give directly to your end users.
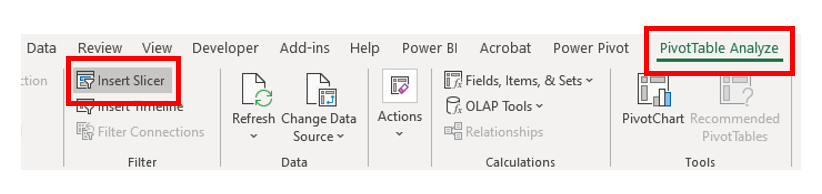
You can add a slicer by clicking on the PivotTable, click on the PivotTable Analyze tab and select Insert Slicer (or use Timeline for dates).
There are many advantages of using a live connection.
- The Excel file can be branded with company logos
- Pre set filters can be added.
- More advanced features such as Data Solver, VBA and macros can be added.
In addition, the data can be updated inside the workbook, or set to be refreshed on open. Users will also be prompted to sign in and authenticated through their Office account. Features such as Row Level Security will continue to work.
Keep it FRESH
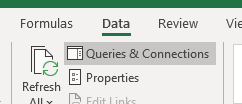
You can set the report to refresh every time it is opened. Navigate to the Data tab and click “Queries and Connections”.
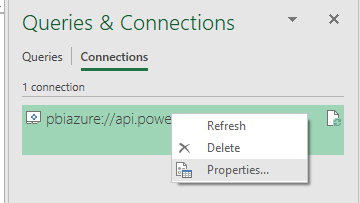
There will be one query, usually starting with pbiazue://. Right click this query and select properties.
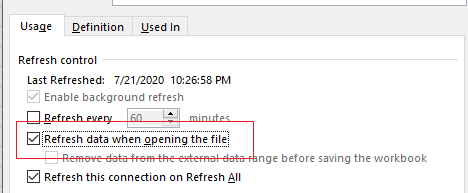
From here you can enable “Refresh data when opening the file”.
Step 3 – Upload the excel
Now, that the excel is created, you can distribute it to end users. A helpful way is to create a download link directly in the report.
A good place to host this would be SharePoint – you can link a SharePoint site directly to the Power BI workspace. It is secured through Active Directory, plus if users are already logged into Power BI they do not need to sign in again.
First, navigate to the online SharePoint location where you wish to host and upload your excel file.
Next, right click the file, and select download. This will download the file back to your local machine.
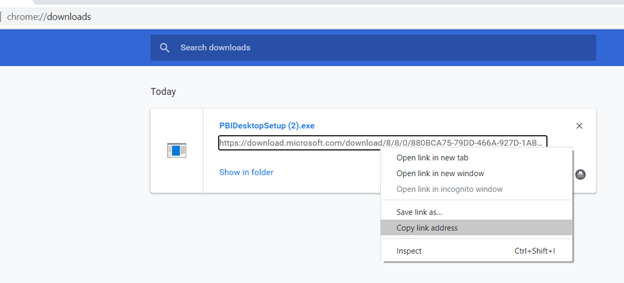
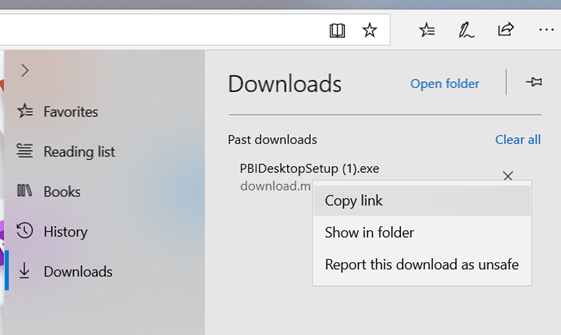
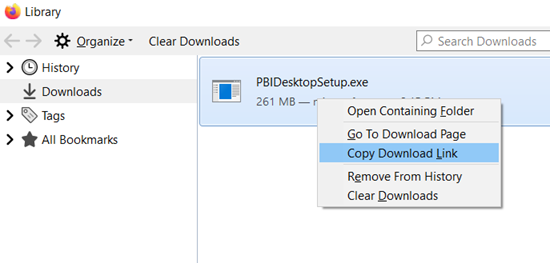
Now, navigate to your browser’s Downloads page. You can access through the settings of the browser, or if you are on a Windows machine, most browsers you can use the shortcut Ctrl-J. From here you will see the file you just downloaded. Right click the link and select what resembles “Copy link”. This may vary depending on the browser:
Chrome:
Edge:
Firefox:
Save the link you have copied to be used later.
Step 4 – Adding to the Report
For my download button, I am just using a down arrow image which I downloaded from an open license image site

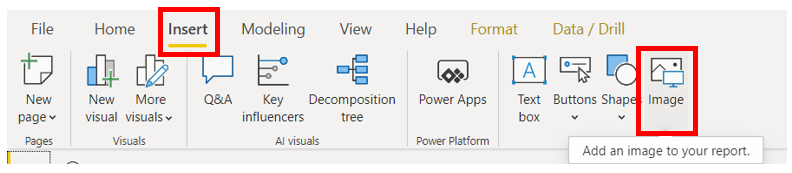
In Power BI Desktop, open the Insert tab and select Image. Select the image you wish to insert.
After it has been added, select the image and open the visualizations pane.
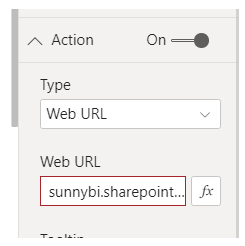
Turn on Action and change type to web URL.
Then paste in the URL (the direct download from SharePoint) you saved earlier.
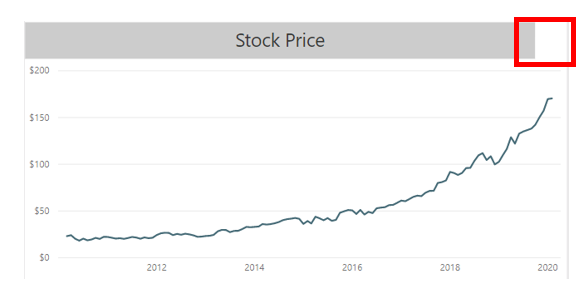
To tidy it up, I will add it next to the related visual. My visual has a text box above it. I have left some white space for a download button.
Step 5 – Using the button
Now, users can navigate to the report and click the download button. This will download the pre-built excel file. Users will be required to sign in and Row Level Security will still apply. In addition, users can use the “Refresh” button in the data tab to refresh data directly from the connected report.
Due to this being a Live Connection users will be required to enable content. In addition, they will need to sign into excel so that they can authenticate to the data model.
Tips and Tricks
- Large tables will still need to send DAX queries for each value, so make sure the DAX is efficient.
- If using CUBE formulas, these are sent as individual queries to the model. Try to use a single pivot table rather than multiple formulas where possible.
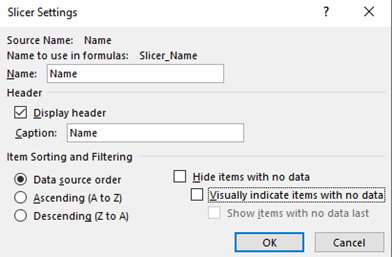
- Slicers are useful, but can slow down reports, especially if you have many. One way you could speed it up is by right clicking on the slicer and going to slicer settings. Then untick “Visually indicate items with no data”. This will now always show all items in the slicer – even if there is no data associated with it. While this is less helpful, it can often dramatically speed up reports.’
- Download OLAP PivotTable Extensions (https://olappivottableextensions.github.io). This is an amazing extension that can help see information about OLAP PivotTables. The functions are detailed on the website, but two features which are worth calling out:
- Ability to see MDX query – this shows the query that is sent to the cube for the PivotTable
- Ability to add calculations – you can add measures (written in MDX) to the specific PivotTable without having to add it to the cube
If you like the content from PowerBI.Tips please follow us on all the social outlets. Stay up to date on all the latest features and free tutorials. Subscribe to our YouTube Channel. Or follow us on the social channels, Twitter and LinkedIn where we will post all the announcements for new tutorials and content.
Introducing our PowerBI.tips SWAG store. Check out all the fun PowerBI.tips clothing and products:
Check out the new Merch!


