Tag: % Change

  • Map with Data Labels in R

    Map with Data Labels in R

    Mapping is one of the better features of PowerBI.  It is one of the more distinguishing feature differences between Excel and PowerBI.  You can produce a map inside an excel document using Bing maps, however, the experience has always felt a little like an after-thought.  Mapping within PowerBI has a planned, and thoughtful integration.  While the mapping functionalities within PowerBI Desktop are far improved when compared to excel, there are still some limitations to the mapping visuals.  This past week I encountered such an example.  We wanted to draw a map of the United States, add state name labels and some dimensional property like year over year percent change.

    I started with the standard map visual, but this didn’t work because there is no ability to shade each state individually.  This just looked like a bubbled mess.

    Globe Map Visual
    Globe Map Visual

    Next, I tried the Filled Map visual.  While this mapping visual provides the colored states it lacks the ability to add data labels onto the map.  Clicking on the map would filter down to the selected state, which could show a numerical value.  Alternatively, you can place your mouse over a state and the resulting tag will show the details of the state (hovering example provided below).

    Filled Map Visual
    Filled Map Visual

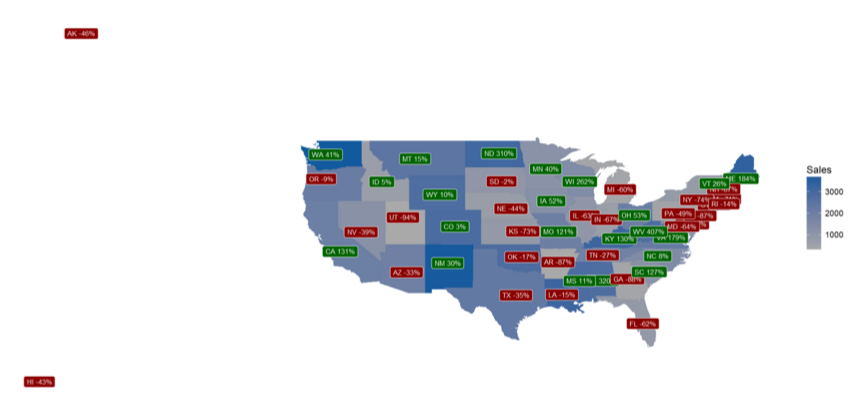
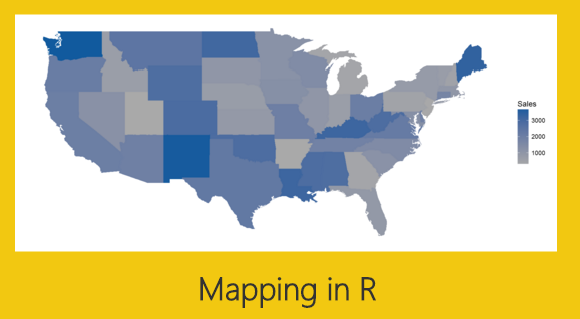
    Still this did not quite meet my visual requirements.  I finally decided to build the visual in R which provided the correct amount of flexibility. See below for final result.  You can download the pbix file from the Microsoft R Script Showcase.
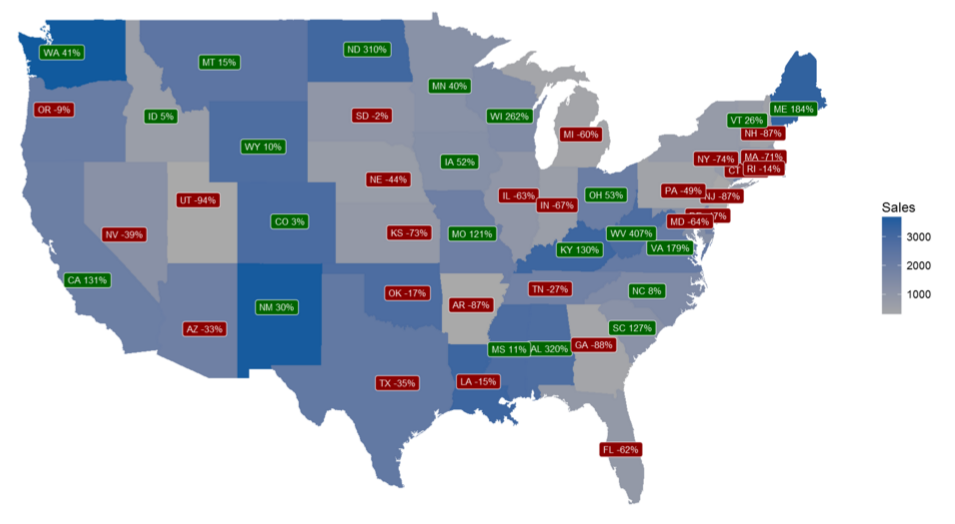
    R Map Visual
    R Map Visual

    In this visual, each state is shaded with a gradient color scale.  The states with the lowest sales are grey and the states with higher sales numbers transition to dark blue.  The darker the blue the more sales the state saw.  Each state has an applied label.  The color of the label denotes the percent change in sales.  If the color is green then the sales this year were higher than last year, red means that the state sales were lower this year.  The state name is listed in the label as well as the calculation for the year over year percent change.

    Alright, let’s start the tutorial.

    First, before we open PowerBI we need to load the appropriate packages for R.  For this visual you will need to load both the maps and the ggplot2 packages from Microsoft R Open.

    Open the R console and use the following code to install maps.

    install.packages('maps')
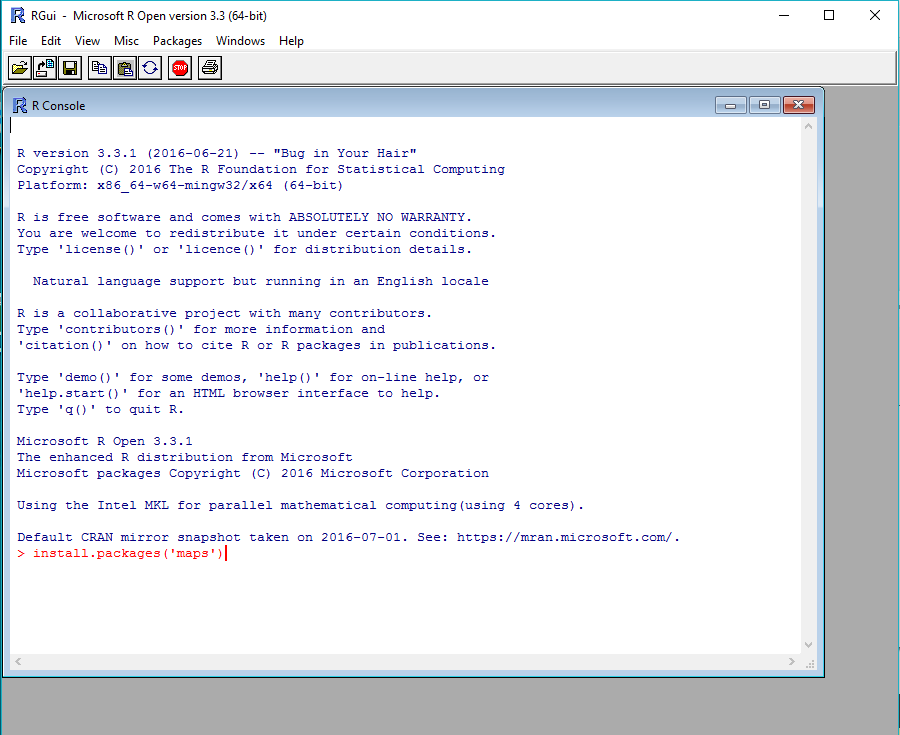
    Install Maps Package
    Install Maps Package

    Repeat this process for installing ggplot2.

    install.packages('ggplot2')

    After installing the R packages we are ready to work in PowerBI Desktop.  First, we need to load our sample data.  Open up PowerBI Desktop and start a blank query.  On the View ribbon in the query editor open the Advanced Editor and enter the following M code.

    Note: If you need some more help loading the data follow this tutorial about loading data using the Advanced Query Editor.  This tutorial teaches you how to copy and paste M code into the Advanced Editor.

    let
      Source = Excel.Workbook(Web.Contents("https://powerbitips03.blob.core.windows.net/blobpowerbitips03/wp-content/uploads/2016/10/State-Data.xlsx"), null, true),
      StateData_Table = Source{[Item="StateData",Kind="Table"]}[Data],
      #"Changed Type" = Table.TransformColumnTypes(StateData_Table,{{"StateName", type text}, {"Abb", type text}, {"TY Sales", Int64.Type}, {"state", type text}, {"Latitude", type number}, {"Longitude", type number}, {"LY Sales", Int64.Type}, {"Chng", type number}}),
      #"Renamed Columns" = Table.RenameColumns(#"Changed Type",{{"TY Sales", "Sales"}})
    in
      #"Renamed Columns"

    After pasting the code into the Advanced Editor click Done to load the data.  While in the Query Editor, rename the query to be StateData, then click Close & Apply on the Home ribbon.

    Load Mapping Data
    Load Mapping Data

    We still need to prepare the data further by adding two calculated columns.  Click the bottom half of the New Measure button on the Home ribbon and select New Column.

    Add New Column
    Add New Column

    Enter the following code into the formula bar that appears after clicking New Column.

    Change = StateData[Abb] & " " & ROUND(100*StateData[Chng],0) & "%"
    Change Column Measure
    Change Column Measure

    Again, click on the New Column button found on the Home ribbon and add the code for a color column.

    Color = if(StateData[Chng] > 0 , "Dark Green", "Dark Red")
    Color Column Measure
    Color Column Measure

    The Fields list should now look like the following.
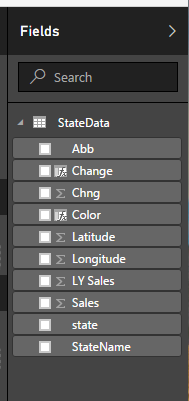
    Fields List
    Fields List

    Add the R visual with the following fields.
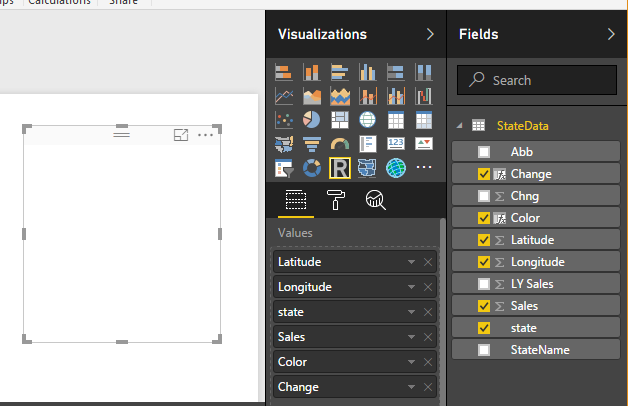
    R Visual Fields
    R Visual Fields

    Add the following R script into the R Script Editor.

    # Load the ggplot2 and maps packages
     library(ggplot2)
     library(maps)
    
    # Load the mapping data into a dataframe called states_map
     states_map <- map_data("state")
    
    # Start ggplot2 by sending it the dataset and setting the map_id variable to state
     ggplot(dataset, aes(map_id = state)) +
    
    # Add the map layer, define the map as our data frame defined earlier
     # as states_map, and define the fill for those states as the Sales data
     geom_map(map = states_map, aes(fill=Sales)) +
    
    # Add the data for the labels
     # the aes defines the x and y cordinates for longitude and latitude
     # colour = white defines the text color of the labels
     # fill = dataset$Color defines the label color according to the column labeled Color
     # label = dataset$Change defines the text wording of the label
     # size = 3 defines the size of the label text
     geom_label( aes(x=Longitude, y=Latitude), 
      colour="white", 
      fill=dataset$Color, 
      label=dataset$Change, size=3
      ) +
    
    # define the x and y limits for the map
     expand_limits(x = states_map$long, y = states_map$lat) +
    
    # define the color gradient for the state images
     scale_fill_gradient( low = "dark grey", high = "#115a9e") +
    
    # remove all x and y axis labels
     labs(x=NULL, y=NULL) +
    
    # remove all grid lines
     theme_classic() +
    
    # remove other elements of the graph
     theme(
      panel.border = element_blank(),
      panel.background = element_blank(),
      axis.ticks = element_blank(),
      axis.text = element_blank()
      )

    After adding the R script press the execute button to reveal the map.

    Paste R Script
    Paste R Script
    Final Map Product
    Final Map Product

    Notice how we have data included for Alaska and Hawaii but those states are not drawn.  We want to remove the Alaska and Hawaii data points.  Add the StateName field to the Page Level Filters and then click Select All.  Now, un-check the boxes next to Alaska and Hawaii.  The data is now clean and the map correctly displays only the continental United States.
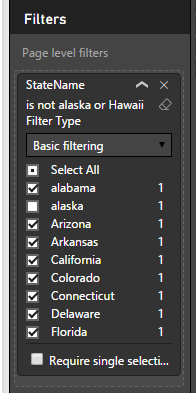
    Page Level Filters
    Page Level Filters

    Here is the filtered final map product.
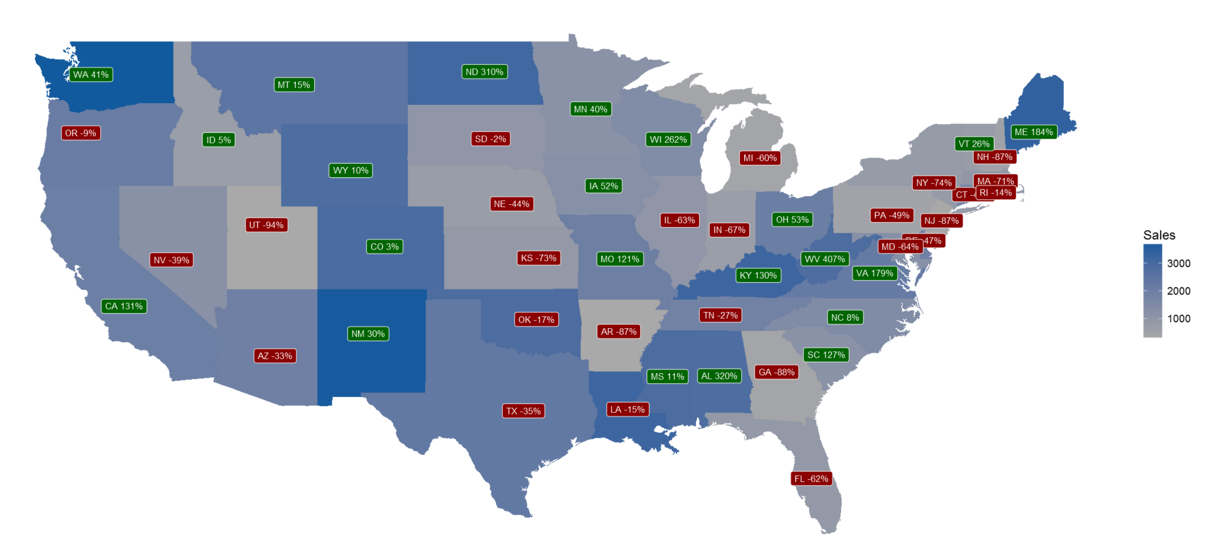
    Filtered Final Map
    Filtered Final Map

    Thanks for following along.  I hope you enjoyed this tutorial.  Please share if you liked this content.  See you next week.


  • Measures – Dynamic Percent Change – Using DAX

    Measures – Dynamic Percent Change – Using DAX

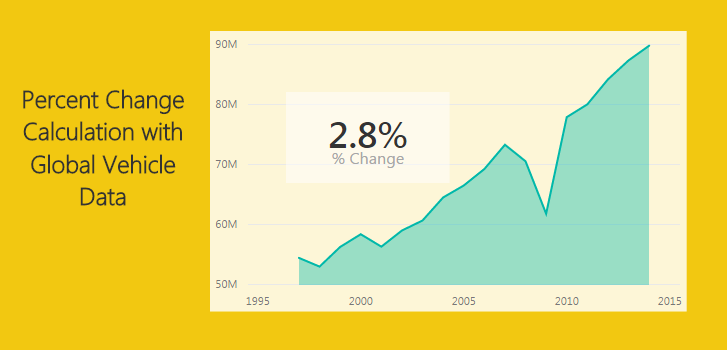
    This tutorial will produce a measure that will dynamically calculate a percent change every time an item is selected in a visual.  The previous tutorial can be found here.  In the previous tutorial we calculated the percent change between two time periods, 2014 and 2013.  In practice it is not always desirable to force your measure to only look at two time periods.  Rather it would be nice that your measure calculations change with changes in your selections on visuals.  Thus, for this tutorial we will add some dynamic intelligence to the measures. Below is an example of what we will be building:

    First here is the data we will be using.  This data is the same data source as used in the previous % change tutorial.  To make things easy I’ll give you the M code used to generate this query.  Name this query Auto Production.

    let
     Source = Web.Page(Web.Contents("https://en.wikipedia.org/wiki/Automotive_industry")),
     Data0 = Source{0}[Data],
     #"Removed Columns" = Table.RemoveColumns(Data0,{"Change", "Source"}),
     #"Changed Type" = Table.TransformColumnTypes(#"Removed Columns",{{"Production", Int64.Type}, {"Year", Int64.Type}})
    in
     #"Changed Type"

    Note: the code shown above should be added as a blank query into the query editor.  Add the code using the Advanced Editor.  Another tutorial showing you how to add advanced editor code is here

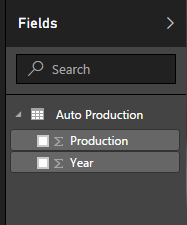
    Once you’ve loaded the query called Auto Production.  The Field list should look like the following:

    Production
    Auto Production

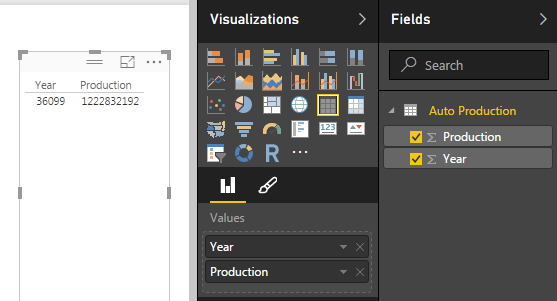
    Next add a Table with Production and Year.  this will allow us to see the data we are working with.  When you initially make the table the Year and Production columns are automatically summed, thus why there is one number under year and production.

    Table of Data
    Table of Data

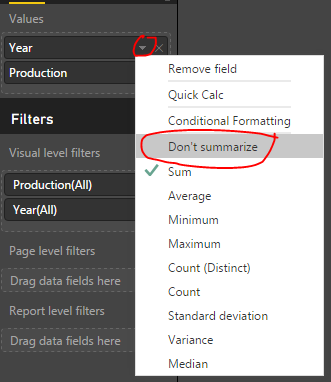
    Rather we want to see every year and the production values for each of those years.  To change this view click on the triangle in the Values section of the Visualizations pane.  This will reveal a list, in this list it shows that our numbers are aggregated by Sum change this to Don’t Summarize.

    Change to Don't Summarize
    Change to Don’t Summarize

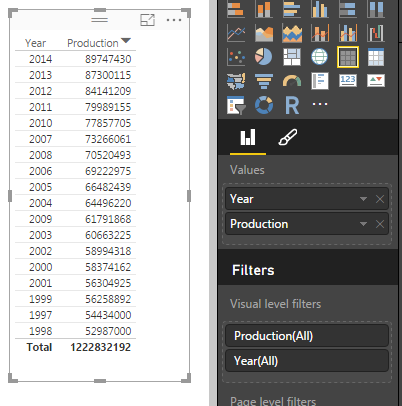
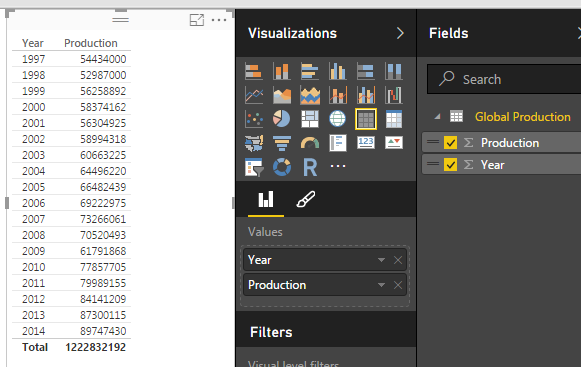
    Now we have a nice list of yearly production levels with a total production at the bottom of our table.

    Table of Production Values by Year
    Table of Production Values by Year

    Next we will build our measure using DAX to calculate the percent changes by year.  Our Calculation for % change is the following:

    % Change  =  ( New Value / Old Value ) - 1

    Below is the DAX statement we use as our measure.  Copy the below statement into a new measure.

    % Change = 
    DIVIDE(
     CALCULATE(
     SUM('Auto Production'[Production]), 
     FILTER('Auto Production','Auto Production'[Year]=MAX('Auto Production'[Year])
     )
     ), 
     CALCULATE(
     SUM('Auto Production'[Production]),
     FILTER('Auto Production','Auto Production'[Year]=MIN('Auto Production'[Year])))
    ,0) 
    - 1

    I color coded the DAX expression between the two equations to show which parts correlated.  Note we are using the DIVIDE function for division.  This is important because if we run into a case where we have a denominator = 0 then an error is returned.  Using DIVIDE allows us to return a zero instead of an error.

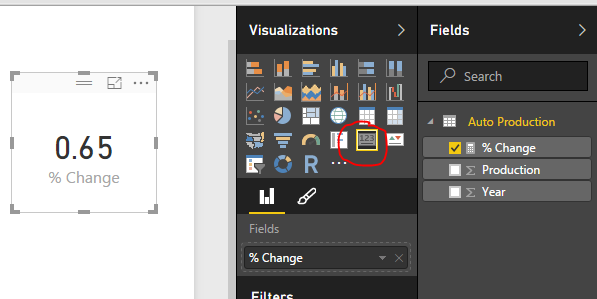
    Next add our newly created measure as a Card.

    Add Card
    Add Card

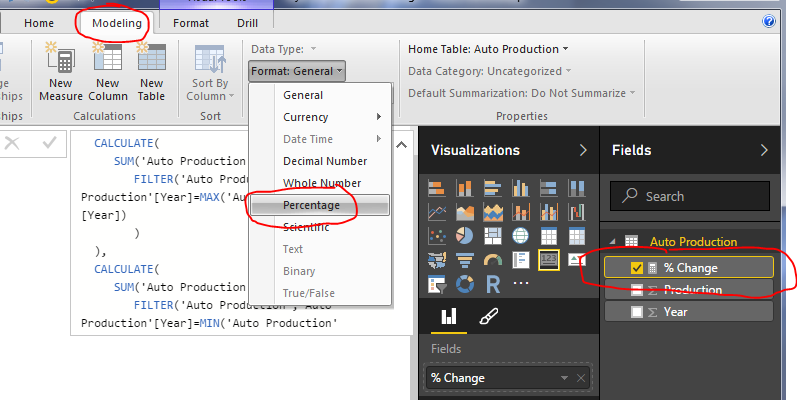
    Change the % Change measure format from General to Percentage, do this on the Modeling ribbon under Formatting.

    Change Measure Formatting
    Change Measure Formatting

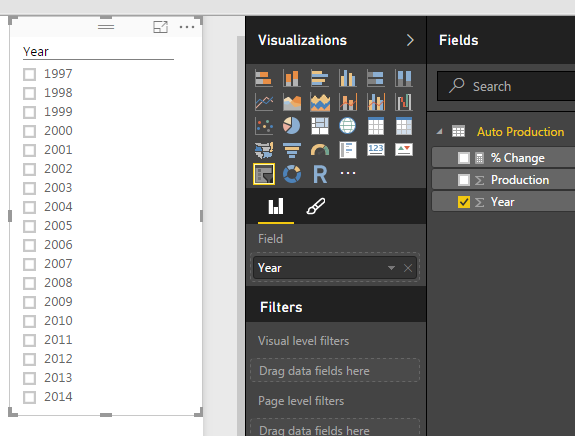
    Next add a slicer for Year. 

    Slicer for Year
    Slicer for Year

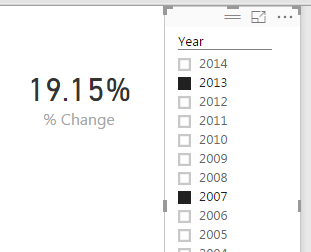
    Now you can select different year and the % change will automatically change based on our selection.  The % change will always select the smallest year’s production and the largest year’s production to calculate the % Change.   By Selecting the Year 2013 and 2007, the percent change is 19.15%.  The smallest year is 2007 and the largest is 2013.

    Selecting Two Years
    Selecting Two Years

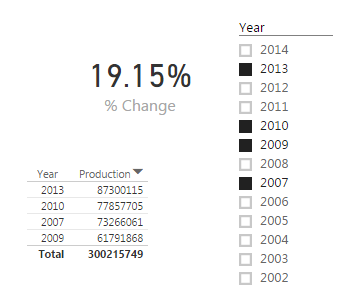
    If we select a year between 2013 and 2007 the measure will not change.

    Multiple Years Selected
    Multiple Years Selected

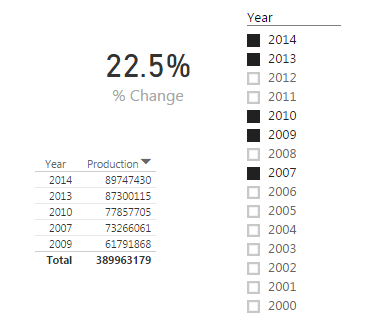
    The measure will only change when the starting and ending years are changed.  By selecting the year 2014, the measure finally changes.

    Selecting Additional Year
    Selecting Additional Year

    Pretty cool wouldn’t you say?  Thanks for taking the time to walk through another tutorial with me.

    Want to learn more about PowerBI and Using DAX.  Check out this great book from Rob Collie talking the power of DAX.  The book covers topics applicable for both PowerBI and Power Pivot inside excel.  I’ve personally read it and Rob has a great way of interjecting some fun humor while teaching you the essentials of DAX.

  • Measures – Calculating % Change

    Measures – Calculating % Change

    In our last post we built our first measure to make calculated buckets for our data, found here.  For this tutorial we will explore the power making measures using Data Analysis Expressions (DAX).

    When starting out in Power BI one area where I really struggled was how to created % change calculations.  This seems like a simple ask and it is if you know DAX.

    Alright lets go find some data.  We are going to go grab data from Wikipedia again.  I know, the data isn’t to reliable but it is fun to play with something that resembles real data.  Below is the source of data:

    https://en.wikipedia.org/wiki/Automotive_industry

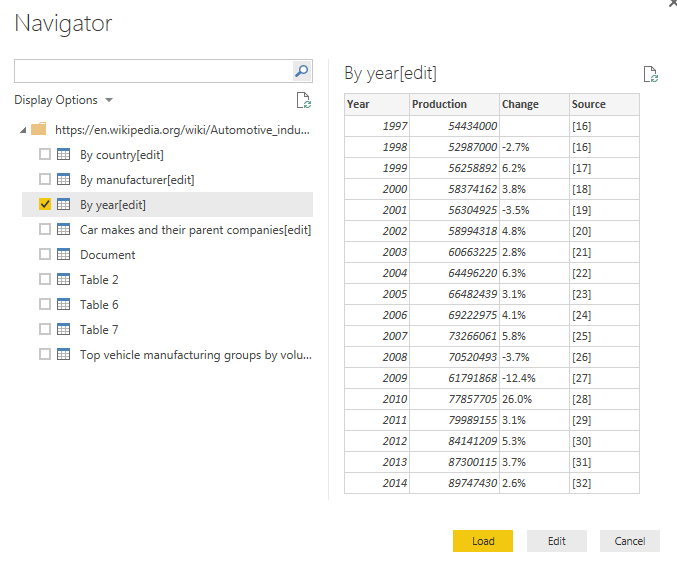
    To acquire the data from Wikipedia refer to this tutorial on the process.  Use the Get Data button, click on Other on the left, select the first item, Web. Enter the webpage provided above in the URL box.  Click OK to load the data from the webpage.  For our analysis we will be completing a year over year percent change.  Thus, select the table labeled By Year[edit].  Data should look like the following:

    Global Auto Production Wikipedia
    Global Auto Production Wikipedia

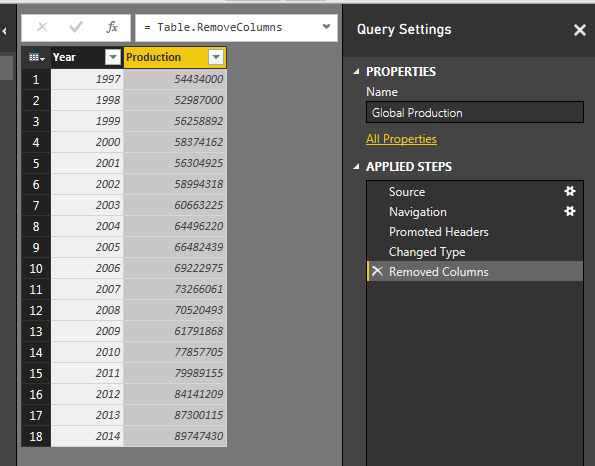
    This is the total number of automotive vehicles made each year globally from 1997 to 2014.  Click Edit to edit the data before it loads into the data model.  While in the Query Editor remove the two columns labeled % Change and Source.  Change the Name to be Global Production.  Your data will look like the following:

    Global Production Data
    Global Production Data

    Click Close & Apply on the Home ribbon to load the data into the Data Model.

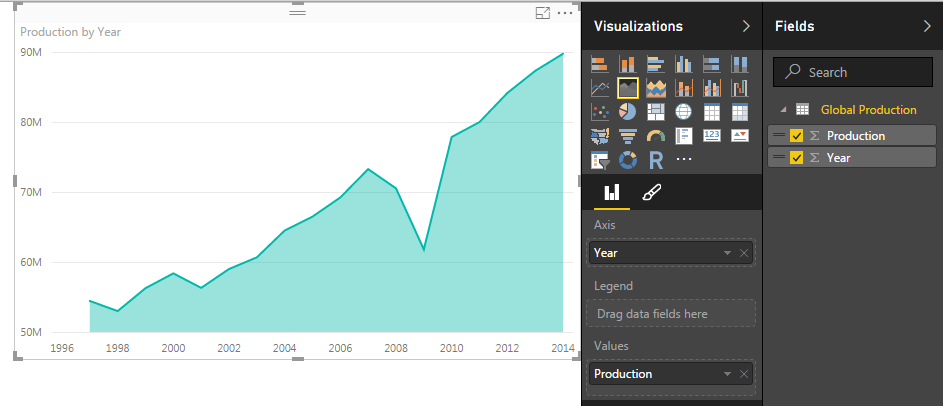
    Add a quick visual to see the global production.  Click the Area Chart icon, and add the following fields to the visual, Axis = Year, Values = Production.  Your visual should look something like this:

    Area Chart of Global Production
    Area Chart of Global Production

    Next we will add a table to see all the individual values for each year.  Click the Table visual to add a blank table to the page.  Add Both Year and Production to the Values field of the visual.  Notice how we have a total for both the year and production volumes.  Click the triangle next to Year and change the drop down to Don’t summarize. 

    Change to Don't Summarize
    Change to Don’t Summarize

    This will remove the totaled amount in the year column and will now show each year with the total of Global Production for each year.  Your table visual should now look like the following:

    Table of Global Production
    Table of Global Production

    Now that we have the set up lets calculate some measures with DAX.  Click on the button called New Measure on the Home ribbon.  The formula bar will appear.  We will first calculate the total production for 2014.  We will build on this equation to create the percent change.  Use the following equation to calculate the sum of all the items in the production column that have a year value of 2014.

    Total 2014 = CALCULATE(sum('Global Production'[Production]),FILTER('Global Production','Global Production'[Year] = 2014))

    Note: I know there is only one data point in our data but go alone with me according to the principle.  In larger data sets you’ll most likely have multiple numbers for each year, thus you’ll have to make a total for a period time, a year, the month, the week, etc..

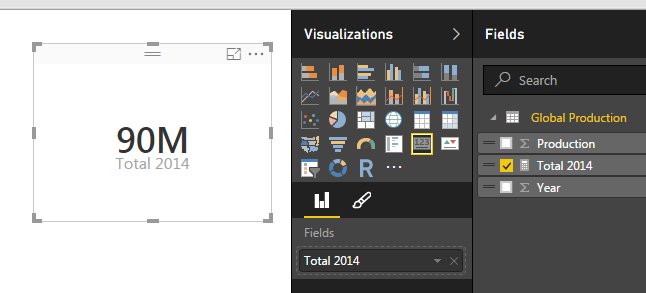
    This yields a measure that is calculating only the total global production in 2014.  Add a Card visual and add our new measure “Total 2014” to the Fields.  This shows the visual as follows, we have 90 million vehicles produced in 2014.

    2014 Production
    2014 Production

    Repeat the process above instead use 2013 in the Measure as follows:

    Total 2013 = CALCULATE(sum('Global Production'[Production]),FILTER('Global Production','Global Production'[Year] = 2013))

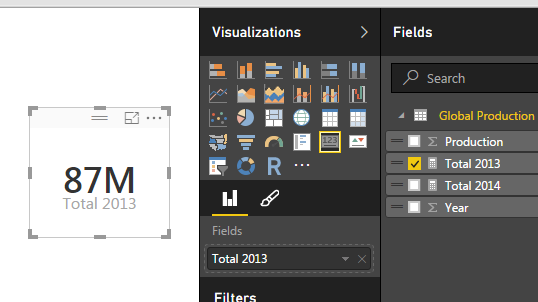
    This creates another measure for all the production in 2013.  Below is the Card for the 2013 Production total.

    2013 Production
    2013 Production

    And for my final trick of the evening I’ll calculate the percent change between 2014 and 2013.  To to this we will copy the portions of the two previously created measure to create the percent change calculation which follows the formula [(New Value) / (Old Value)]- 1.

    % Change = CALCULATE(sum('Global Production'[Production]),FILTER('Global Production','Global Production'[Year] = 2014)) / CALCULATE(sum('Global Production'[Production]),FILTER('Global Production','Global Production'[Year] = 2013)) - 1

    This makes for a long equation but now we have calculated % change between 2013 and 2014.

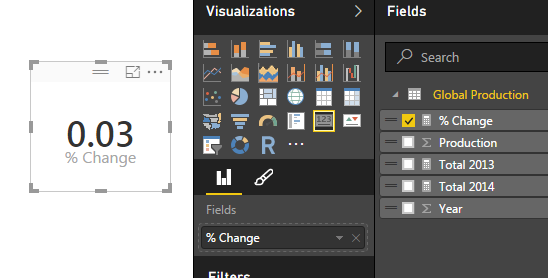
    Percent Change
    Percent Change

    Wait you say.  That seems really small, 0.03 % change is next to nothing.  Well, I applaud you for catching that.  This number is formatted as a decimal number and not a percentage, even though we labeled it as % change.  Click the measure labeled % Change and then Click on the Modeling ribbon.  Change the formatting from General to Percentage with one decimal.  Notice we now have a percentage.

    Change Format to Percentage
    Change Format to Percentage

    Thanks for working along with me.  Stay tuned for more on percent change.  Next we will work on calculating the percent change dynamically instead of hard coding the year values into the measures.

    Want to learn more about PowerBI and Using DAX.  Check out this great book from Rob Collie talking the power of DAX.  The book covers topics applicable for both PowerBI and Power Pivot inside excel.  I’ve personally read it and Rob has a great way of interjecting some fun humor while teaching you the essentials of DAX.

    Please share if you liked this tutorial.