Tag: Theme Generator

  • Tips+ Designer and Theme Generator Tutorial: Automatic Visual Objects with AI

    Tips+ Designer and Theme Generator Tutorial: Automatic Visual Objects with AI

    Welcome to today’s tutorial where we’ll explore an exciting feature implemented to streamline your background creation process in Power BI. If you’ve ever found yourself spending too much time tweaking and aligning visual elements, this AI-powered solution will be a game-changer for you. This new feature continues to simplify the report visualization experience and open doors for other teams to decide on the visualizations, develop the look & feel, and pass off a pbip object to Data Engineers or BI Developers to easily add data into.

    If you prefer to follow along via video, you can check out the full walkthrough on the PowerBI.tips YouTube video here:

    Background

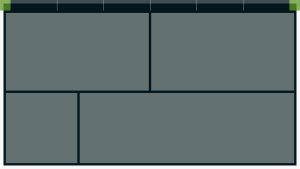
    Designing the look & feel of a report typically begins with tools like PowerPoint, Adobe XD, Illustrator, or Figma, where we craft our initial background designs. Whether simple boxes or intricate layouts, these designs serve as the canvas for our data stories. We decide what visuals we want, how many objects we want on a page, and how much real estate to assign. A lot of time is spent doing this. However, once you have this background image, you still have to create all the visual objects and nudge them into place.
    Introducing Visual Auto-Layout AI Feature

    Now, with the Power BI Tips+ Theme Generator you now have a tool that can recognize these design elements and automatically generate visual objects, saving you precious time and effort!

    Step 1: Access the Power BI Theme Generator

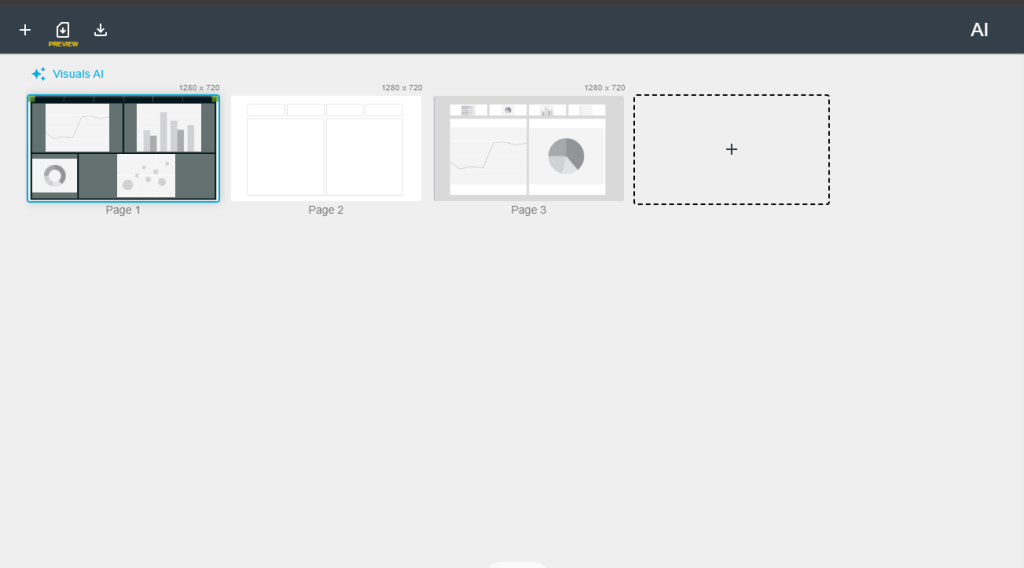
    Navigate to the Power BI Theme Generator, where you can upload your background images. Its extremely easy to generate new pages, and quickly upload your image to each page.
    Step 2: Let AI Do the Heavy Lifting

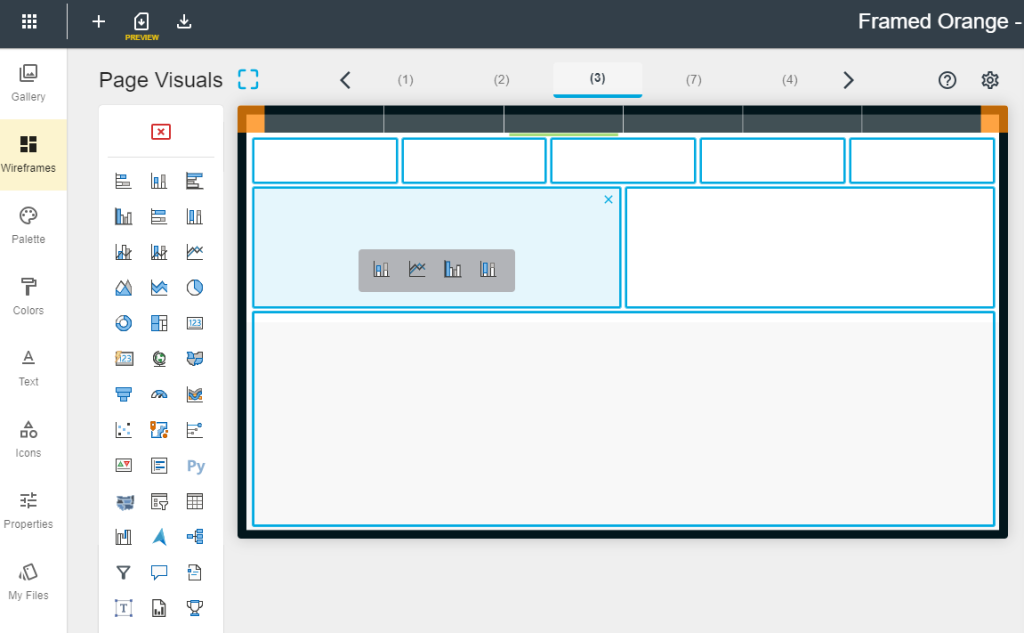
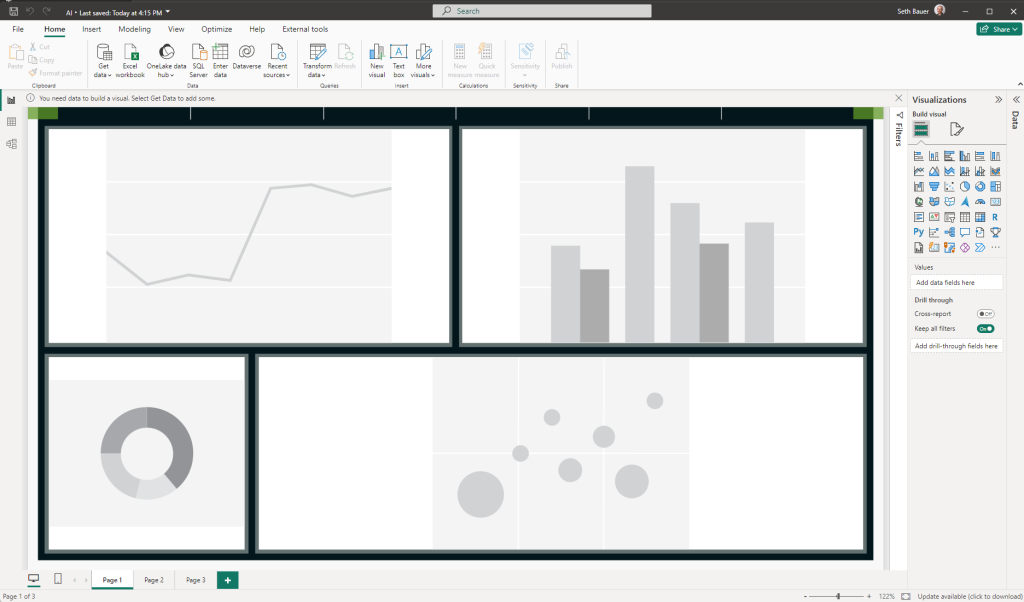
    With a click of a button our AI auto-layout feature identifies the background elements and aligns visual objects accordingly. This means no more manual adjustments or tedious alignment tasks. You can do this on a page by page level OR have the Visuals AI generate all images on all pages with just a click of a button!

    Step 3: Customize Your Visualizations

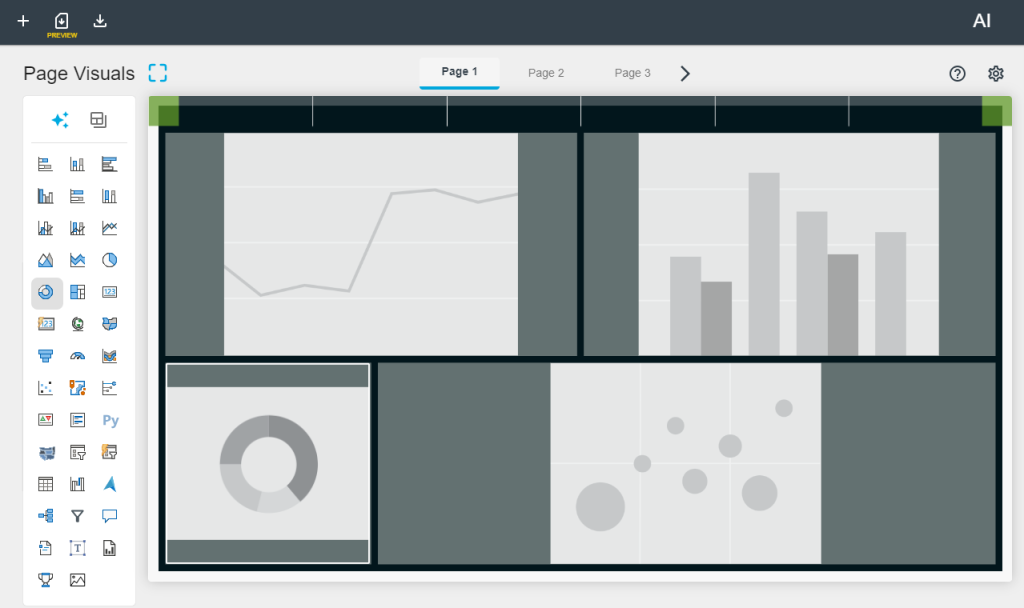
    Once the visual objects are generated, all that’s left to do is select the visualizations you want to insert into each space. Enjoy the flexibility to choose the perfect visual representation for your data insights.
    Step 4: Download and Implement

    Getting this into a Power BI report is as easily as downloading the PBIX file. This file will contain all your customized background and visualizations. And as always, you can enhance your Theme file with any preconfigured setting just by adding that to your Theme Generator file. After that, just extract the files and open your Power BI report by opening the .pbip file. Voila! Your professionally designed background with perfectly aligned visuals is ready to add data to!
    Conclusion

    By leveraging the power of AI, you’ve not only saved valuable time but also unlocked new possibilities for creativity and efficiency in your data visualization journey. With this streamlined process, you can focus more on crafting compelling data stories and less on manual design tasks.

    I hope you found today’s tutorial insightful. Stay tuned for our next tutorial, where we’ll explore another exciting feature that enhances your Power BI experience. Until then, happy visualizing!

  • Tips+ Designer and Theme Generator Tutorial: Gallery Project Copy & Edit

    Tips+ Designer and Theme Generator Tutorial: Gallery Project Copy & Edit

    Introduction

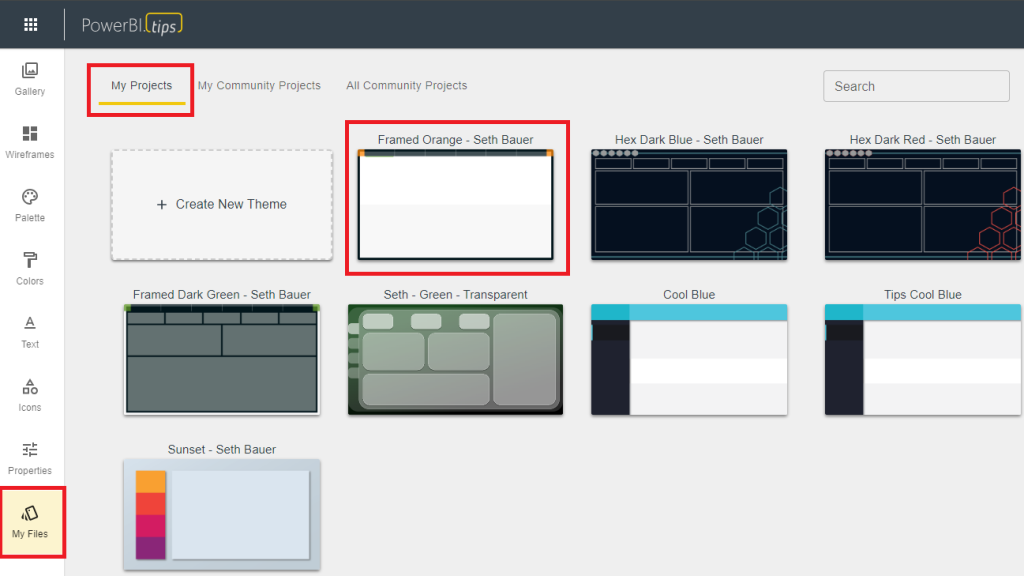
    Welcome to today’s tutorial where we dive into the powerful capabilities of the Power BI Tips+ Theme Generator. In this post, we won’t just download a project from the Gallery; instead, we’ll guide you through the process of copying and editing a project file using the Power BI Tips+ Theme Generator. Today, we’ll focus on the Framed Orange theme to showcase the flexibility and customization options available.

    If you prefer to follow along via video, you can check out the full walkthrough on the PowerBI.tips YouTube video here:

    Step 1: Copy and Edit Project File

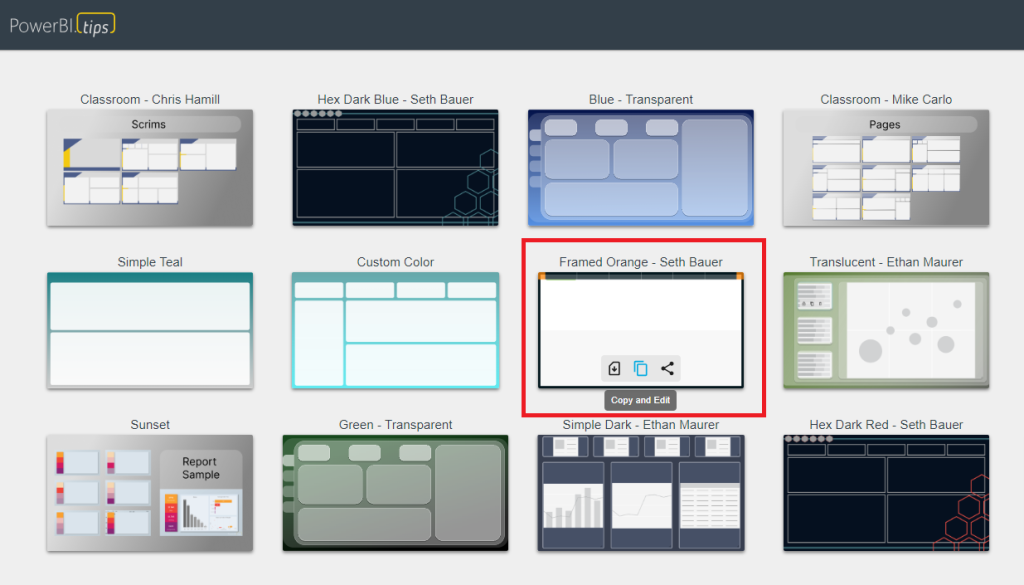
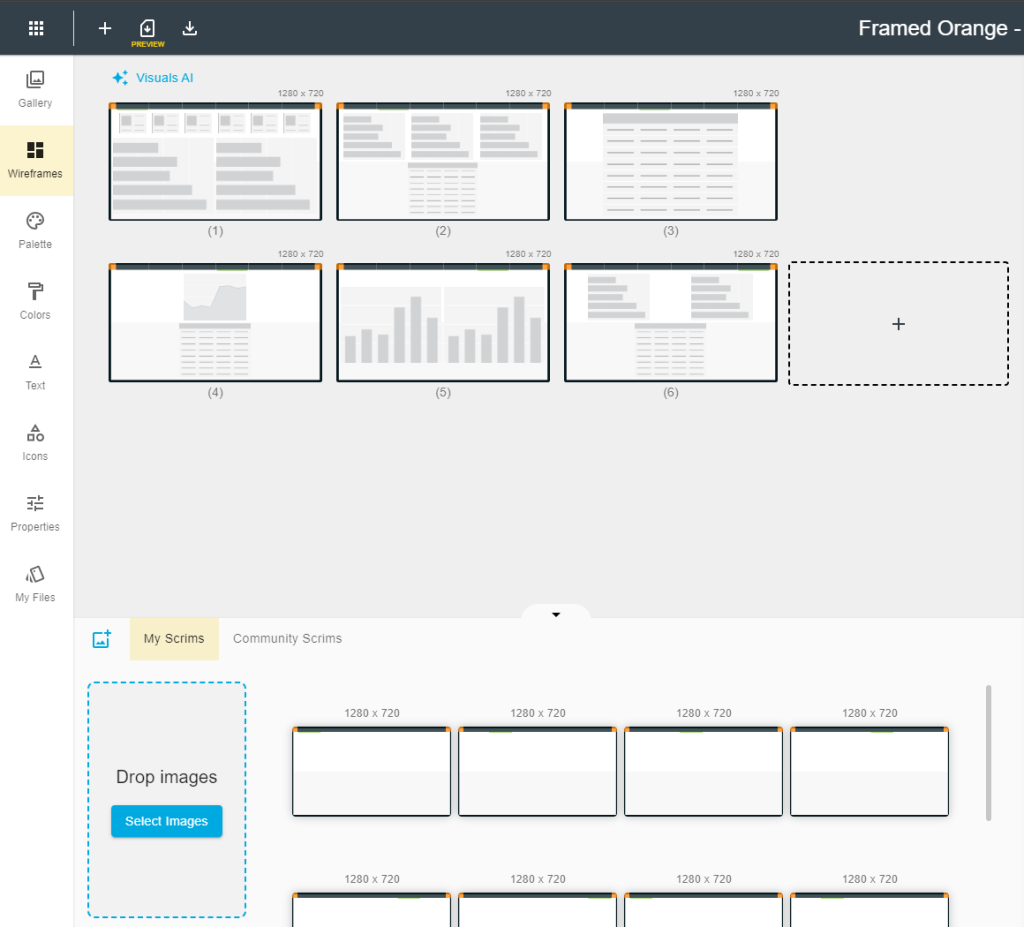
    Start by selecting the Framed Orange theme in the Power BI Tips+ Gallery. Click on “Copy and Edit” to open the project file. The Gallery project will open this project in your workspace and show you all the pages and visualizations in the Wireframe area.

    Step 2: Customizing Project

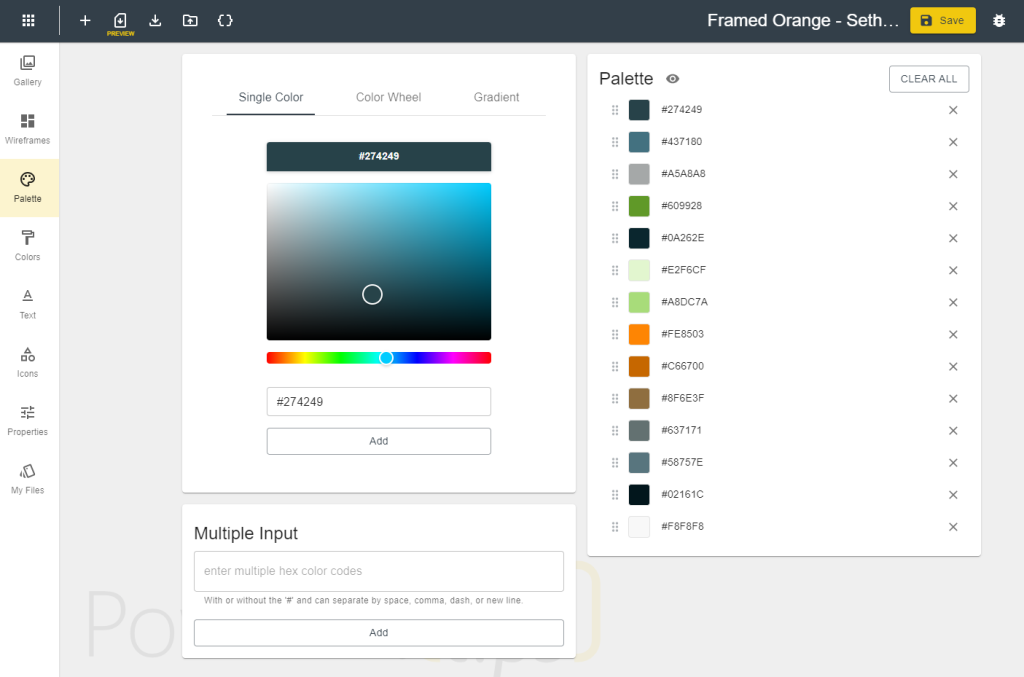
    Upon opening the file, you’ll notice wireframes representing the background and areas where visualizations will go. These project files contain all of the backgrounds, visuals and theme properties. In this case we have a palette and visualization properties set, so they are also imported. In our example, a gray border is applied to all visuals and a suite of colors is found in the palette.

    Step 3: Applying Changes

    Make changes to the project file as needed. In this tutorial, we’ll curve the edges of visualizations in the properties area, and bring in our own custom color palette. Easily add hex codes of your preferred colors to personalize the project.

    Step 4: Preselecting Visualizations

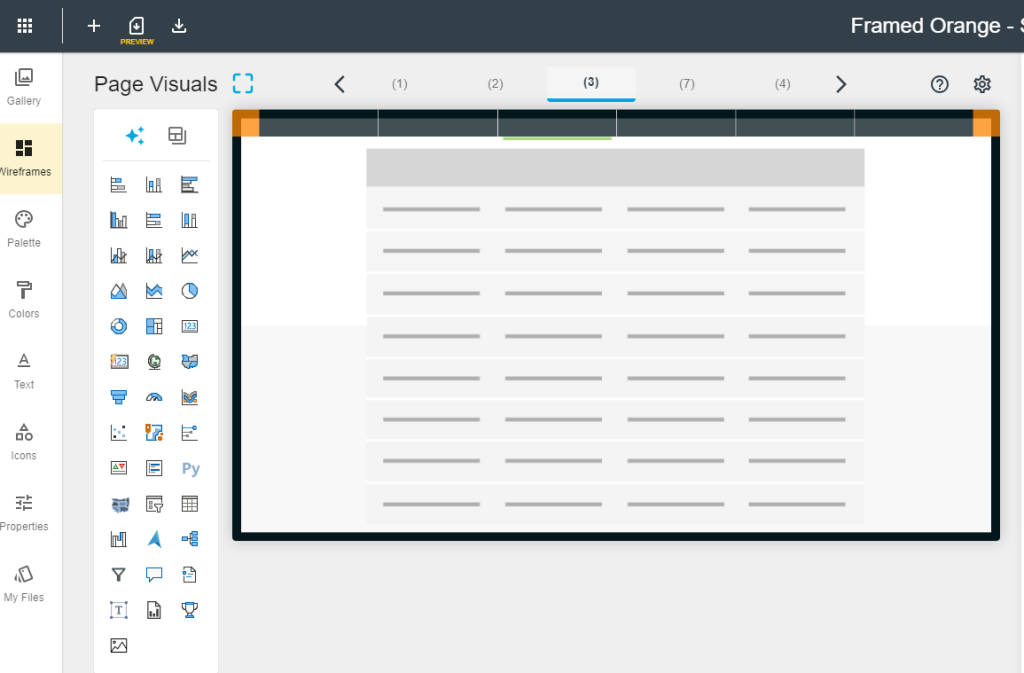
    As you navigate back to the Wireframes section you can see how easy it is to add the visuals to the predefined visual objects. You aren’t locked into these though and you can easily change the size and position. We’ve thought of that too! On Page 3 of this project, for instance, the project file has a large table.

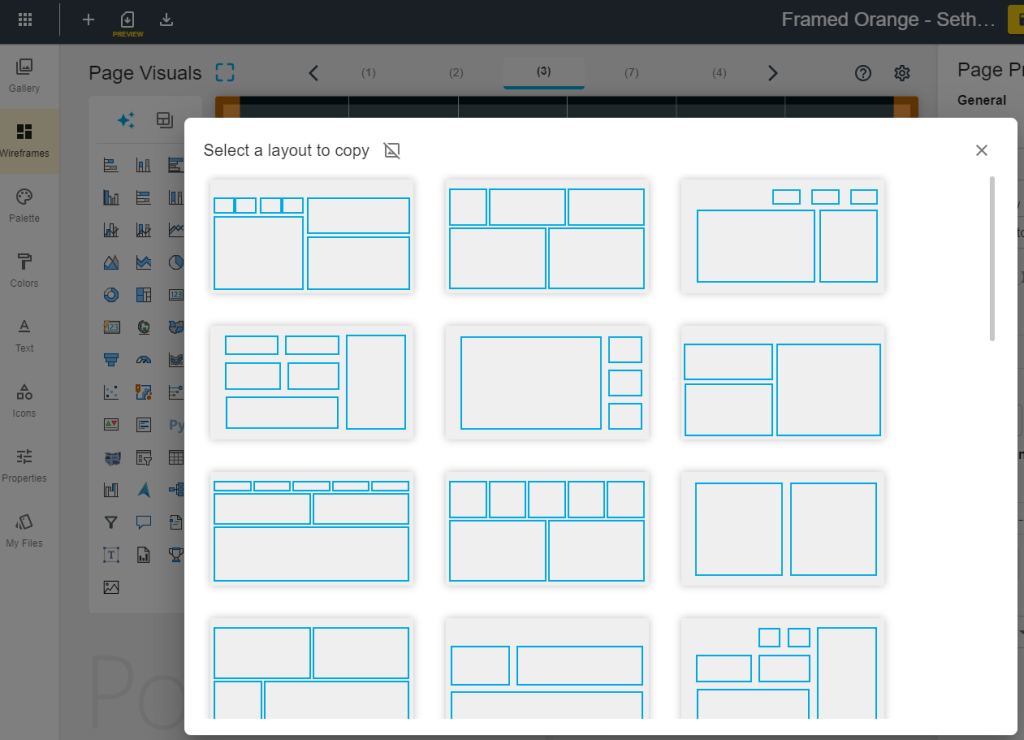
    Instead of using that, you can choose from predefined templates of visual objects to easily apply to the background. This feature makes it easy to align and space visualizations appropriately.

    Pick the one that suites you best, and apply it to your background. Now that we have that, we can choose which visuals we want to add for easily dropping our data into.

    Setting up a background, and perfectly aligned visuals to create beautiful reports has never been easier!

    Step 5: Downloading the Modified pbip File

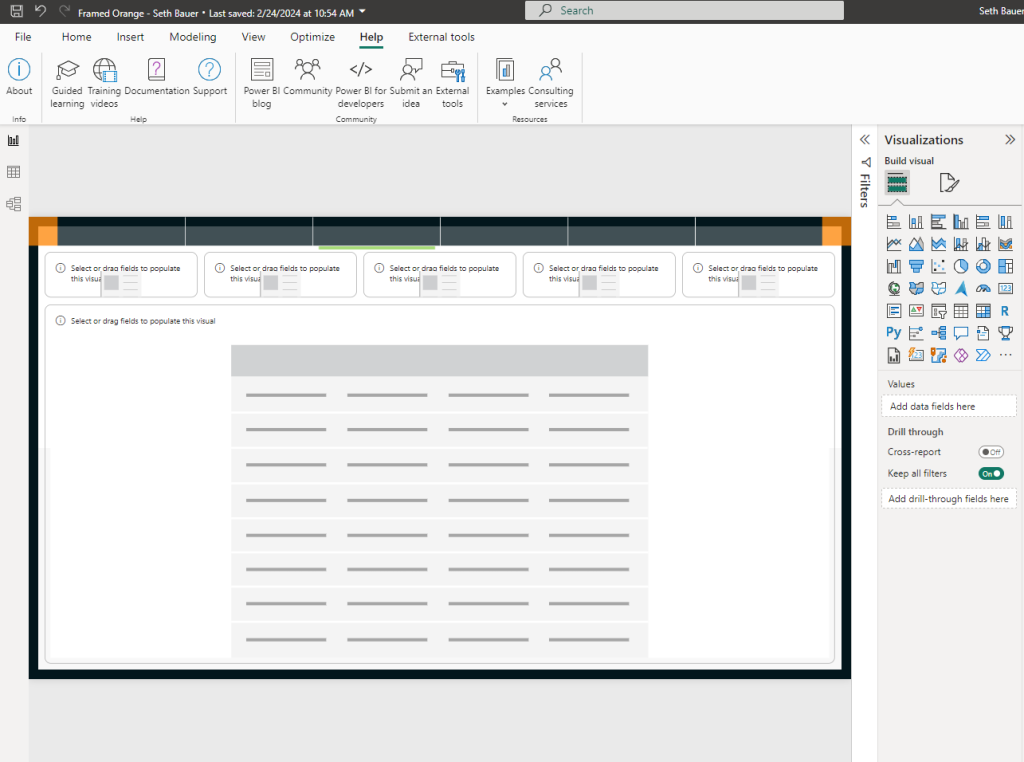
    Download the modified project file (pbip) file to your computer. Extract the files and open the PBI file in Power BI Desktop. You will see that all of our properties, new theme, and background are all applied to the report.

    Step 6: Adding Data

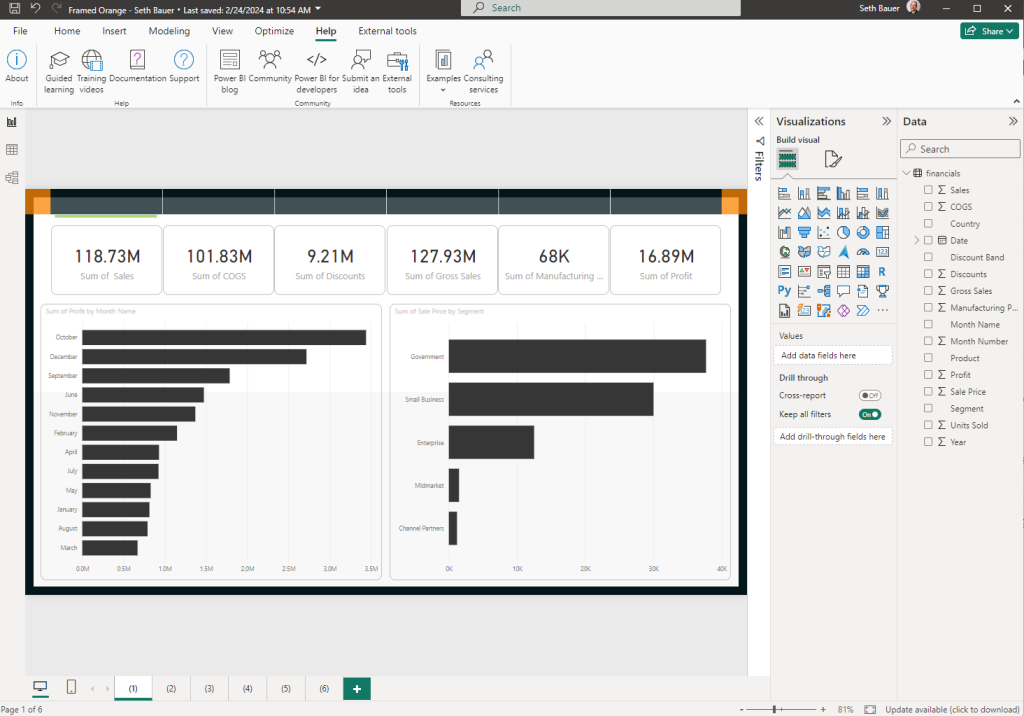
    Load your data or use a sample dataset to see the visualizations populated. Drag and drop or select visualizations to add your data into the pre-configured fields.

    Step 7: Exploring My Files Section

    Did you realize you missed a few properties or colors, or maybe wanted to add one more page? Not a problem, you can go back and tweak the project file any time you want, because its yours! Discover the My Files section in the Power BI Tips+ Theme Generator, where you can explore and update all settings and properties for your current and future projects.

    Conclusion:

    With the Power BI Tips+ Theme Generator, you can effortlessly customize and enhance your Power BI reports without spending large amounts of time tweaking all the visualization settings for every report you create. Use the Tips+ Theme Generator to create amazing templates to use over and over again!

    Stay tuned for our next tutorial, where we’ll delve into the exciting new AI features within the Power BI Tips+ Gallery. Elevate your reporting game with simplicity and efficiency!

  • Tips+ Designer and Theme Generator Tutorial: Gallery Project Download for Easy Theme Solutions

    Tips+ Designer and Theme Generator Tutorial: Gallery Project Download for Easy Theme Solutions

    Welcome to today’s tutorial where we’ll explore the Power BI Tips+ Theme Generator and its incredible features designed to streamline your Power BI report building experience. In this walkthrough, we’ll guide you through the process of getting started with the Power BI Tips+ Gallery, focusing on the Sunset theme. By the end of this tutorial, you’ll be able to effortlessly integrate our pre-configured Gallery Projects into your Power BI reports. It doesn’t get easier than this!

    If you prefer to follow along via video, you can check out the full walkthrough on the PowerBI.tips YouTube video here:

    Step 1: To begin, head over to powerbi.tips and navigate to Tools > “Themes New” section. Select the “Gallery” and you will notice the collection of Gallery Projects (A Gallery Project is comprised of a background, theme, and Power BI visuals all in one package). Highlight the Sunset theme for today’s demonstration, and select the “download .pbip Project”

    This file includes everything you need to create or alter your Power BI report visual aesthetics. After the download is complete, extract all files to your directory of choice.

    Extract & Open the Project in Power BI Desktop

    Step 2: Open the .pbip File by double-clicking on it. This will automatically launch Power BI Desktop! Ready to start working on adding data to your report?

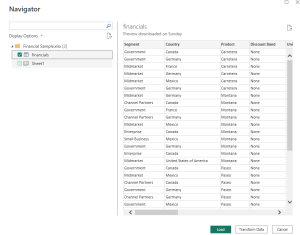
    Step 3: Load Data in Power BI Desktop. For this tutorial, we’ll use the financials dataset. Simply click on the desired dataset and load it into the report.

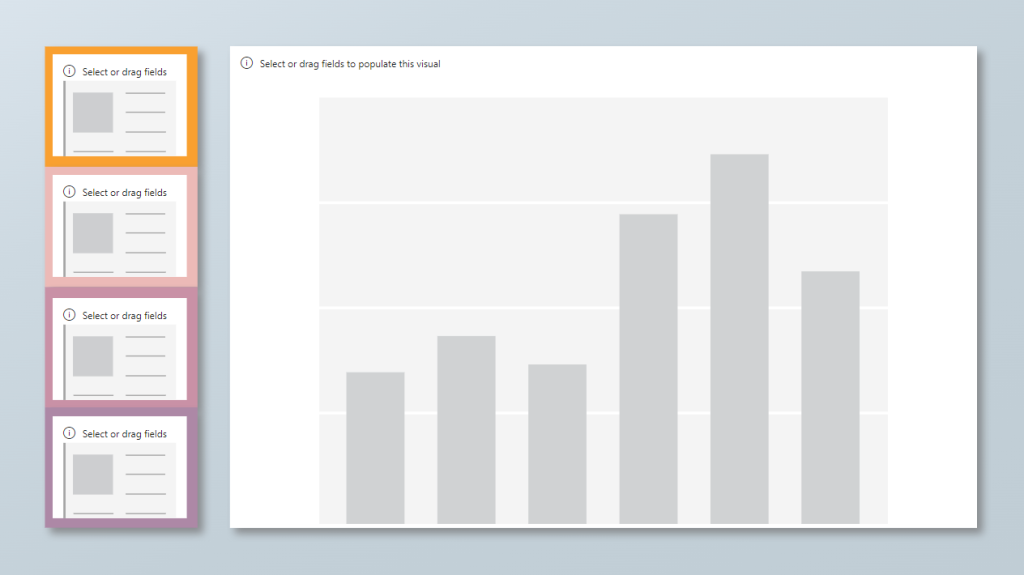
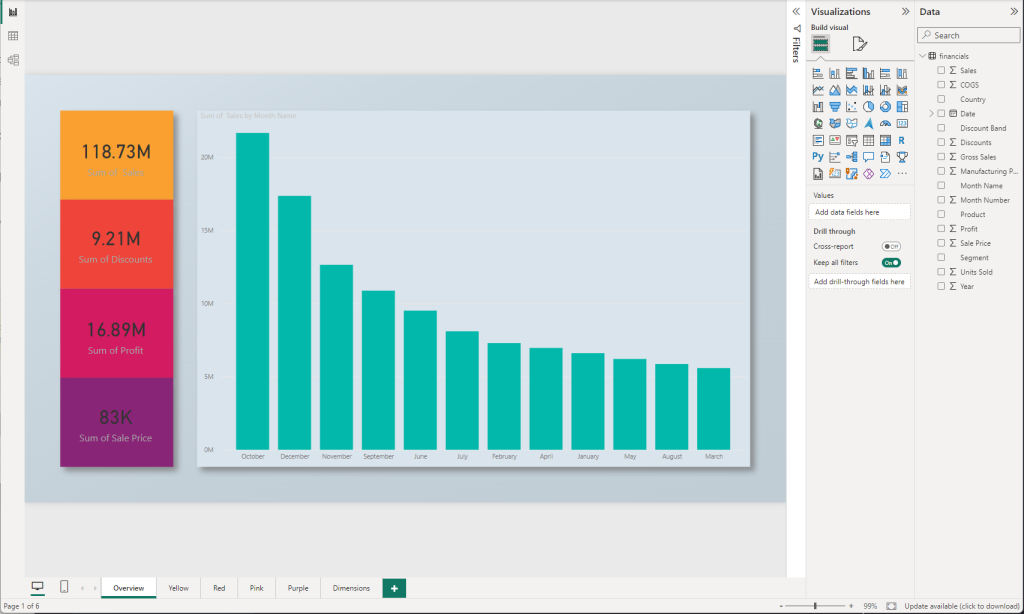
    Once we have the data loaded we can navigate to any of the pages. You will see that you already have a pre-configured background, visuals on the page, and a theme of colors that were created using the Tips+ Theme Generator!

    Apply Your Data

    Step 4: The report consists of overview tabs in yellow, red, pink, and purple, along with a dimensions tab. You can easily remove the initial description page to focus on your data. Because you already have visualizations aligned and on the report canvas, all you need to do is select the visual and click on the columns you want to add!

    Step 5: If a specific visualization doesn’t suit your needs, feel free to change its type as these are the standard Power BI visualizations. If something doesn’t align directly to your expectations, you can always adjust the properties, or change the theme itself in the Tips+ Theme Generator! We’ll walk through how to customize these pre-configured packages in our next tutorial. “Gallery – Customized Projects”

    Conclusion

    Congratulations! You’ve successfully integrated pre-configured Tips+ Gallery Project into your Power BI report using the Power BI Tips+ Theme Generator Gallery. This powerful tool simplifies the report-building process, saving you time and effort. Explore all the features available in the Tips+ Theme Generator to enhance the visual appeal of your reports effortlessly. Stay tuned for more tips and features in our upcoming tutorials. Happy reporting!