


Ok, I’ve got to be honest the first two tutorials (Loading Excel Files, Loading CSV Files) were only there to get things kicked off. Now we are getting to some of the good stuff.
When I first saw this feature in Power Query for excel I nearly had a conniption. My first thought is this is going to CHANGE EVERYTHING, and to be perfectly honest it has. My entire view of Excel and Power BI has been shaped by this simple but powerful idea; Automated Data Loading.
In all my years as an engineer I would have to constantly copy and paste data from one excel file to another. Then perform some transformations just to produce a bar chart or a line graph, uggh. This is slow and boring. I was really good at being boring, and I felt like I was able to become quite ingenious by writing macros and automating parts of my data transformations. Now I have seen the light, The simple ability of being able to load a group files from a folder is AWESOME! Had I had this feature in my engineering days I could have saved so much time. So in true homage of my engineering roots this post is for you, the all mighty data hungry engineer.
Alright, enough of be babbling, Lets get to it.
Materials for this Tutorial:
- Zip file with (3) three excel files download Data Set.
- Power BI Desktop (I’m using the March 2016 version, 2.33.4337.281) download the latest version from Microsoft Here.
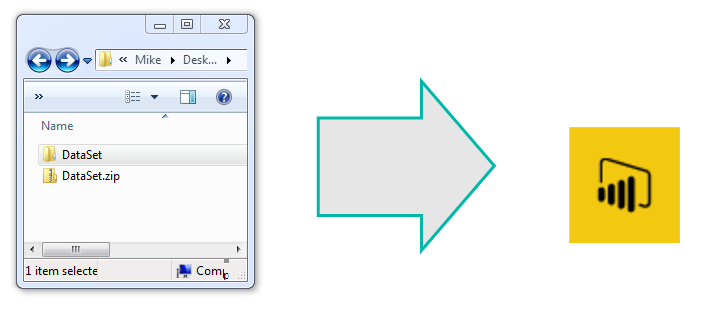
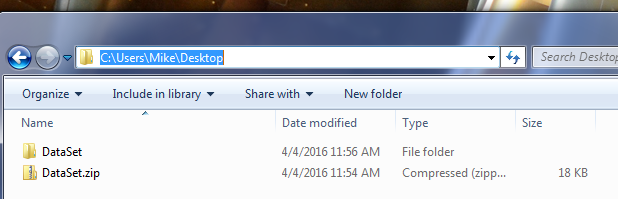
Lets start off by downloading the Data Set and unzipping the file to a folder called DataSet. For this demo I unzipped the files to my desktop folder.
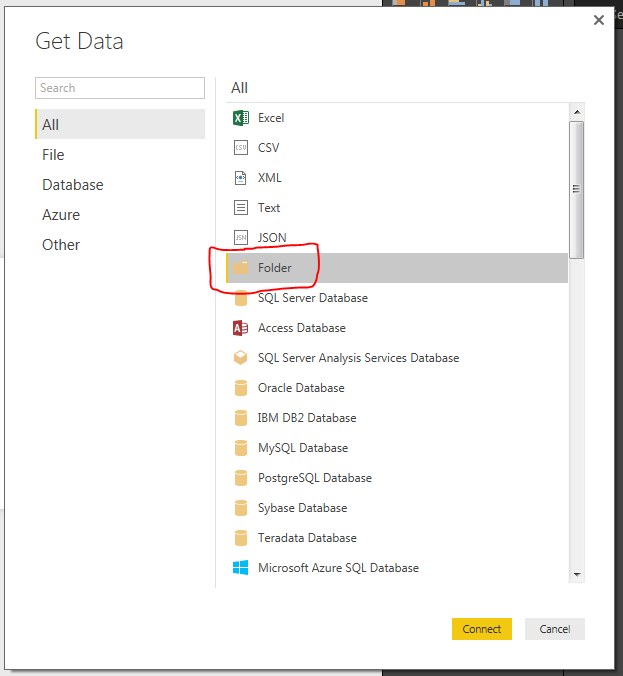
Next we will open up Power BI Desktop. On the Home ribbon select the Get Data button. The Get Data window will be presented and this time we will select the Folder icon in the menu.
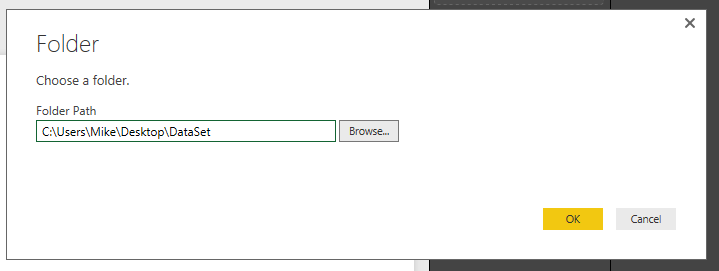
Click the Connect button at the bottom right of the screen. A folder window will display. This is where we will select the location of our data in the folder we unzipped earlier. Click OK once you’ve selected the location of the folder.
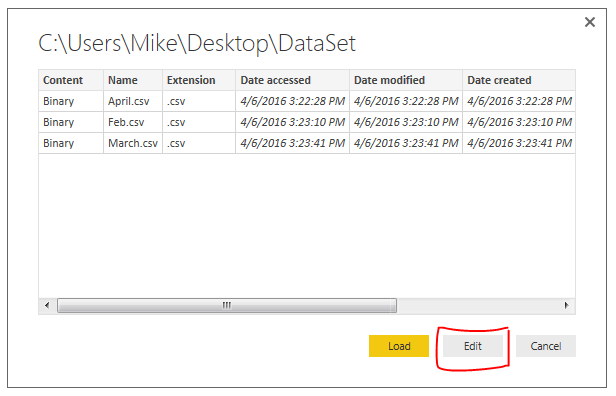
The next window to open shows the files that Power BI Desktop is able to see in the folder location. Normally we would press Load and move forward but in this case we want to further manipulate our query to load the data. Therefore, Click the Edit button to modify the query to load data.
We are now in the Query Editor. This is where we can manipulate the incoming data before we visualize it.
Note: The Query Editor is a graphical representation of the M-language which is used to load data. Each button press in the Query Editor performs a transformation to your data. Each step writes a little line of code that handles the transformations. To see the code Click the View ribbon then click the button labeled Advance Editor. For more documentation on the M language look at the Microsoft documentation located here.
Here is an image of the files we loaded in from our folder location in the Query Editor.

The next step is to combine all the files into one combined data model. To do this click the Double Down Arrows that are circled in red on the left side in the column called content.
Note: I also circled the Query Settings in Red on the right. The Query Settings window will become very useful, especially when trouble shooting a query. You will notice as we make additional data transformations more steps will accumulate in the query settings.
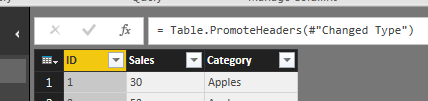
We now have a final view of all the data from each of the three CSV files.

The file needs a little clean up to remove some unwanted data rows. Notice now that we have loaded all three files. In each file we had a header row. Now in our data model we have three rows with headers. We want to use the first row as column names. To do this, Click the Use First Row as Headers button on the Home ribbon.
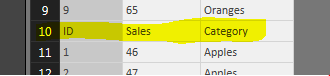
Also, notice there are rows of data that contain the initial header rows from the other two files.
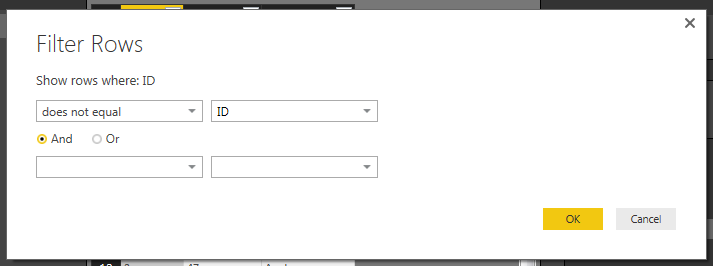
Now we will apply a filter to remove these rows. Click the Arrow in the ID row. This will present a menu. There are various transformations on this screen, you can sort a row in Ascending, or Descending order, Filter out text items, etc…
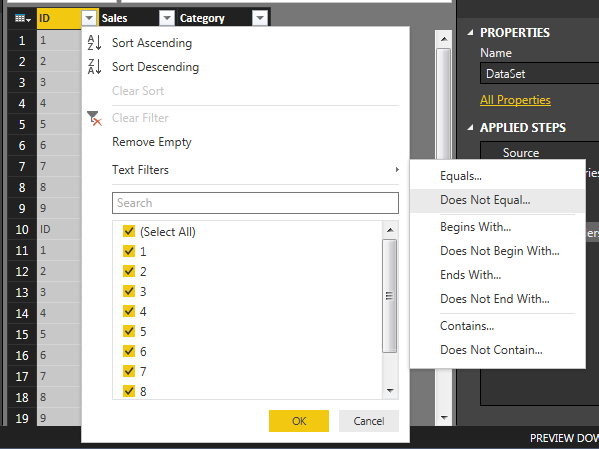
Click Text Filters and select Does Not Equal and enter ID into the filter. Click OK to proceed. This will add a step to remove any row that had ID listed in the ID column.
We have transformed our data and now have cleaned the data and it’s ready for use. Click Close and Apply to load the data to the data model. Now the data is ready for visualizations. Thanks for following along.
Make sure you take some time to share if you enjoyed this tutorial.