
This post is going to be similar to my previous post about Getting Data. I figure we better cover some of the basics before going crazy with deeper topics.
Materials for this tutorial:
- CSV file with some random data, linked here: SampleData in CSV format
- Power BI Desktop (I’m using the March 2016 version, 2.33.4337.281)
After I read the previous version I thought it would be helpful to put the materials up at the top and what version I was using. If you didn’t know Microsoft has been very active in the development of PowerBI.com and Power BI Desktop. Right now there are weekly updates to PowerBI.com and monthly updates to Power BI Desktop.
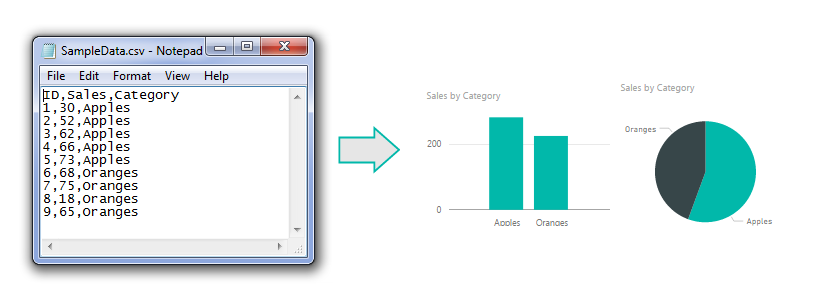
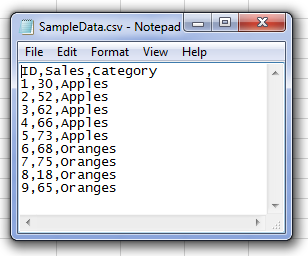
Starting off like before here is a sample of the data from the csv file. I’m showing the data in notepad to prove it is a comma separated value file (hence the CSV name).
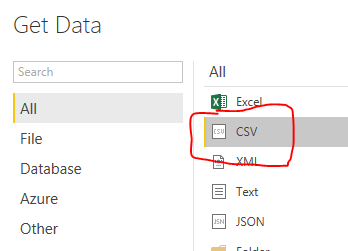
Alright, lets go get some data. Open up Power BI Desktop. Click on the Home ribbon. Select the Get Data icon.

Now the Get Data window will open. Next, select the second item labeled CSV from the top of the list on the right.
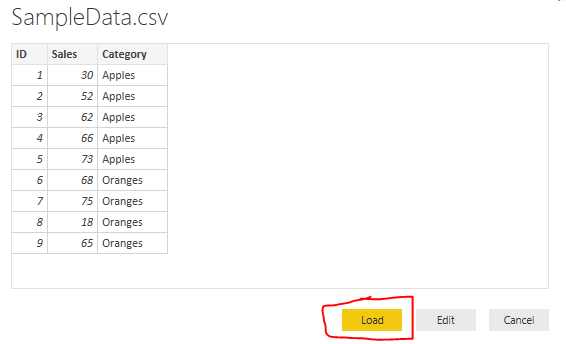
Click the Connect button at the bottom right hand of the Get Data screen to proceed to the next screen. Now the open window will let you navigate to the CSV file you would like to import. Click the Open button at the right of Open window to load the CSV file. Finally you’ll be presented with the data view of the contents contained inside your CSV file.
Once loaded we now have our view of all the columns of data in the Fields viewing pane on the right. From here we can build our visuals.
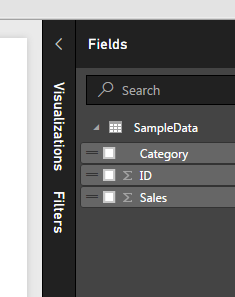
Now, lets throw together a quick visual of the data.
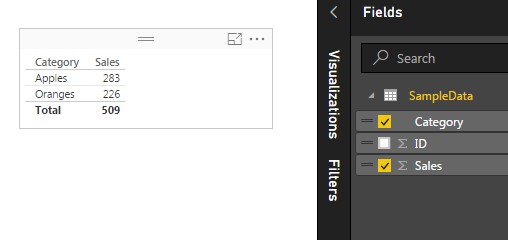
Start by clicking the check box next to the label titled Category and then click the box next to the label titled Sales. This will automatically populate a table with the categories in the first column and the sales for each category in the second column.
To open up the Visualizations bar click on the word Visualizations. This will present all the information relating to the visuals. Upon opening up the visualizations pane there is a small yellow square showing you which visual is selected.
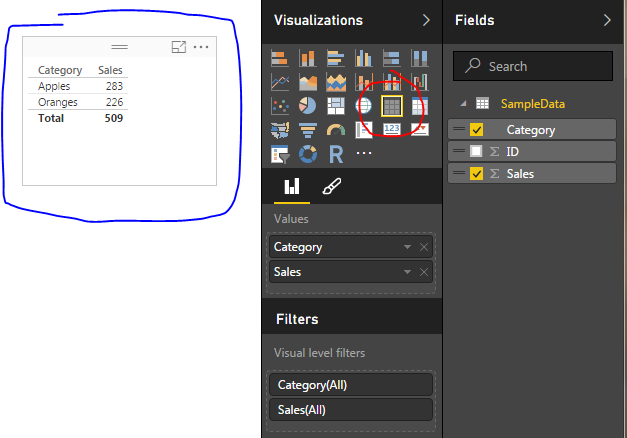
Note: The blue pen highlighting shows the selected visual on the page. As you build more complex visuals there will be multiple visualizations on your page. When you select a specific visual, all the properties in the Visualizations Bar show all the properties for the selected visual. The Table visual is highlighted by the red highlight circle.
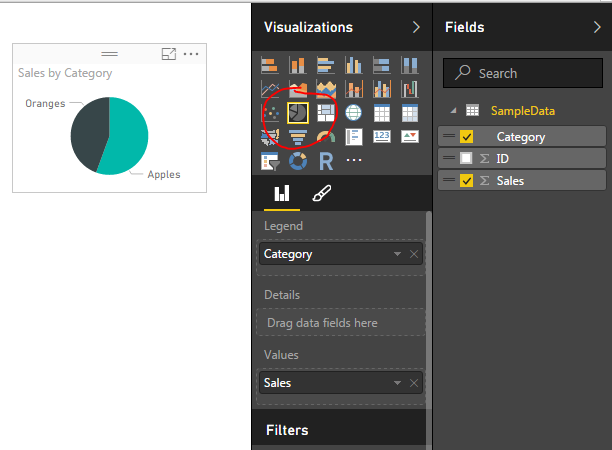
To change our selected visual to a new visual we will simply select a new icon in the Visualizations bar. Click the icon that looks like a pie chart.
Cool, but what if I want more awesomeness on my page. No problem. Let’s copy our visual. You can do this by selecting the visual. To know it is selected look for the slight grey bar at the top of the visual.
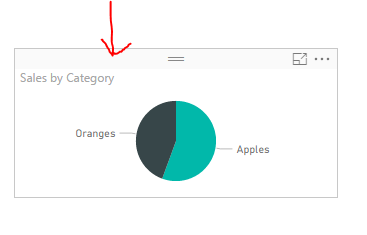
Copy the visual by using Ctrl + C. Click any where on the white space on the page. This will deselect the current visual. Then paste an identical version of the visual by using Ctrl + V.
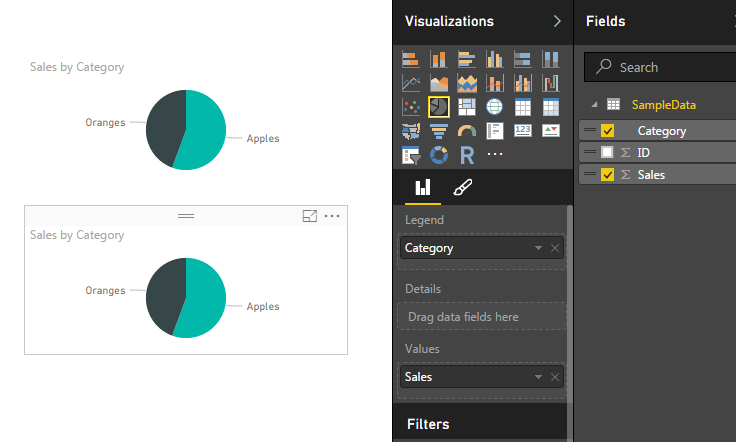
Ta-da! Now we are really getting somewhere. Two Amazing visuals, well not quite. Two identical visuals isn’t very compelling. Lets change one of the visuals to a different visual.
Select the top visual by clicking on it. Then select the Stacked Column Chart which is the second icon from the left in the top row. Selecting this icon will change the visual.
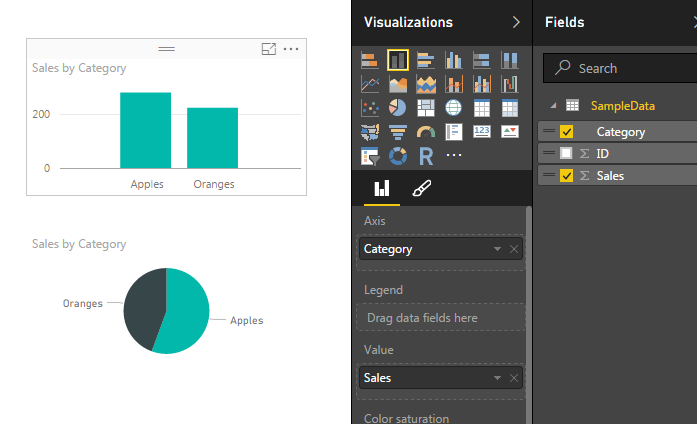
And there you have it. You’ve imported a CSV file and generated two visuals. Nice job.
Hope you enjoyed this tutorial. Leave comments if you have questions or if you want to see something else in a tutorial. If you like what you see please share this post on your selected social network of choice below.