Month: June 2016

  • Loading Data From Folder

    Loading Data From Folder

    Let me setup a scenario for you.  You get a data file from an automated system, it has the same number of columns but the data changes for every new file.  Being the data savvy person that you are you’ve spent some time working in excel to make a template where you can copy your new data into and then automatically all your equations and graphs magically work.  You pat your self on the back and happily send out your fantastic report to everyone you know.  Then tomorrow when the data comes to you again you repeat the same process over again.  Still enamored by your awesome report, you send it out again knowing you have saved your self so much time not having to do the analysis or creation of your reports over and over again.  Now, fast forward 3 months.  That stupid report shows up again, and now you have to lug all that data from file to file and begrudgingly you sent out your report.  Thus, is the store of the analyst.  You love data, but you hate it as well.  Well in this tutorial I’ll show you how to remove some of the pain of that continual data loading process by loading new data from a folder.

    My previous post (found here) talks about loading data from a folder.  In this tutorial we will add some logic to this method that will look at a folder but only load the most recently added item from that folder.

    Data for this tutorial is located this link Monthly Data Zip File.  This data in the ZIP file is a monthly data sample from Feb 2016 to April of 2016.

    Download the zip file mentioned above and extract the Monthly Data folder down to your desktop.  Open up PowerBI Desktop and click on the Get Data button and select All on the left side.  Click on the item labeled Folder and click Connect to continue.
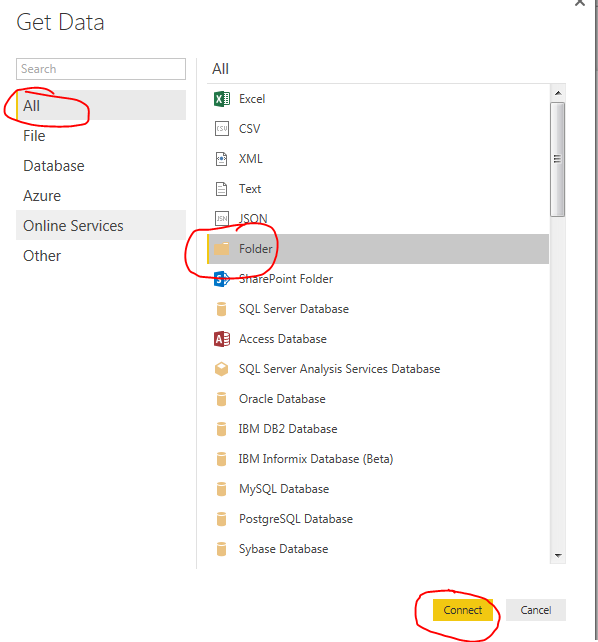
    Get Data from Folder
    Get Data from Folder


    Select the newly unzipped Monthly Data folder that should be on your desktop.  Click OK to continue. Upon opening that folder location you will be presented with the multiple files.  Click Edit to edit the query.
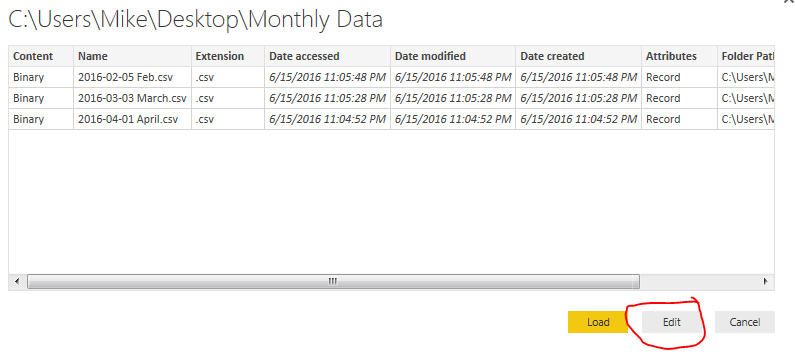
    Edit Query for Folder Load
    Edit Query for Folder Load

    Now you are in the Query Editor.  This is where the fancy query editing will work to our advantage.  We could load all the data into one large query.  However, depending on the size of your data sets or how you want to report your data this may not always be desirable.  Instead you may only want data from April, then May when the new data is sent next month.

    Thus, our first step to start pairing down the data will be to first filter the files in sequential order.  In this case because I have named the files with a Year-Month-Day format I can sort the files according to their names.

    Note:  When using PowerBI desktop it is a good practice to name the files  beginning with a YYYY-MM-DD file name.  This makes it really easy when sorting and ingesting information into PowerBI.  I have used other columns of information such as Date Accessed or Date Created before but have gotten inconsistent results as these dates can change depending on when a file was moved or copied from one place to another.

    Click the drop down next to Name and sort the files in Sort Descending.

    Name in Descending Sort
    Name in Sort Descending

    This places the files with the most recent file at the top of the list.
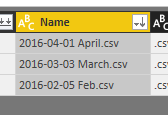
    File List in Descending Order
    File List in Descending Order

    Next click on the Keep Rows button on the Home ribbon, select Keep Top Rows.

    Keep Top Rows
    Keep Top Rows

    Enter the number when the popup appears.  Click OK to continue.
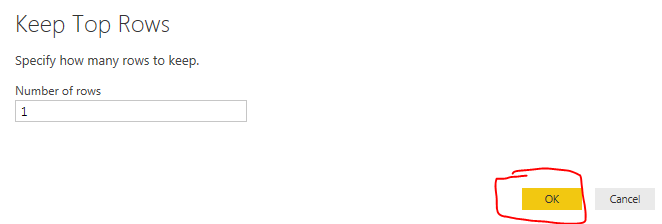
    Keep Top Rows Menu
    Keep Top Rows Menu

    Now you’ll notice you have only one file selected which is our latest file from April.  Click the Load File button found in the Content column.

    Load File Button
    Load File Button

    We have completed the activities in the Query Editor and can now load the data.  Click Close & Apply found on the Home ribbon.  All our April data has loaded.  by making a simple table we can now see all the data that was just loaded.
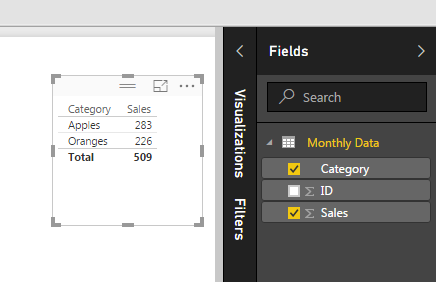
    Loaded Data from April
    Loaded Data from April

    Now we will remove some data from our desktop folder labeled monthly data.  Open the folder on the desktop labeled Monthly Data and delete the filed labeled 2016-04-01 April.  You should now have a folder labeled Monthly Data with only two files in it, one for Feb and one for March.

    Two Files Left
    Two Files Left

    Return back to Power BI Desktop and click the Refresh button on the Home ribbon.  Notice now how all our data has changed.  We are now looking at the March data because it is the most recent file in our folder based on the file name.
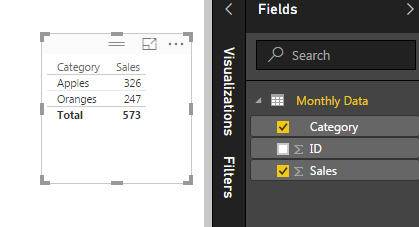
    March Data Load
    March Data Load

    To verify this we open the query editor (Click the Edit Queries on the Home ribbon).  Click Refresh Preview on the Home ribbon and finally select the Applied Step called Kept First Rows.  This will reveal the month of March as our data source.
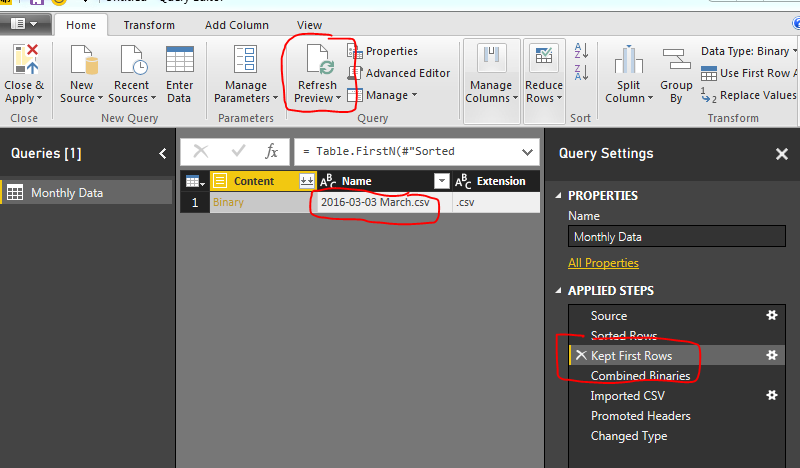
    Month of March Loaded
    Month of March Loaded

    Now, every time you add a new file to our folder and refresh PowerBI the latest file (based on the naming convention we talked about earlier) will always be loaded.

    Note: This method works great when your data source is coming from an automated system.  The file format must always be the same for this to work reliability.  If the file naming convention changes, or the number of columns or location of those columns changes then the query will most likely fail.

    Good luck and thanks for following along.

  • Measures – Dynamic Percent Change – Using DAX

    Measures – Dynamic Percent Change – Using DAX

    This tutorial will produce a measure that will dynamically calculate a percent change every time an item is selected in a visual.  The previous tutorial can be found here.  In the previous tutorial we calculated the percent change between two time periods, 2014 and 2013.  In practice it is not always desirable to force your measure to only look at two time periods.  Rather it would be nice that your measure calculations change with changes in your selections on visuals.  Thus, for this tutorial we will add some dynamic intelligence to the measures. Below is an example of what we will be building:

    First here is the data we will be using.  This data is the same data source as used in the previous % change tutorial.  To make things easy I’ll give you the M code used to generate this query.  Name this query Auto Production.

    let
     Source = Web.Page(Web.Contents("https://en.wikipedia.org/wiki/Automotive_industry")),
     Data0 = Source{0}[Data],
     #"Removed Columns" = Table.RemoveColumns(Data0,{"Change", "Source"}),
     #"Changed Type" = Table.TransformColumnTypes(#"Removed Columns",{{"Production", Int64.Type}, {"Year", Int64.Type}})
    in
     #"Changed Type"

    Note: the code shown above should be added as a blank query into the query editor.  Add the code using the Advanced Editor.  Another tutorial showing you how to add advanced editor code is here

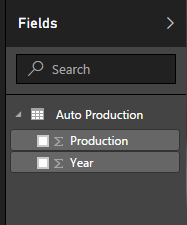
    Once you’ve loaded the query called Auto Production.  The Field list should look like the following:

    Production
    Auto Production

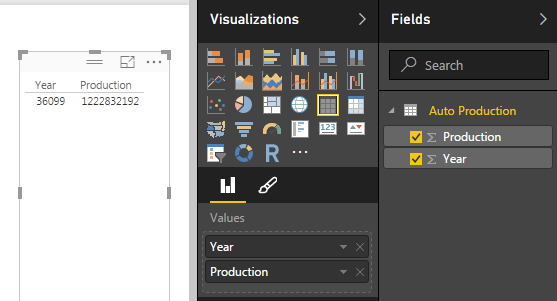
    Next add a Table with Production and Year.  this will allow us to see the data we are working with.  When you initially make the table the Year and Production columns are automatically summed, thus why there is one number under year and production.

    Table of Data
    Table of Data

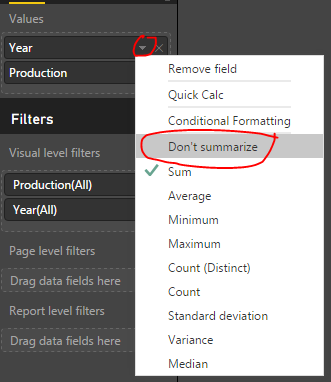
    Rather we want to see every year and the production values for each of those years.  To change this view click on the triangle in the Values section of the Visualizations pane.  This will reveal a list, in this list it shows that our numbers are aggregated by Sum change this to Don’t Summarize.

    Change to Don't Summarize
    Change to Don’t Summarize

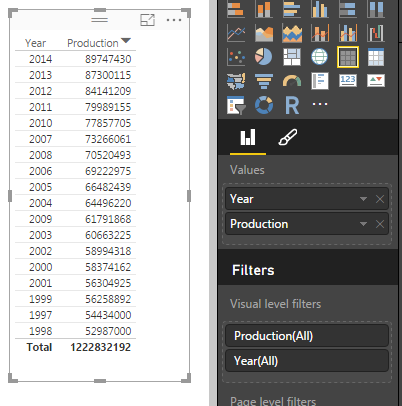
    Now we have a nice list of yearly production levels with a total production at the bottom of our table.

    Table of Production Values by Year
    Table of Production Values by Year

    Next we will build our measure using DAX to calculate the percent changes by year.  Our Calculation for % change is the following:

    % Change  =  ( New Value / Old Value ) - 1

    Below is the DAX statement we use as our measure.  Copy the below statement into a new measure.

    % Change = 
    DIVIDE(
     CALCULATE(
     SUM('Auto Production'[Production]), 
     FILTER('Auto Production','Auto Production'[Year]=MAX('Auto Production'[Year])
     )
     ), 
     CALCULATE(
     SUM('Auto Production'[Production]),
     FILTER('Auto Production','Auto Production'[Year]=MIN('Auto Production'[Year])))
    ,0) 
    - 1

    I color coded the DAX expression between the two equations to show which parts correlated.  Note we are using the DIVIDE function for division.  This is important because if we run into a case where we have a denominator = 0 then an error is returned.  Using DIVIDE allows us to return a zero instead of an error.

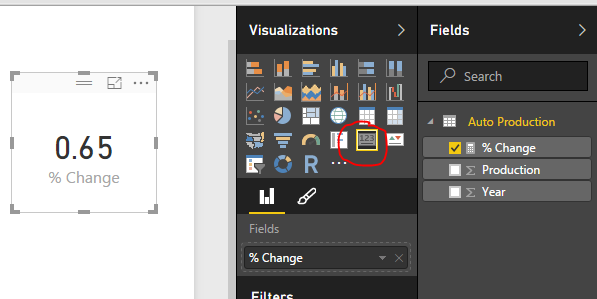
    Next add our newly created measure as a Card.

    Add Card
    Add Card

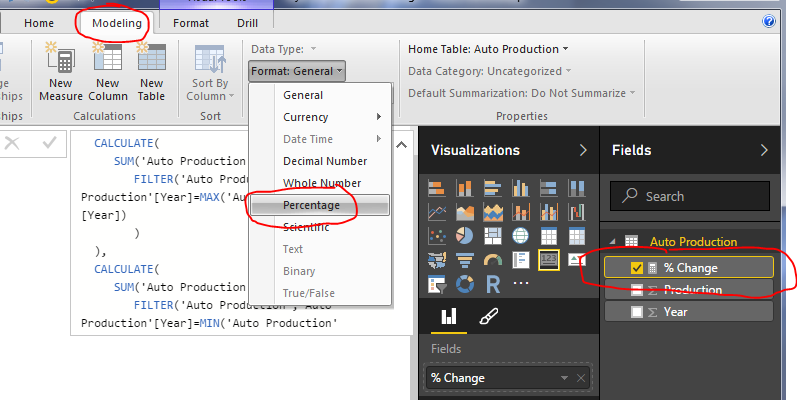
    Change the % Change measure format from General to Percentage, do this on the Modeling ribbon under Formatting.

    Change Measure Formatting
    Change Measure Formatting

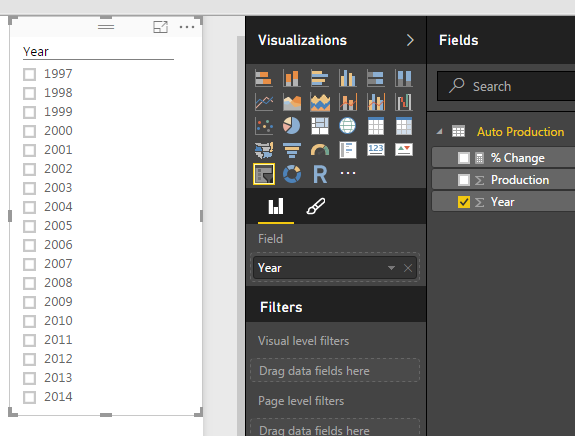
    Next add a slicer for Year. 

    Slicer for Year
    Slicer for Year

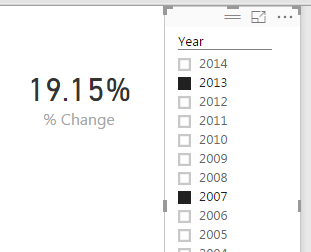
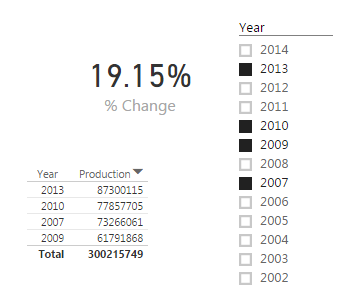
    Now you can select different year and the % change will automatically change based on our selection.  The % change will always select the smallest year’s production and the largest year’s production to calculate the % Change.   By Selecting the Year 2013 and 2007, the percent change is 19.15%.  The smallest year is 2007 and the largest is 2013.

    Selecting Two Years
    Selecting Two Years

    If we select a year between 2013 and 2007 the measure will not change.

    Multiple Years Selected
    Multiple Years Selected

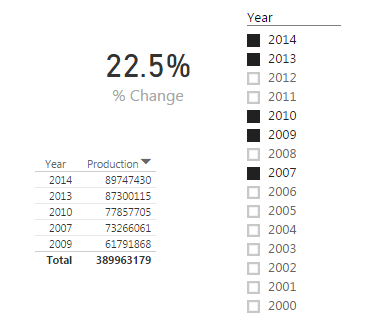
    The measure will only change when the starting and ending years are changed.  By selecting the year 2014, the measure finally changes.

    Selecting Additional Year
    Selecting Additional Year

    Pretty cool wouldn’t you say?  Thanks for taking the time to walk through another tutorial with me.

    Want to learn more about PowerBI and Using DAX.  Check out this great book from Rob Collie talking the power of DAX.  The book covers topics applicable for both PowerBI and Power Pivot inside excel.  I’ve personally read it and Rob has a great way of interjecting some fun humor while teaching you the essentials of DAX.