Previously we’ve done a tutorial on loading multiple text files within one query. This is nice, however we will also need to import multiple Excel files. First, to understand the procedure of querying multiple excel files you have to understand the basics between the CSV (comma separated values) file and an excel (.xls or .xlsx) files. In a CSV file you have only one data set. The beginning of the file starts with values and separates each file with a “,” a carriage return starts a new row of data. This is an easy and efficient way to store millions of rows of data. By contrast the excel file is way more complicated. Excel files can have multiple sheets of tables of data. Think of this as a stack of CSV type files. For example if you have an excel workbook with three sheets of data, Sheet 1, Sheet 2, Sheet 3. You can think of those three sheets as grid of data, similar to the CSV file. The multiple sheet aspects of an excel file makes the data ingestion into PowerBI a little bit more complicated. To add to the complication, when you loading data from either multiple sheets, or selecting a specific out of many sheets of data. For illustration purposes imagine working with two excel files with three sheets each, 2 x 3 = 6, a total of 6 sheets of data, or what I will call “pages” of data. This is why it is more complex to load excel files than CSV files.
Note: If you want to learn how to load multiple CSV files visit this tutorial.
Not only do you have to figure out what data you want to ingest on the page you must all tell PowerBI which sheets do you want to look at, and from which excel file. If that was to many words think of loading the following data sample:
Workbook 1 – Year 2000 Olympic Medals
- Sheet 1
- Olympic Medals Table
- Rank
- Country
- Gold
- Silver
- Bronze
- Total
- Olympic Medals Table
- Sheet 2
- Sheet 3
WorkBook 2 – Year 2004 Olympic Medals
- Sheet 1
- Olympic Medals Table
- Rank
- Country
- Gold
- Silver
- Bronze
- Total
- Olympic Medals Table
- Sheet 2
- Sheet 3
The data structure for both workbook 1 and 2 are similar but the names of the files are different and there can be multiple pages.
To resolve this we will have to write a M language function that will load each file as a function. This will be done in later in the tutorial.
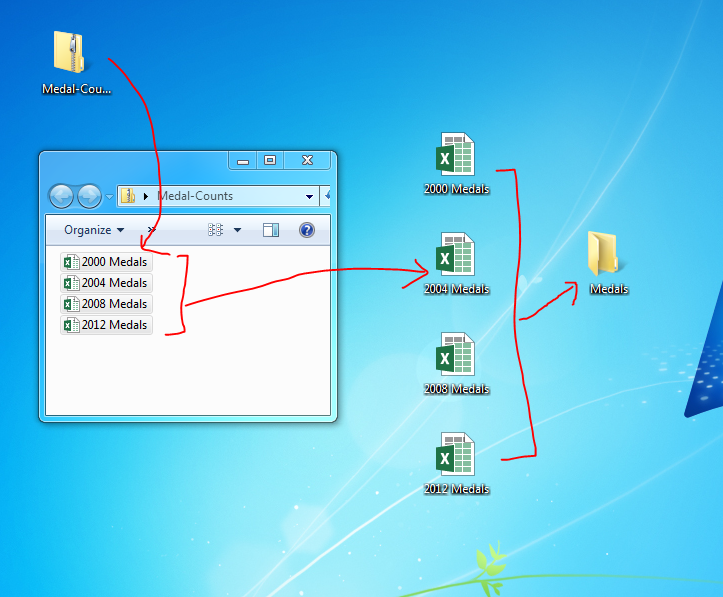
Here is the data source information for Olympic medals won by each country from 2000 to 2012, download here. Inside the Medal Count zip file are four xlsx files, extract them to your desktop. Move the files into a folder on your desktop labeled Medals.
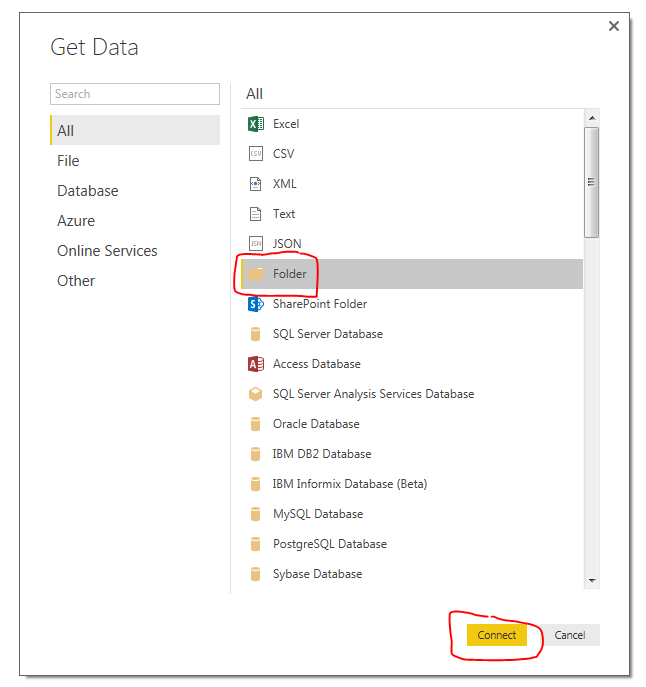
Now, open up PowerBI, We will begin shaping our data to load all the excel files. On the Home ribbon click on the Get Data button. Select Folder on the right side and click Connect.
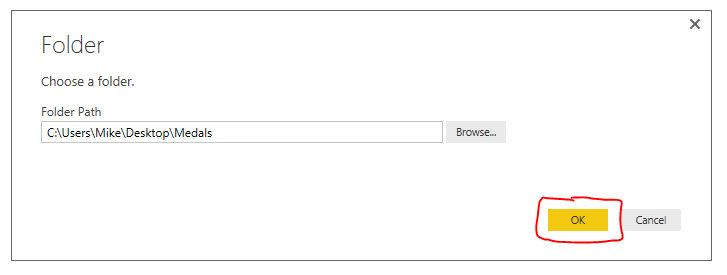
Next select the folder path that you want acquire the files from, Click OK to continue.
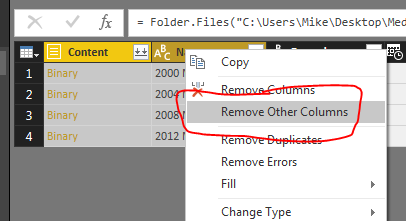
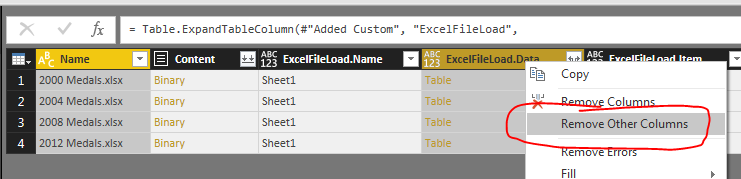
Next we are presented with the loaded files within our selected folder. Click Edit at the bottom of the screen to proceed. The Query Editor window will now open. Select the first two columns labeled Content, and Name. With those two columns selected right click on the header and select Remove Other Columns. This will remove all the useless data associated with the files.
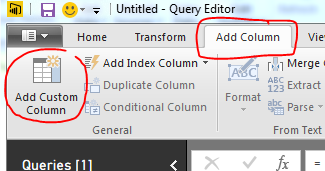
Click the Add Column ribbon and press the Add Custom Column on the left side of the ribbon.
Name the new column ExcelFileLoad and enter the following equation.
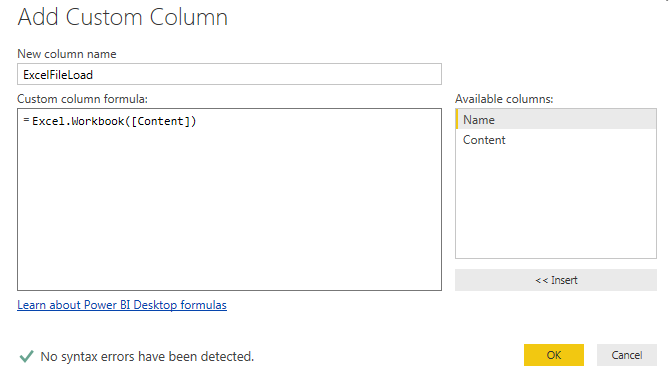
Note: Once you type “Excel.Workbook(” you can click on the column labeled Content on the right side of the screen to have the name automatically added. This is useful when you have many many columns to choose from or if there naming of those columns becomes complex. This way you won’t type in the column name incorrectly.
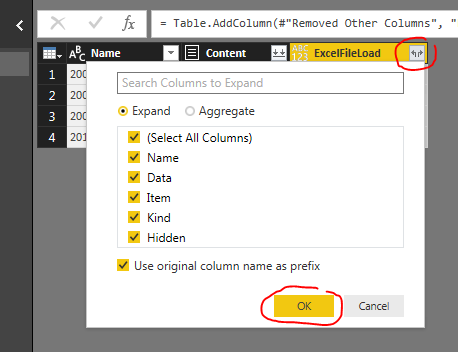
Click OK to proceed. Notice we now have a new column called ExcelFileLoad. Next click the Expand button (the one with the arrows) located at the right of our newly added column. Click OK to proceed.
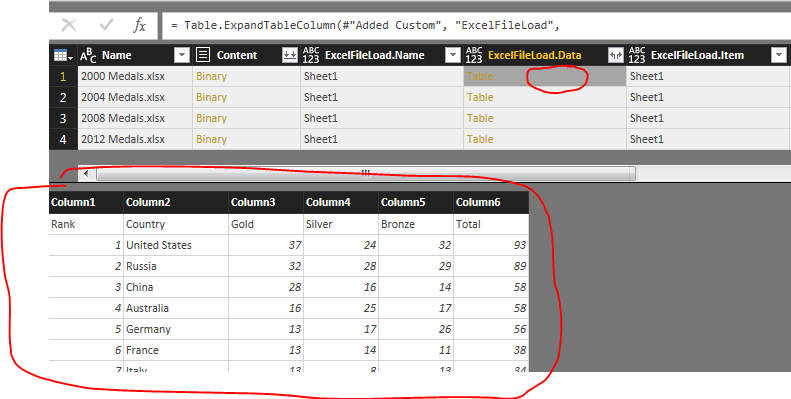
Now we have a new column labeled ExcelFileLoad.Data, which is the data contained in our excel files. Now click in the Grey Area next to the word labeled Table. This will open up the file and reveal the information present in the file. Notice that we can see the headers and the data in our file. Row 1 contains the headers of each column. Rows after row 1 contains the medal data.
Next select the columns labeled Name and ExcelFileLoad.Data and right click on the column header, then select Remove Other Columns
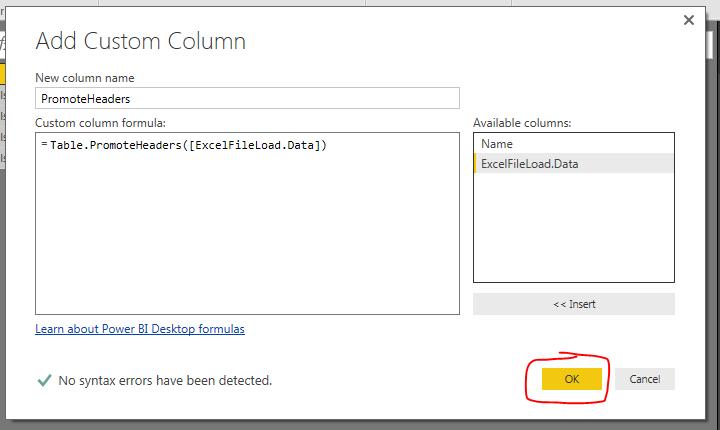
On the Add Column ribbon click Add Custom Column again. Name the column PromoteHeaders and enter the following formula. Click OK to proceed.
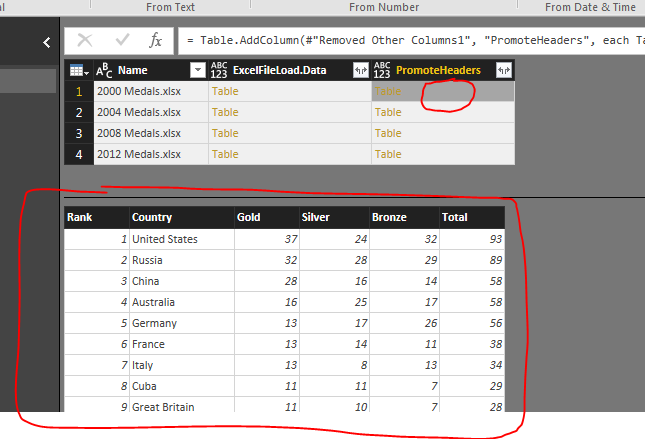
Clicking again on the grey area in our newly created column reveals our tables with promoted headers.
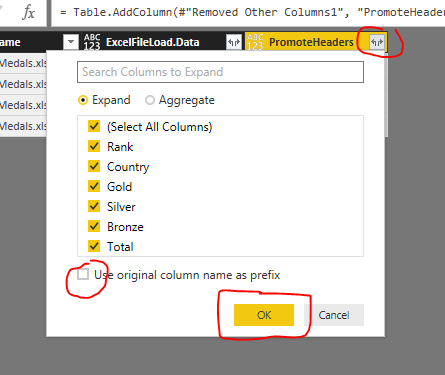
Next click the Expand Button, un-check the Use original column name as prefix and click the OK button to proceed.
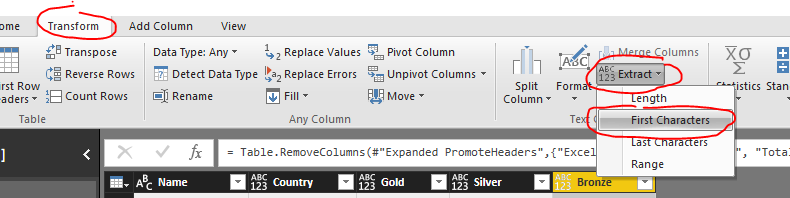
Remove the following columns, ExcelFileLoad.Data, Rank, and Total, bu right selecting the columns and right clicking on the header and selecting Remove Columns. Now we want to parse out the year name from the Name column. To do this click on Name Column. Then click the Transform ribbon and click the Extract button, then select First Characters from the drop down menu.
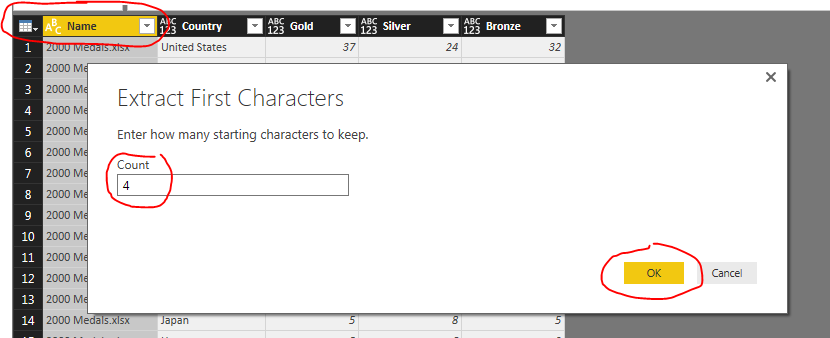
In the Extract First Characters menu enter the number 4 and click OK to proceed.
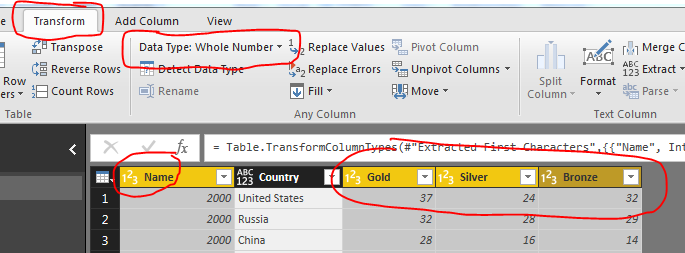
Change the following columns to whole numbers: Name, Gold, Silver, Bronze. Do this on the Transform ribbon in the Data Type drop down.
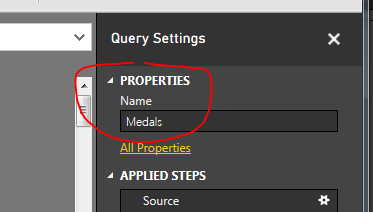
We are now ready to load all the data. Rename the Query to Medals, click the Home ribbon and select Close & Apply.
And there you have it. We have successfully loaded four excel files into one query.
Bonus: for added flare add the following measure.
Total Medal Count = sum(Medals[Gold]) + sum(Medals[Silver]) + sum(Medals[Bronze])
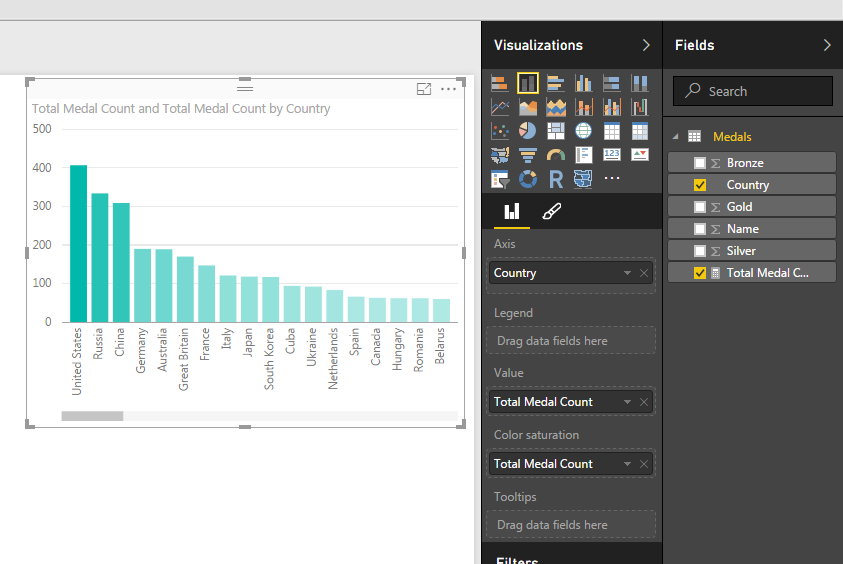
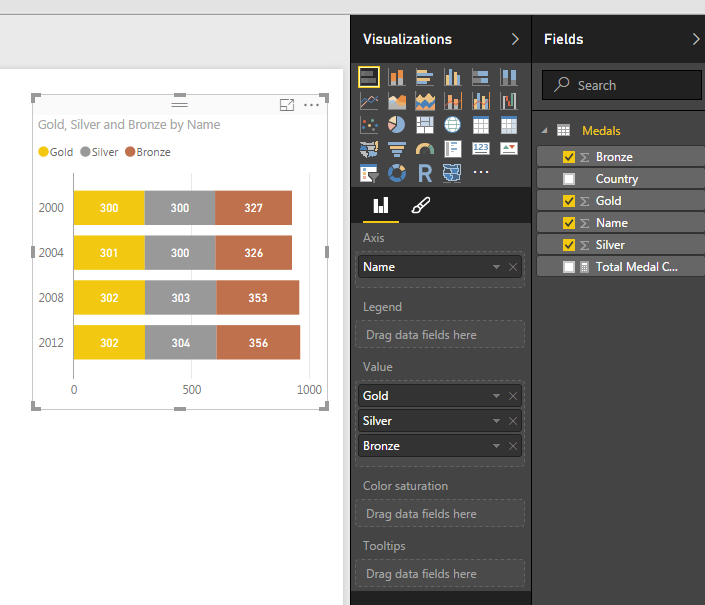
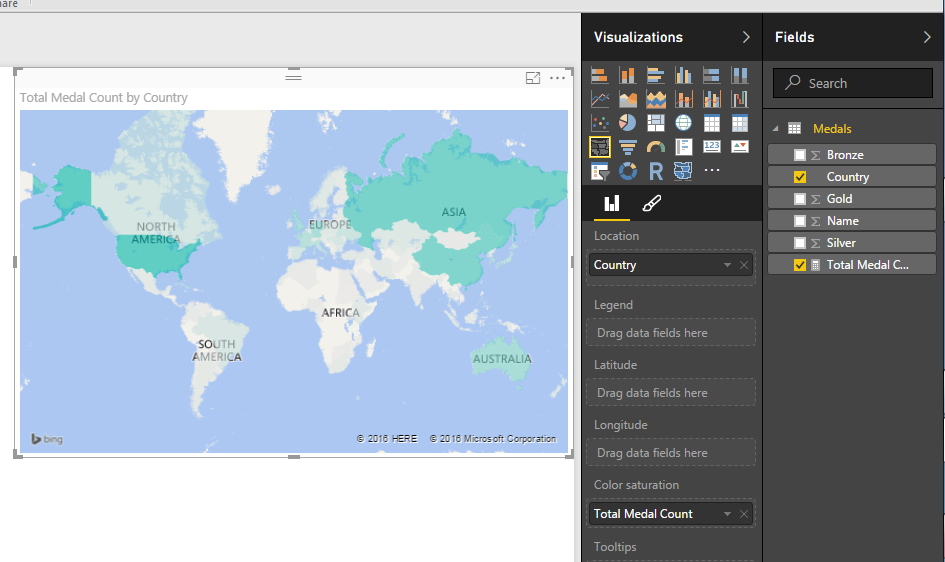
Now you can add the following Visualizations.