
For those of you who are following my tutorials, you are most likely to understand that each tutorial comes with it’s own data source. This has been intentional so we can both walk through the example and learn by doing. Whenever, I am learning new things I find it’s helpful to do two things. First, make examples and demos of what I am trying to learn. Simply reading about a tool such as PowerBI, while engaging, it isn’t how I learn. I learn by getting my hands dirty, opening up PowerBI and creating something. You have to get utterly frustrated and stumped before that light bulb pops on and things become clear. Secondly, after I’ve taken the time to learn a new feature or method I find it extremely helpful to teach someone else what I’ve learned. By doing so, I am able share in the enthusiasm of others who also are learning. Teaching others also makes you remove all the cluttered ideas away from the essential lesson.
This being said, I consume a lot of data. Always finding data sources is difficult. Often I find myself making up my own data sets which takes additional time. At least, it used to take me forever to find data. This past week I was digging around for more data sources and I stumbled upon this gem. It is the data source has been used by many a bloggers for examples. It is Adventure Works sample business database. For this tutorial we will walk through how to load the Adventure Works dataset directly in to PowerBI.
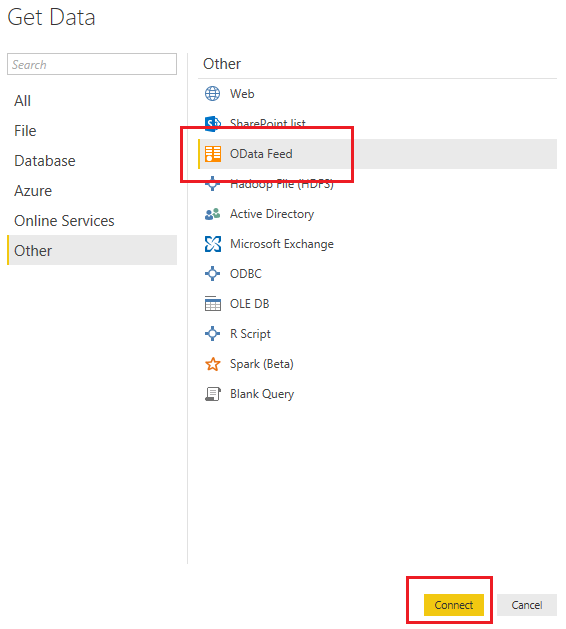
Lets begin by opening Power BI desktop. Once Power BI desktop is open on the Home ribbon click the Get Data button. The Get Data window will open and under the Other section we find an OData Feed. Select the OData Feed and then click Connect to proceed.
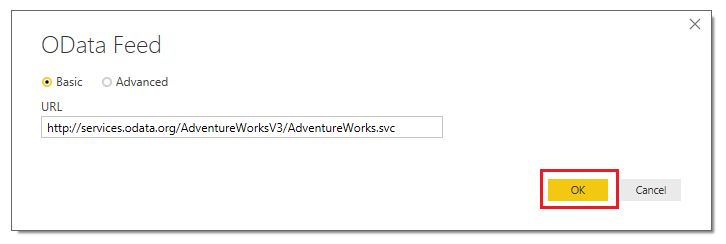
The OData Feed window will open. Enter in the following HTML address into the URL field.
http://services.odata.org/AdventureWorksV3/AdventureWorks.svc
Note: In this example we are only using the basic OData Feed connection. Power BI does allow users to build more complex OData feeds which may require multiple parameters. This functionality is included by toggling the OData Feed screen from Basic to Advanced. This would be ideal if you had an OData Feed such as http://myOdataFeed.com/{custom parameter}/OData.
Click OK to proceed
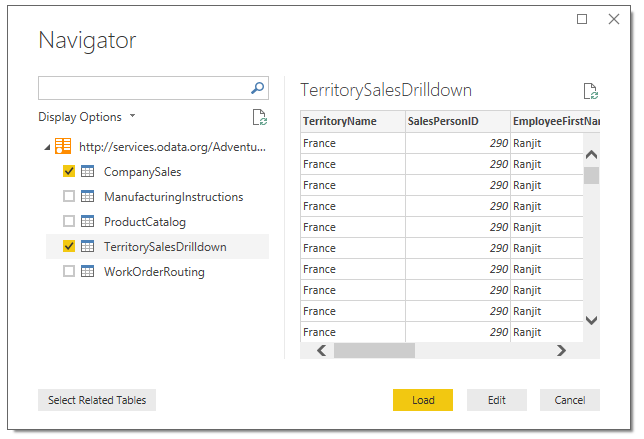
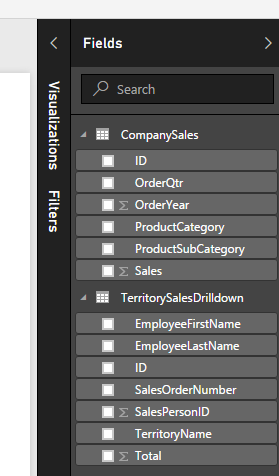
Power Bi will now go to the web address and read the OData Feed. What is returned is a list of tables. The Navigator window shows us previews of each table. Select the CompanySales and TerritorySalesDrillDown by checking the boxes next to each table. Click Load to proceed.
Ta Da!! that was easy. We were able to quickly load the two tables from the Adventure Works database. We can confirm this by looking at all the loaded fields contained in the Fields pane.
Add a couple of visuals with the following fields to pretty up our page.
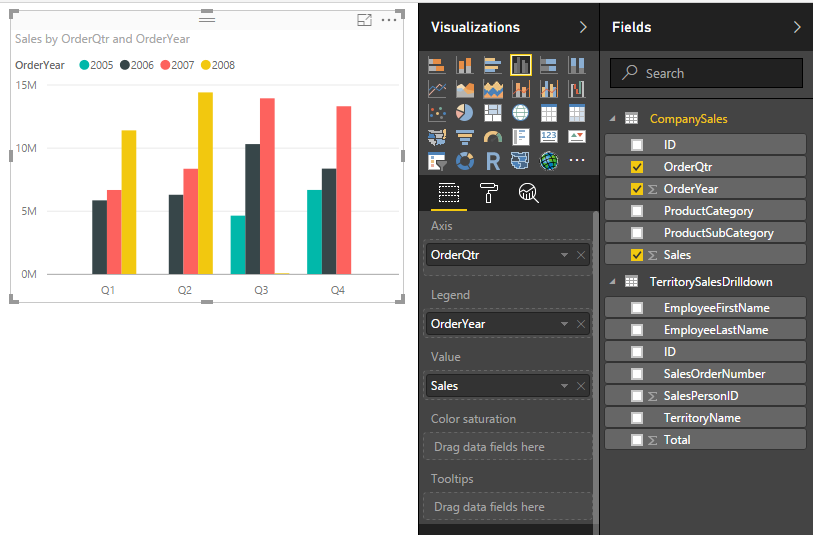
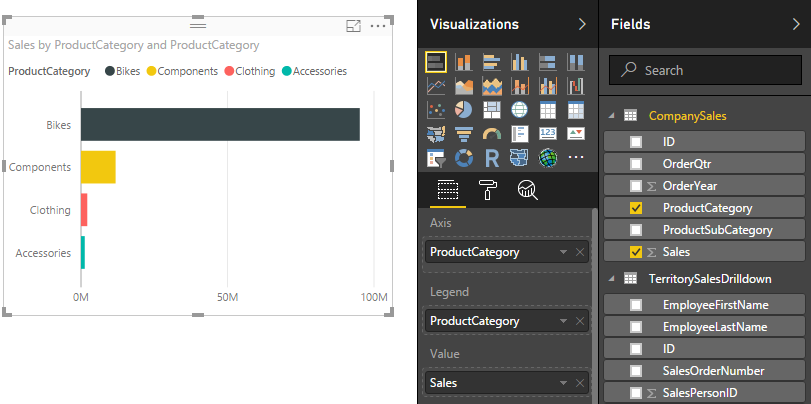
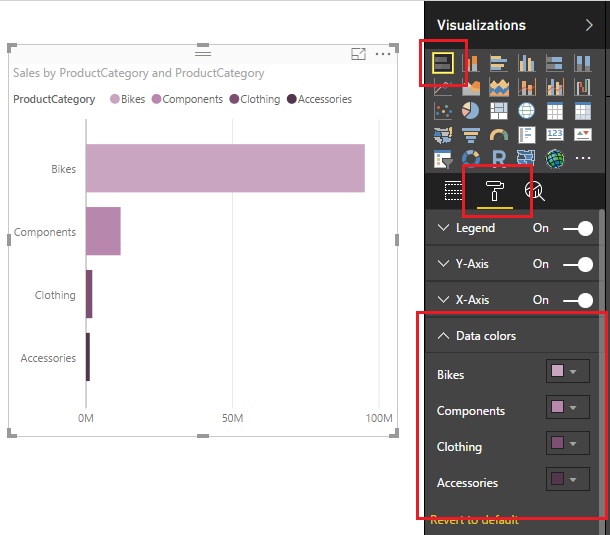
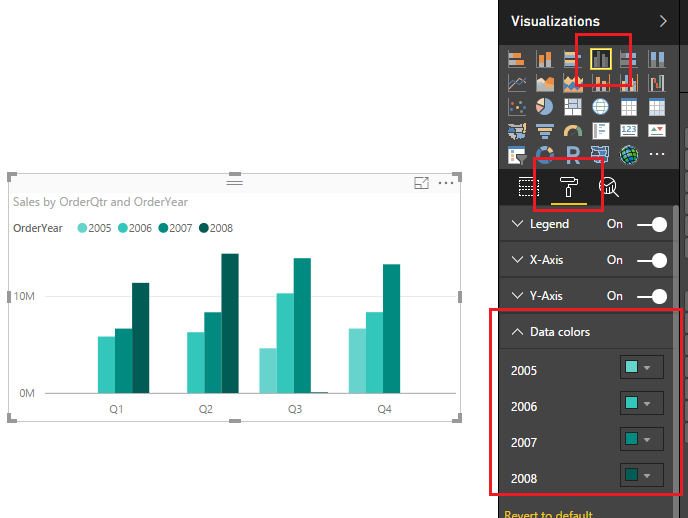
Pro Tip: notice how the two charts we added have the same color scheme but are different dimensions. The Clustered Column Chart has Years for the Colors, but the Stacked Bar Chart is using product categories. Change the colors on the Stacked Bar Chart by clicking on the Paint Roller on the Visualizations pane. Select the section called Data Colors and modify the colors for each product category.
Note: In order to sort from the largest sales amount to the smallest. Click the Ellipsis (small three dots) on the corner of the visual and select Sort by Sales. This will make the visual sort in order of sales from the highest amount to the smallest amount.
Similarly you can change the colors for the Clustered Column Chart to make the visual more appealing.
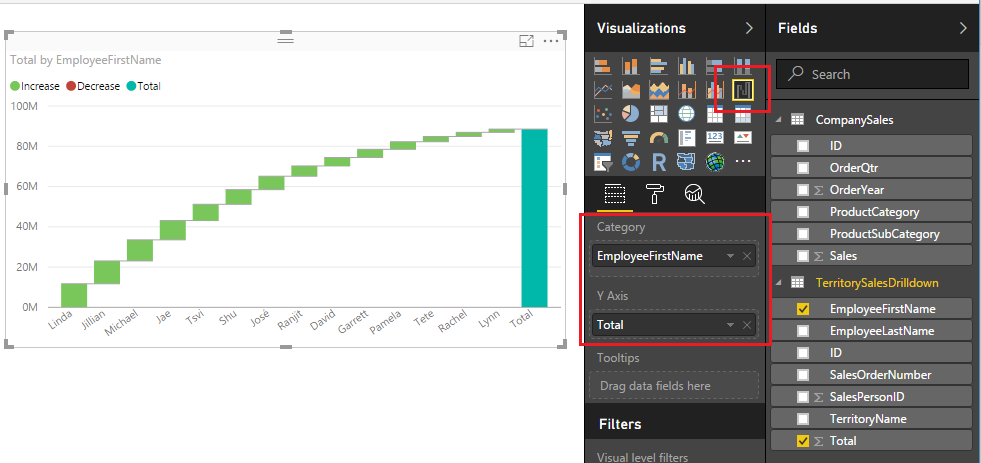
Again using the Ellipsis of the visual select Sort by Total to sort the number of sales by each employee from the largest sales amount, Linda to the smallest sales amount Lynn. Also, note that this chart is being built off the second table that we loaded from the OData Feed labeled TerritorySalesDrilldown.
Now, I believe we can say we are officially done. We have loaded data from our OData Feed and created three visuals upon that data. Thanks again for following along.
If you liked this tutorial please be sure to share. Also if you want to know more about me you can visit my About page and follow me on twitter or Linkedin for updates.