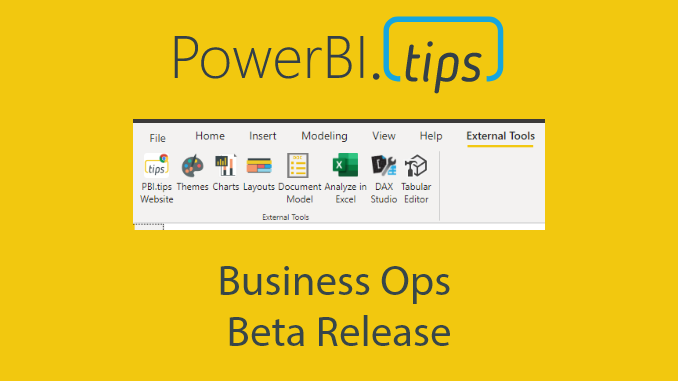
We are excited to announce a new tool from PowerBI.tips The Business Ops tool. To get this tool Download it here.
For the Full Story Read on..
There are many exciting features that we love to see and share when it comes to monthly Power BI releases! The continual improvements still inspire and provide a deeper and richer experience for us all to WOW our report consumers. There are some periodic major changes that come, and we think one of those has arrived with the latest announcement of 3rd party tool integration.
Add PowerBI.tips Front End tools
After the great news above, we had our heads down looking at the documentation and were very interested in how we could add our own tools to the External Tools section. After some digging, and reviewing a fantastic blog by Eric Svensen we locked in on how we could our tools even more accessible for you!
We want to help you get to your favorite PowerBI.tips tools quickly and easily. What follows is what each of these tools offers, and how to easily connect one or all into your Power BI Desktop files for quick connection and use.
I don’t see “External Tools”
The first requirement to see the External Tools section is that you must be on July 2020 Desktop. You will NOT see the External Tools section right after you open it. The reason for that is varied, but suffice to say, you need a specific JSON folder created in your Power BI folder structure and an executable to run.
We’ve made this easy for you, so just read through our choices of tools and we’ll walk you through how to get these buttons created and working for you in no time!
Tool Choices
PowerBI.tips – Part of staying engaged is staying current. What better way to do that then start everyday with a link to your favorite site – Power BI.Tips

Themes – Need to take the general settings you can do in the Desktop to the next level? Adding our Themes capability into your reports gives you full control over the customization of color, font and properties.

Charts – Utilizing the amazing work from MSFT research in Charticulator, we’ve created a version called Charts. This tool lets you build no code custom visuals that work right alongside the out of the box one’s. Check out our videos if this is new to you!

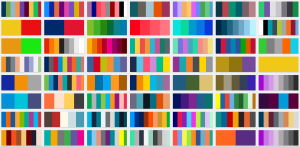
Themes Gallery – Sometimes you just need to find a little inspiration. Look no further than our extensive gallery of color themes. Easily pick and download any color theme you find.
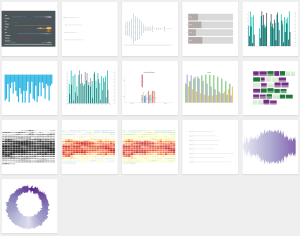
Charts Gallery – Learning how to build the custom visuals in Charts takes a little bit of time, but while you are learning that craft, or are looking for a unique visual check out the gallery of already built custom visuals you can integrate into your reports.

Layouts – Need to take your report look and feel to the next level? Our Layouts provide some of the best looking backgrounds tailored specifically to Power BI. We use pop up dialogues for contextual explanation, page navigation and hidden slicer functionality to amaze your end users.
Scrims – Backgrounds for Power BI. We take all the principles we’ve learned in visual design to create amazing visual canvases that don’t distract from the data. Using these single images reduces the need to render all the different shapes and objects on your page making it a faster/better option.
Model – Are you a data focused individual? Have you played with Power BI dataflows? Use our Model tool to create the metadata objects you want to utilize in your Common Data Model.
Connections – Streamline your report files for other report authors by pre-configuring the data source connection. Not familiar with how you create PBIDS files? Check out our tutorial.

Lingo – In 2018 Power Bi introduced the ability to edit the linguistics schema for enhancing your Q&A experience. This tool gives you a clean and simple interface to create and modify your schema.
Pick Your Browser
We know our favorites, but you probably have yours as well. Throw in a dash of IT security and you might not have the best experience with a chosen browser. As we know that is the case, you can choose one of our 3 options for kicking off these tools from the Desktop and opening the right browser.


Install Your Favorites!
Featured External tool tutorials
Want to know more about the featured tools in the MSFT blog? We had the chance to welcome the creators of those tools to tell us all about them. Be sure to check out the webinars for all the details on how to get started with them and all the capabilities they offer.
ALM Toolkit – Schema compare and deployment tool. Fantastic for Application Lifecycle Management (ALM). How to use ALM Toolkit.
DAX Studio – The only DAX authoring tool you will ever need. 5 part series that explains it all.
Tabular Editor – An amazing modeling tool that makes working with your model a breeze. 4 part series.
If you like the content from PowerBI.Tips please follow us on all the social outlets. Stay up to date on all the latest features and free tutorials. Subscribe to our YouTube Channel. Or follow us on the social channels, Twitter and LinkedIn where we will post all the announcements for new tutorials and content.
Introducing our PowerBI.tips SWAG store. Check out all the fun PowerBI.tips clothing and products:
Check out the new Merch!

