Year: 2023

  • Revolutionizing Power BI Theme Building with New AI Capabilities in Tips+

    Revolutionizing Power BI Theme Building with New AI Capabilities in Tips+

    In the dynamic world of data visualization, the PowerBI.Tips team has once again raised the bar. Today we’re introducing cutting-edge AI capabilities to simplify the Theme Building experience. We recognize the value of time in the fast-paced realm of analytics. So we’ve worked to implement innovative features designed to streamline the theme building process even more and enhance user efficiency.

    Visuals AI: A Game-Changer in Background Customization

    The PowerBI.Tips team understands that the right background sets the tone for a compelling data story. With the new “Visuals AI” button prominently placed in the top left corner of Wireframes, users can now harness the power of artificial intelligence to easily add visuals to their chosen background image. Choosing backgrounds from the Gallery makes this even easier to create visually appealing reports. This feature is a game-changer, automatically analyzing the selected page background and generating visuals that seamlessly fit into the designated spaces is an immense time saver!

    No more tedious tweaking of visual sizes, spacing, or alignment after you’ve already done that on the background. “Visuals AI” takes care of it all. Users have the freedom to experiment with different backgrounds, simply applying a background image and choosing “Visuals AI”. This automatically generates visuals on all pages, or one page at a time. Don’t like the visual? It doesn’t matter, users can easily change visuals and the sizing stays the same. This not only saves valuable time but also empowers users to focus on the creative aspect of data presentation rather than getting bogged down in the intricacies of layout adjustments.

    Streamlined Wireframe Building with Visual Layouts

    Building a report page from scratch has never been easier, users now have the option to start with just the spaced visual objects. Leveraging the meticulously aligned, spaced, and sized visual frames generated by Visuals AI is a huge time saver. This feature is a boon for those who prefer a blank canvas or wish to bypass the Gallery background, providing a quick and efficient way to kickstart the report creation process.

    Choosing this icon when on a page provides a large selection of pre-defined options.

    This eliminates the need for users to manually arrange and adjust individual elements. The result is a significant time-saving that allows users to focus on the content and insights rather than the nitty-gritty of layout design.

    Continuous Innovation for Time Savings

    The commitment to enhancing the Theme Building experience doesn’t end here. The PowerBI.Tips team is actively exploring additional ways to integrate time-saving features into the Tips+ Theme Generator. Users can look forward to future enhancements that will further elevate the efficiency and creativity of their theme building endeavors.

    Stay tuned for updates and join us on the ride as we continue to revolutionize Power BI Theme building! PowerBI.Tips will continue to push the boundaries of what’s possible with the latest advancements in artificial intelligence.

  • Designer: Use any Scrim from the Gallery when Building Wireframes

    Designer: Use any Scrim from the Gallery when Building Wireframes

    The Power BI Tips Theme Generator: Your Ultimate Theming Tool

    The Power BI Tips Theme Generator is the go-to resource for users aiming to create consistent looking Power BI reports and dashboards with minimal effort. It simplifies Theme building, even for those who lack a strong background in design or coding. It empowers any user to create stunning and consistent looking reports with ease.

    The Gallery Integration into Wireframes for Scrims is a feature designed to streamline the theme building process even further. It is particularly valuable for users who have invested time and effort in crafting their own themes. This feature brings the power of the Gallery background images (Scrims) into the Wireframes section. This allows users to access all the projects available in the Gallery! User can then select any, or all, of the background images to apply to their pages.

    Simplified Background and Page Creation

    The true magic of the Gallery Integration lies in its ability to simplify the creation of backgrounds and pages for your Power BI reports. Here’s how it works:

    1. Explore the Gallery: Start by browsing through the Gallery projects in the fly out. Each Gallery project offers unique backgrounds (Scrims).
    2. Select Your Desired Gallery Project: When you find a project that resonates with your vision, simply click on it.
    3. Add Background Images to My Scrims: From within the selected Gallery project, you can pull background images into My Scrims by selecting “Copy to My Scrims”.

    4. Effortless Application: With your background images in My Scrims, applying them to your reports is a breeze. You can choose to apply one image or add all the scrims by selecting the magic icon.

    It all depends on your design preferences.

    5. Automatic Page Creation: The Power BI Tips Theme Generator does the heavy lifting for you. When you apply the background images, it automatically creates the background pages for your report.

    The Power of Streamlined Theme Building

    The Gallery Integration in Wireframes for Scrims in the Power BI Tips Theme Generator is another unique feature built to empower you. You can effortlessly enhance your Theme projects with fresh backgrounds, ultimately saving you time and streamlining your Theme building process.

    Whether you’re a seasoned Power BI user or a newcomer to the world of data visualization, this feature offers a user-friendly, efficient solution for creating visually appealing Wireframes for your reports. The Gallery Integration combines the creative power of the Gallery into the Wireframe building process.

    So, if you’re ready to take your Power BI reports to the next level, check out this new feature in the Wireframes area. Streamline your design process, and create a visual narrative that speaks to your audience. Happy Theming!

  • Unlock Effortless Power BI Theming with the New Gallery Feature

    Unlock Effortless Power BI Theming with the New Gallery Feature

    The Power BI Tips Theme Generator tool already allows you to easily interact with, and adjust, all the visual properties, wireframes, etc… How could we possibly make Power BI Theme building an effortless experience? We start with building it all for you, then letting you adjust it!
    The all new Gallery feature represents a significant leap forward in simplifying the theming process for all. This feature is especially for the business users! But, it also opens up exciting opportunities for the Power BI community to contribute in the future as well.

    With the introduction of the Gallery feature, the Tips Theme Generator has reached a new pinnacle of usability and accessibility. This feature combines all the technology and expertise that has made the Tips Theme Generator the best in the business. The primary aim of this feature is to cater to business users who might not have the time, inclination, or design expertise to build their themes from scratch.

    The Gallery feature simplifies theming to the point where you don’t need to be a design expert to make your reports look fantastic. It offers a curated selection of the best themes, ready for you to use. The process is as easy as browsing through the Gallery, picking your favorite masterpiece, and applying it to your Power BI reports.

    Browse

    Preview

    Download
    With Tips+ you can save a copy to your Files, customize it, and use it indefinitely as your own!

    Benefits for Business Users

    • Time Savings: Business users can now skip the intricate theming process, saving valuable time that can be better spent on data analysis and decision-making.
    • Professional Results: Even without design skills, business users can achieve professional-quality themes that make their reports stand out.

    Empowering the Power BI Community

    The Gallery feature not only benefits business users but also opens doors for future contributors within the Power BI community. Our goal is to have experts and enthusiasts have a platform to showcase their visualization skills and offer their projects to a wider audience. This collaborative approach fosters a sense of community and support among Power BI users. If you are interested in being part of the Power BI Tips Gallery contributor program please fill out this form.

    To access the Gallery feature, simply visit the Power BI Tips Theme Generator and navigate to the Gallery section. Browse through the projects, preview them, download the .pbip project file and apply your data effortlessly. It’s as simple as that. (The number of Themes to choose from will just continue to expand and grow).

    Wrapping Up

    The Gallery feature in the Power BI Tips Theme Generator is a game-changer for business users and the Power BI community alike. It simplifies theming to an unprecedented level, empowering users to create stunning reports with minimal effort, while still maintaining the ability to fully customize them. At the same time, we invite experts from the community to contribute and share their theming expertise with us. This is an exciting step forward in the world of Power BI theming, and we can’t wait to see the incredible reports that will result from it. Happy theming!

    Check out our Introduction Video for a Quick Demo!

  • Transforming Power BI Customization: Wire Frames in PowerBI.Tips Designer

    Transforming Power BI Customization: Wire Frames in PowerBI.Tips Designer

    Introducing the New PowerBI.Tips WireFrames Feature

    In the dynamic landscape of data visualization, staying ahead of the curve is crucial. That’s why we’re thrilled to introduce the latest game-changing feature in the PowerBI.Tips Theme Generator: WireFrames! This innovation not only revolutionizes the way Power BI is customized but also opens doors for UI/UX teams and designers to interact with Power BI developers like never before.

    Unveiling WireFrames: Building the Future of Power BI Customization

    The PowerBI.Tips Theme Generator has always been synonymous with empowering users to create re-usable and tailor-made themes effortlessly. With the new WireFrames feature, we’re taking customization to an entirely new dimension. This feature is a dream come true for UI/UX teams and designers who want to streamline their workflow and create plug-and-play Power BI files. This takes the best of all the ideas behind PowerBI.Tips Scrims and Layouts and brings it all together into the Themes Generator!

    A Seamless Workflow: From Themes to Complete Visualizations

    Imagine a seamless workflow where you can not only create and apply a theme but also design the entire visualization layout – all in one go! With the WireFrames feature, you can choose a background, add visuals to it, customize the aesthetics, and download everything at once. This holistic approach transforms how Power BI files are designed, bridging the gap between design and data seamlessly.

    Exclusive Video Tutorial: Guiding You Through the Process

    To ensure you make the most of this groundbreaking feature, we’ve prepared this video tutorial. It walks you through every step of using WireFrames in the PowerBI.Tips Theme Generator. This tutorial showcases the simplicity and efficiency of the process, giving you a firsthand look at how you can elevate your Power BI customization game.

    Setting New Standards: Unparalleled Capabilities

    One of the most remarkable aspects of the PowerBI.Tips Theme Generator is that it remains unrivaled in the market. There simply are no other tools that offer the comprehensive range of features and capabilities that our platform does. The addition of WireFrames to the Theme Generator shows how dedicated we are to pushing the boundaries of what Power BI customization can be.

    Unlock the Full Potential with a Subscription

    In the ever-evolving world of data-driven insights, the PowerBI.Tips Theme Generator is a foundation for a successful visual outcome. Elevate your data visualizations, streamline your design process, and create truly impactful reports and dashboards that resonate with your audience. Embrace the future of Power BI customization today use the Theme Generator!

    Ready to take your Power BI experience to the next level? With a Tips+ subscription to the Theme Generator, you gain access to the full suite of Theme Generator capabilities.

    #PowerBI #DataVisualization #ThemeGenerator #UIUX #Design #PowerBItips #WireFrames

  • Unlock Your Creativity with the Power BI Tips Designer: Exciting New Features!

    Unlock Your Creativity with the Power BI Tips Designer: Exciting New Features!

    At Power BI Tips, we’re committed to providing you with the best tools and resources to enhance your report building experience. That’s why we’re thrilled to announce a range of exciting new features to the Power BI Tips Theme Generator! With these new additions, we’re taking theme customization to a whole new level and empowering you to create consistent, visually stunning reports and dashboards like never before.

    Introducing the Color Wheel:

    We understand that choosing the perfect colors for your visualizations can be a challenging task. That’s why we’ve integrated a brand-new color wheel into the Theme Generator. Now, you can effortlessly explore an extensive range of colors and find the perfect palette that aligns with your brand or design preferences. The Color Wheel feature makes it easy to experiment with different color combinations, ensuring your visualizations are visually striking and impactful.

    Enhanced Gradient Selections:

    Gradients add depth and visual interest to your reports and dashboards. With our enhanced gradient selections, you can now choose from a wide array of gradient styles to create eye-catching visualizations. Whether you prefer subtle transitions or bold color shifts, the Power BI Tips Theme Generator has you covered. Unleash your creativity and elevate your designs with stunning gradient effects.

    Customizable Icons:

    Icons are an essential element of any table or matrix, providing visual cues and enhancing the overall user experience. Now, with the Power BI Tips Theme Generator, you can not only choose from a vast library of icons but also customize their colors to match your theme perfectly. Seamlessly integrate icons into your visualizations and make them more engaging and intuitive for your audience. Build fully customized experiences with over 8,000 icons to choose from.

    Upload and Apply Theme Files:

    We’ve listened to your feedback, and we’re excited to introduce the ability to upload and apply theme files within the Power BI Tips Theme Generator. If you have existing theme files or want to try out themes created by others, simply upload them and see the magic unfold. This feature allows for seamless collaboration, sharing of themes, and easy updates saving you valuable time and effort. Themes are easily uploaded and validated against the new Microsoft specifications. Issues and code bugs are highlighted by row and easily discoverable in the Code Editor.

    Introducing the Code Editor:

    Advanced users and developers are going to be thrilled with the new Code Editor feature. With this powerful tool, you can now dive deep into the code behind your themes and make intricate customizations. This level of control gives you the flexibility to fine-tune every aspect of your theme and create truly unique and tailored designs.

    Unlock the Full Potential with Tips+ Themes Subscription:

    Some of these exciting new features are only available by signing up for the Tips+ Themes subscription. With this subscription, you gain access to the entire suite of advanced features. This includes access to all Customizable Icons, Upload and Verify Theme Files, and the Code Editor. The Themes Generator is designed to supercharge your creativity and streamline your theme creation process. Elevate your reports, captivate your audience, and have confidence that all your reports will look amazing.

    Buy some fun Swag

  • Does a Power BI developer need Python?

    Does a Power BI developer need Python?

    In this episode of the Explicit Measures Podcast, we discuss the values of adding Python knowledge. It is well known that more organizations are moving to cloud platforms. Because of this, we should ask the following questions:

    • What will be the needed skills for Power BI professionals?
    • Is this for the Business or for a Data Engineer?

    We invite you to jump in and listen to the podcast as we discuss these topics. Enjoy!

    YouTube Explicit Measures Podcast

    Listen on the go

    Don’t want to watch the video, no problem we are on all major podcast platforms.
    Spotify
    Apple Podcasts
    iHeart Radio

    Ask Chat GPT

    As in all our episodes we like to end with what does chat GPT say. Thus, our question for this episode is

    Should I learn Python for Power BI development?

    Chat GPT response

    The response was quite interesting, discussing the various factors as to why Python is valuable. Overall, we gave chat GPT a better than average score of about 6.5 out of 7.

    Learning Python can be beneficial for Power BI development. Python is a versatile programming language that is widely used in data analysis, data manipulation, and data visualization tasks. Power BI has its own built-in capabilities for data processing and visualization. Python can extend its functionality and provide additional flexibility.

    Here are a few reasons why learning Python for Power BI development can be advantageous:

    Data Manipulation

    Python has a rich ecosystem of libraries such as Pandas, NumPy, and scikit-learn. These libraries are excellent for data manipulation, cleaning, and transformation. Use Python to preprocess and shape your data before loading it into Power BI.

    Advanced Analytics

    Python offers a range of libraries for advanced analytics and machine learning, such as TensorFlow, Keras, and PyTorch. Integrating Python code into Power BI, you can leverage these libraries to perform complex calculations. Additional features could include predictive modeling, or create custom machine learning models to enhance your data analysis capabilities.

    Custom Visualizations

    Power BI provides a variety of built-in visualizations. But, if you have specific visualization requirements or want to create custom charts. Python can be a powerful tool for visual development. Libraries like Matplotlib and Seaborn offer extensive options for data visualization. Enabling you to generate interactive and customized charts and graphs to present your insights effectively.

    Automation and Integration

    Python can help automate repetitive tasks and streamline your Power BI workflows. You can write Python scripts to extract data from different sources, transform it, and load it into Power BI automatically. Python’s integration capabilities enables connections with other tools and platforms, such as web APIs, databases, or cloud services. Python expands the scope of your data analysis.

    Community Support

    Python has a large and active community, with abundant resources, tutorials, and forums available. Learning Python can provide you with access to a wealth of knowledge and expertise. A Large community makes it easier to find solutions to specific challenges.

    In conclusion, while it is not necessary to learn Python for Power BI development. It can certainly enhance your capabilities and offer more flexibility in data manipulation, advanced analytics, custom visualizations, and automation. Consider your specific requirements and goals for a project. Your project requirements may determine whether investing time in learning Python would be beneficial.

    Chat GPT – May 12 Version

    Not bad Chat GPT. I would disagree with a couple points made on how easy it is to integrate python into Power BI. Two options I am aware of today using Python in Power Query.

    Option 1 – Using Python in Power Query

    Using Python in Power Query from Microsoft Learn

    Option 2 – Using Python for Visuals

    Using Python to develop a Visual

    I feel that more of python is used in cloud services. This was a major point brought by Seth in the podcast. Very valid point.

    Overall, we hope you enjoyed the podcast! See you next time.

    Buy some fun Swag

  • PowerBI Tips Theme Generator: The Ultimate Tool for Creating Complex Themes

    PowerBI Tips Theme Generator: The Ultimate Tool for Creating Complex Themes

    Power BI is a powerful business intelligence tool that helps organizations to gain insights into their data. With its ability to create stunning visualizations, it’s no wonder that it’s become a popular tool among businesses. However, creating the perfect visualization requires more than just dragging and dropping data points onto a canvas. It requires a good understanding of design principles and a keen eye for detail. The time it takes to create a visual can be drastically reduced if a Theme is used.

    Themes make it so that all that time you spend tweaking colors, fonts and properties becomes a standard file template. That theme file template can get re-used over and over in all your reports saving an immense amount of time. The only roadblock to creating a theme, is that it is a complex developer level driven task. It requires a creator to understand how to properly construct a complex JSON file.

    PowerBI Tips Theme Generator Updates

    That’s where the Power BI Tips Theme Generator comes in. This powerful tool has simplified the process of creating complex theme files. It provides an intuitive user interface that makes it easy to customize every aspect of your visualizations all at once. The tool remains free! However, included with our latest update, users can now save their theme files via a subscription service! This is the only tool on the market that solves all these critical needs for you and lets you easily access and modify them. Whether you’re creating reports, dashboards, or scorecards, this tool has everything you need to create the perfect visual theme file template.

    The Power BI Tips Theme Generator now supports all the properties found in the new Microsoft schema. Moreover, it also ensures that the theme file aligns to the new validation rules. In February 2023, Microsoft released a new version of Themes validation. They understood the complexity of creating files, and this change ensures that the files uploaded match exactly to their specifications. However, this caused quite a few problems for users that didn’t have valid files (see video below). This validation is great for the Power BI, except that it creates a bigger hurdle for users. Everyone wants the benefit of Themes, without the challenge of having to create one.

    (UPDATE!): Be sure to check out all the additional features we’ve included (Upload existing files, Code Editor, Icons & more! New Theme Generator Updates

    Why You Should Use the PowerBI Tips Theme Generator

    One of the biggest benefits of the PowerBI Tips Theme Generator is its ability to simplify the user experience. By providing a comprehensive tool that creates theme files automatically, users can focus on what they do best – analyzing data. With its intuitive interface and powerful features, the PowerBI Tips Theme Generator has become a must-have tool for any business that wants to create stunning visualizations consistently without spending countless hours tweaking every detail every single time.

    If you’re looking for a powerful tool to help you create the perfect visualization theme file, the PowerBI Tips Theme Generator is the only tool you need. With its comprehensive feature set, intuitive user interface, and ability to save theme files via subscription service, it’s the ultimate tool for businesses and users that want to create stunning visualizations with ease. So why wait? Try the PowerBI Tips Theme Generator today and take your visualizations to the next level!

    Here is how you can get started!

    Sign Up

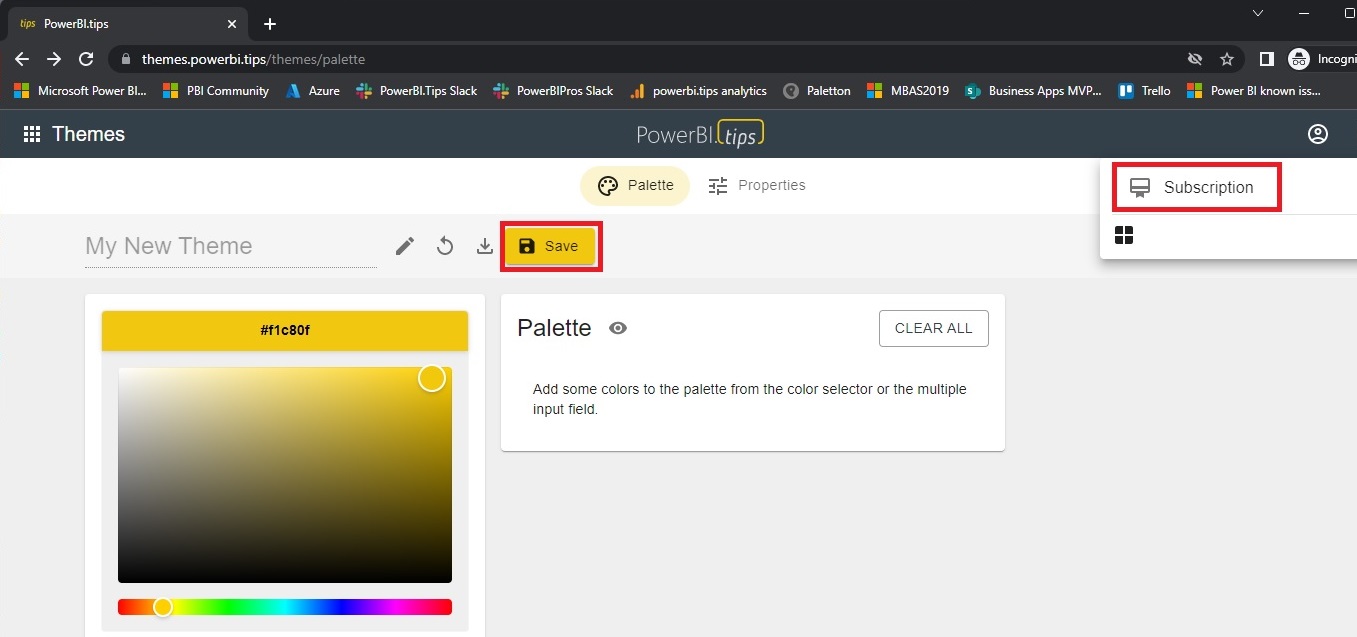
    Click on Save Or Subscribe

    Choose your level

    Full walkthrough of the additional subscription features!

    Explicit Measures Podcast on the importance of Power BI Themes!

    If you like the content from PowerBI.Tips please follow us on all the social outlets. Stay up to date on all the latest features and free tutorials.  Subscribe to our YouTube Channel.  Or follow us on the social channels, Twitter and LinkedIn where we will post all the announcements for new tutorials and content.

    Introducing our PowerBI.tips SWAG store. Check out all the fun PowerBI.tips clothing and products:

    Check out the new Merch!

    Hasta La Vista Data
    Go Ahead Make My Data
    PBIX Hat