Welcome to today’s tutorial where we’ll explore the Power BI Tips+ Theme Generator and its incredible features designed to streamline your Power BI report building experience. In this walkthrough, we’ll guide you through the process of getting started with the Power BI Tips+ Gallery, focusing on the Sunset theme. By the end of this tutorial, you’ll be able to effortlessly integrate our pre-configured Gallery Projects into your Power BI reports. It doesn’t get easier than this!
If you prefer to follow along via video, you can check out the full walkthrough on the PowerBI.tips YouTube video here:
Accessing Power BI Tips+ Gallery
Step 1: To begin, head over to powerbi.tips and navigate to Tools > “Themes New” section. Select the “Gallery” and you will notice the collection of Gallery Projects (A Gallery Project is comprised of a background, theme, and Power BI visuals all in one package). Highlight the Sunset theme for today’s demonstration, and select the “download .pbip Project”

This file includes everything you need to create or alter your Power BI report visual aesthetics. After the download is complete, extract all files to your directory of choice.
Extract & Open the Project in Power BI Desktop
Step 2: Open the .pbip File by double-clicking on it. This will automatically launch Power BI Desktop! Ready to start working on adding data to your report?
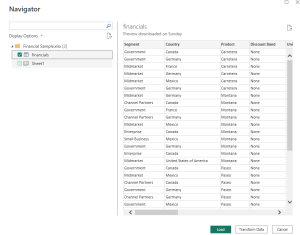
Step 3: Load Data in Power BI Desktop. For this tutorial, we’ll use the financials dataset. Simply click on the desired dataset and load it into the report.


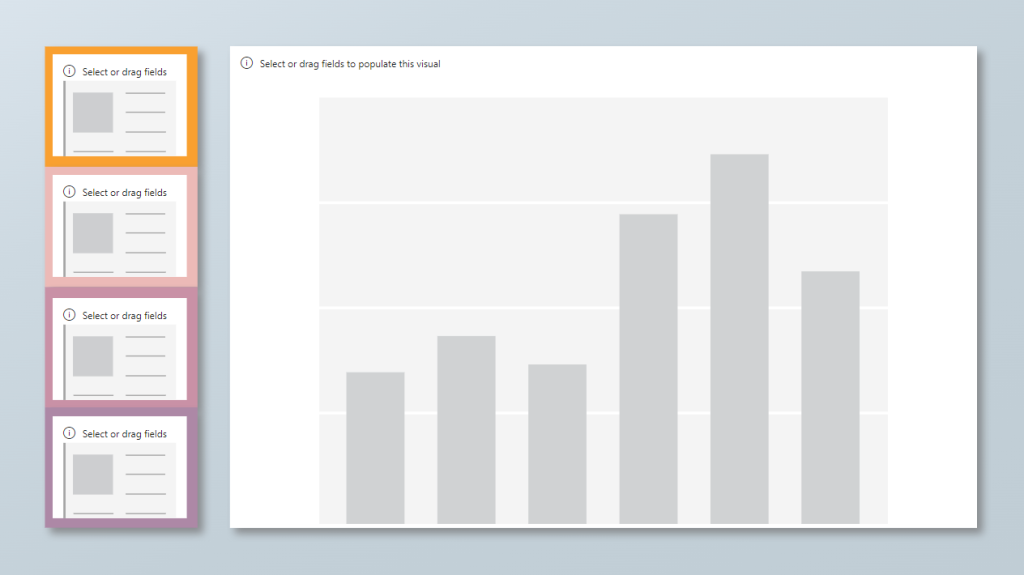
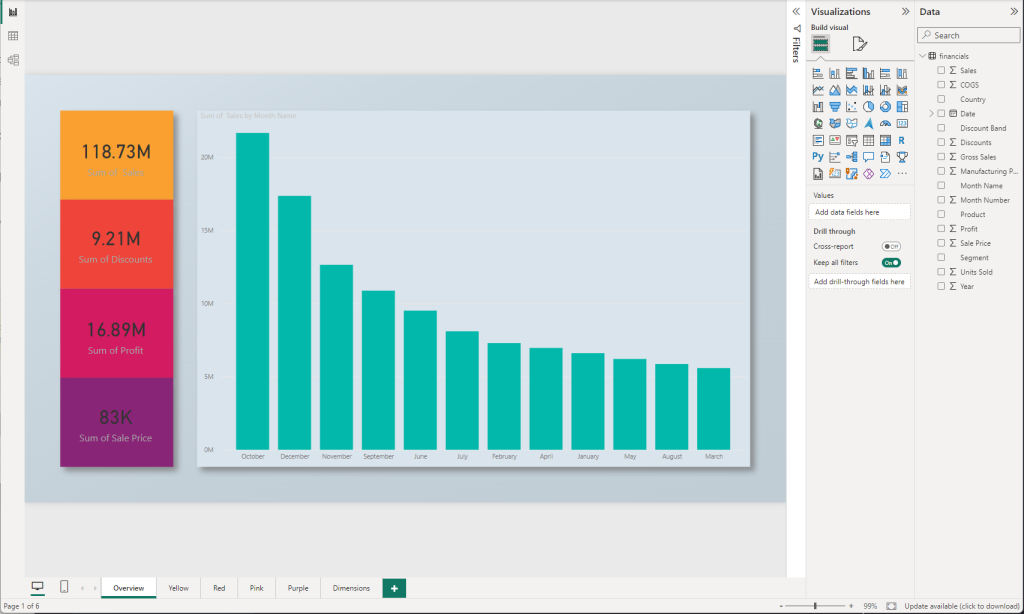
Once we have the data loaded we can navigate to any of the pages. You will see that you already have a pre-configured background, visuals on the page, and a theme of colors that were created using the Tips+ Theme Generator!

Apply Your Data
Step 4: The report consists of overview tabs in yellow, red, pink, and purple, along with a dimensions tab. You can easily remove the initial description page to focus on your data. Because you already have visualizations aligned and on the report canvas, all you need to do is select the visual and click on the columns you want to add!

Step 5: If a specific visualization doesn’t suit your needs, feel free to change its type as these are the standard Power BI visualizations. If something doesn’t align directly to your expectations, you can always adjust the properties, or change the theme itself in the Tips+ Theme Generator! We’ll walk through how to customize these pre-configured packages in our next tutorial. “Gallery – Customized Projects”
Conclusion
Congratulations! You’ve successfully integrated pre-configured Tips+ Gallery Project into your Power BI report using the Power BI Tips+ Theme Generator Gallery. This powerful tool simplifies the report-building process, saving you time and effort. Explore all the features available in the Tips+ Theme Generator to enhance the visual appeal of your reports effortlessly. Stay tuned for more tips and features in our upcoming tutorials. Happy reporting!

