
Introduction
Welcome to today’s tutorial where we dive into the powerful capabilities of the Power BI Tips+ Theme Generator. In this post, we won’t just download a project from the Gallery; instead, we’ll guide you through the process of copying and editing a project file using the Power BI Tips+ Theme Generator. Today, we’ll focus on the Framed Orange theme to showcase the flexibility and customization options available.
If you prefer to follow along via video, you can check out the full walkthrough on the PowerBI.tips YouTube video here:
Step 1: Copy and Edit Project File
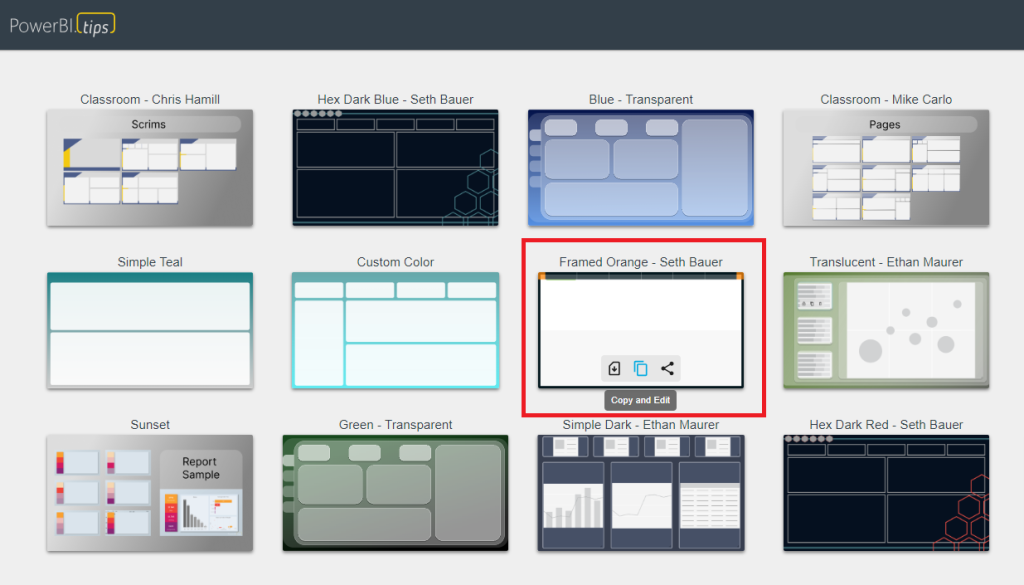
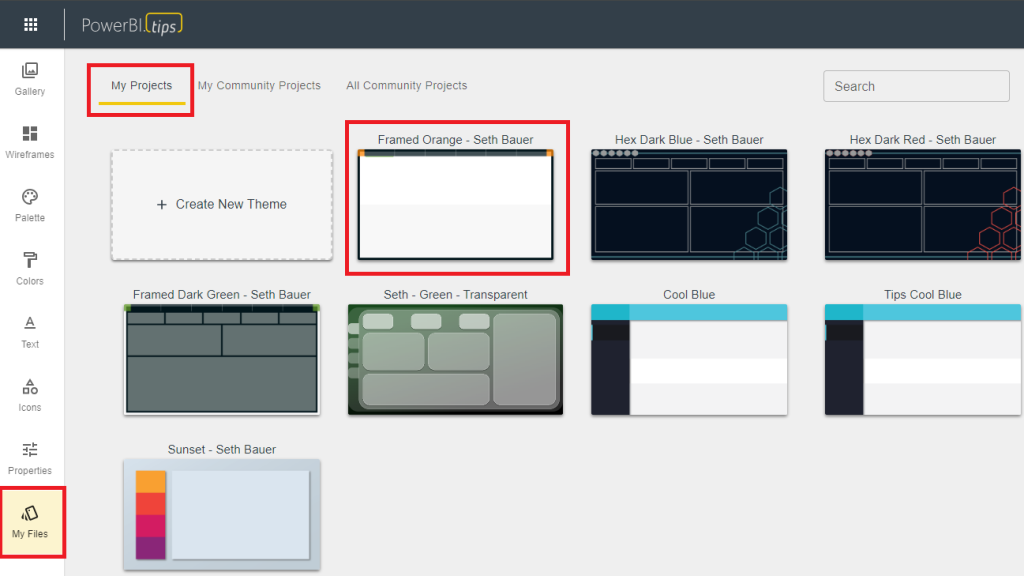
Start by selecting the Framed Orange theme in the Power BI Tips+ Gallery. Click on “Copy and Edit” to open the project file. The Gallery project will open this project in your workspace and show you all the pages and visualizations in the Wireframe area.
Step 2: Customizing Project
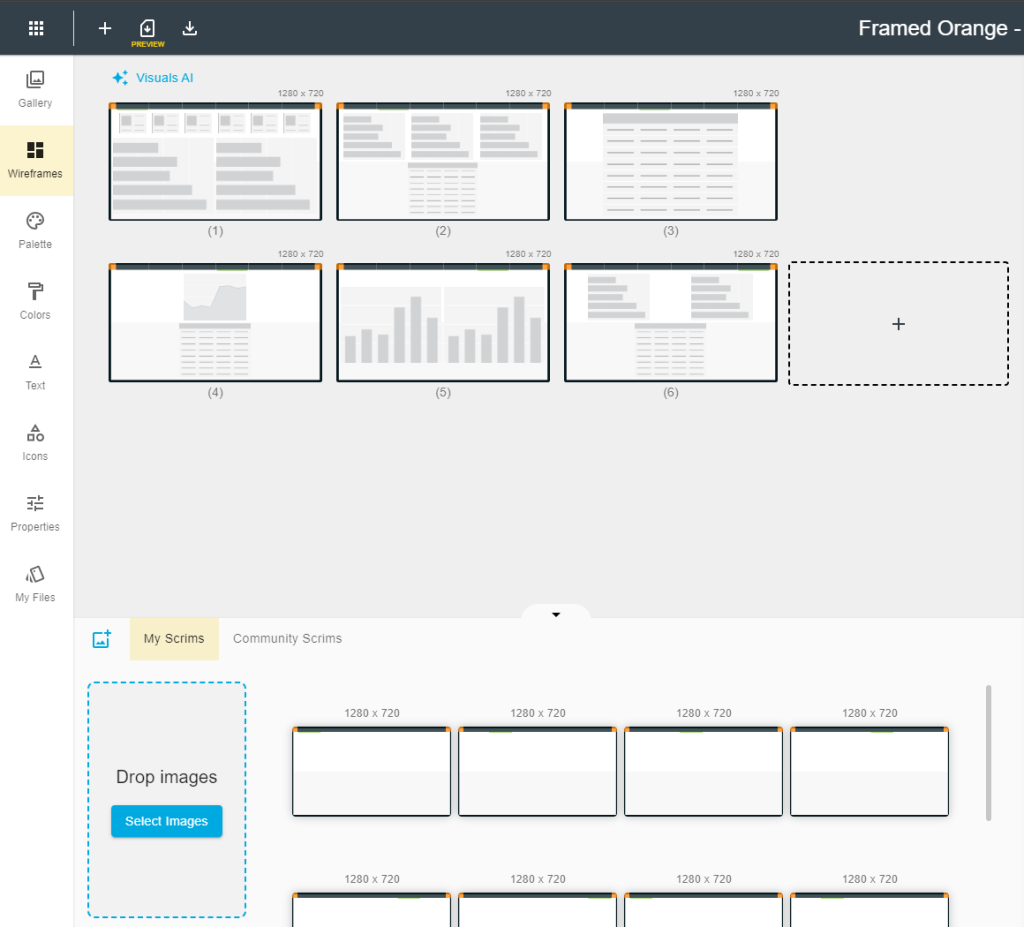
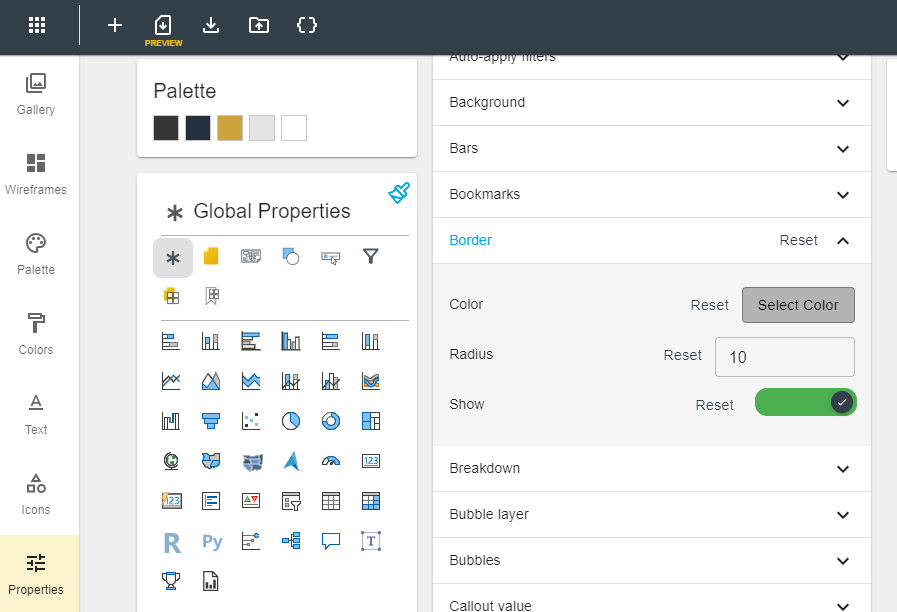
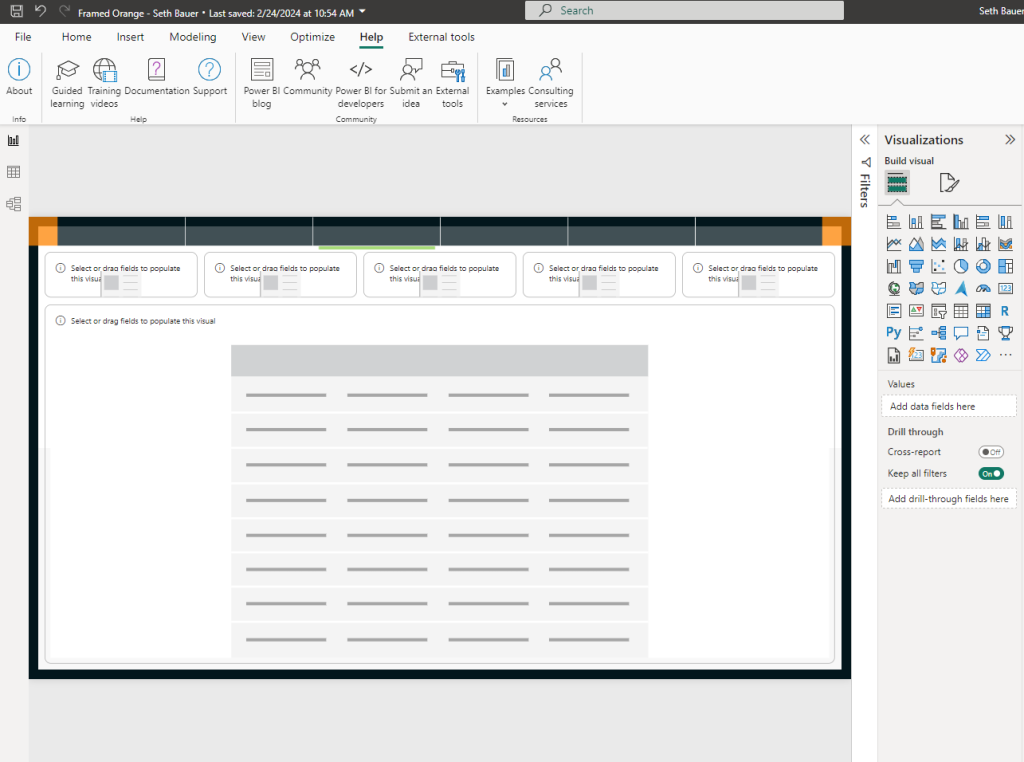
Upon opening the file, you’ll notice wireframes representing the background and areas where visualizations will go. These project files contain all of the backgrounds, visuals and theme properties. In this case we have a palette and visualization properties set, so they are also imported. In our example, a gray border is applied to all visuals and a suite of colors is found in the palette.
Step 3: Applying Changes
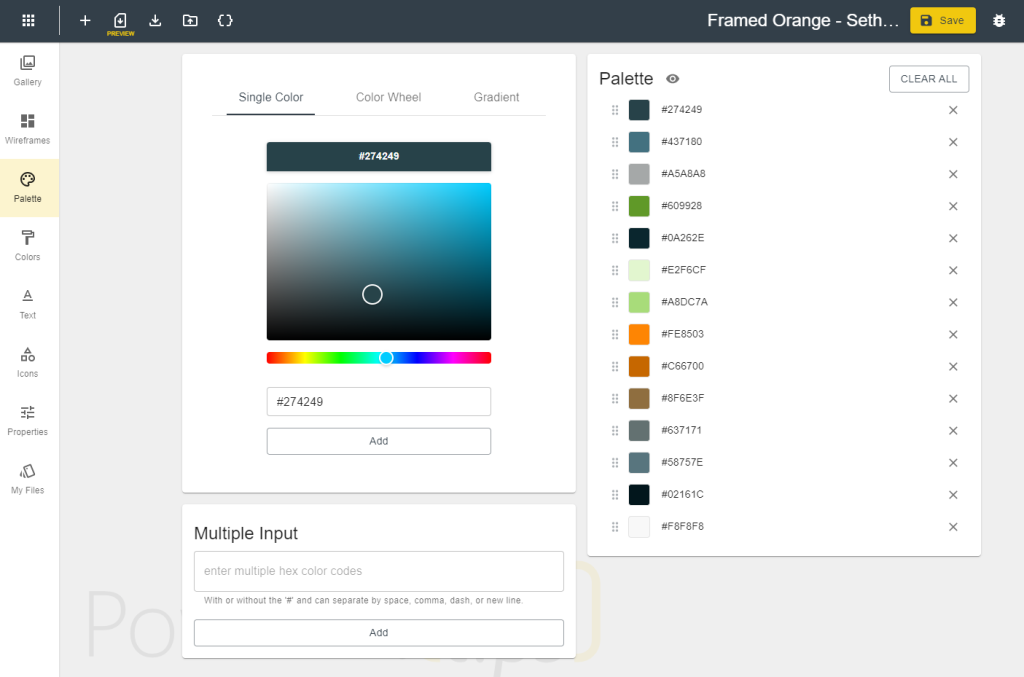
Make changes to the project file as needed. In this tutorial, we’ll curve the edges of visualizations in the properties area, and bring in our own custom color palette. Easily add hex codes of your preferred colors to personalize the project.
Step 4: Preselecting Visualizations
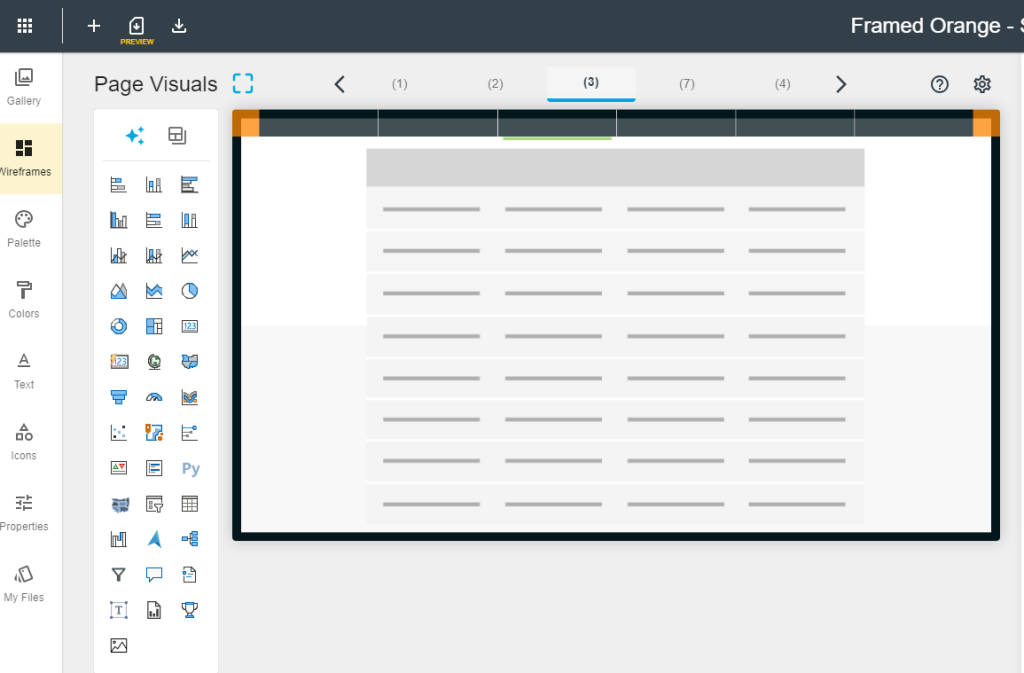
As you navigate back to the Wireframes section you can see how easy it is to add the visuals to the predefined visual objects. You aren’t locked into these though and you can easily change the size and position. We’ve thought of that too! On Page 3 of this project, for instance, the project file has a large table.
Instead of using that, you can choose from predefined templates of visual objects to easily apply to the background. This feature makes it easy to align and space visualizations appropriately.
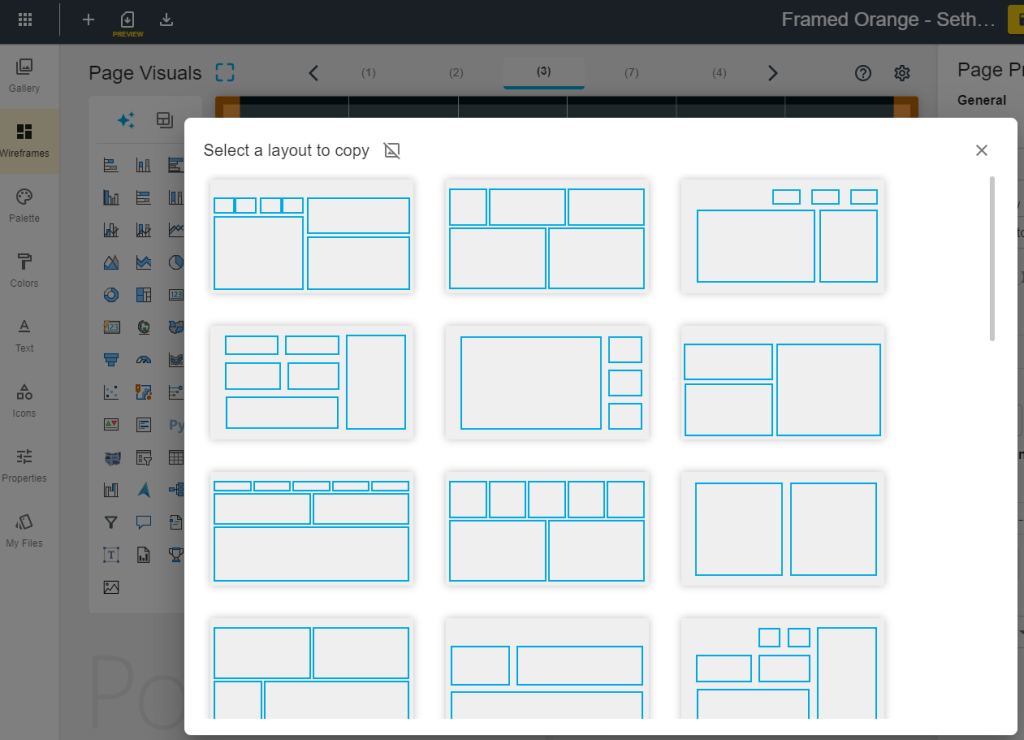
Pick the one that suites you best, and apply it to your background. Now that we have that, we can choose which visuals we want to add for easily dropping our data into.
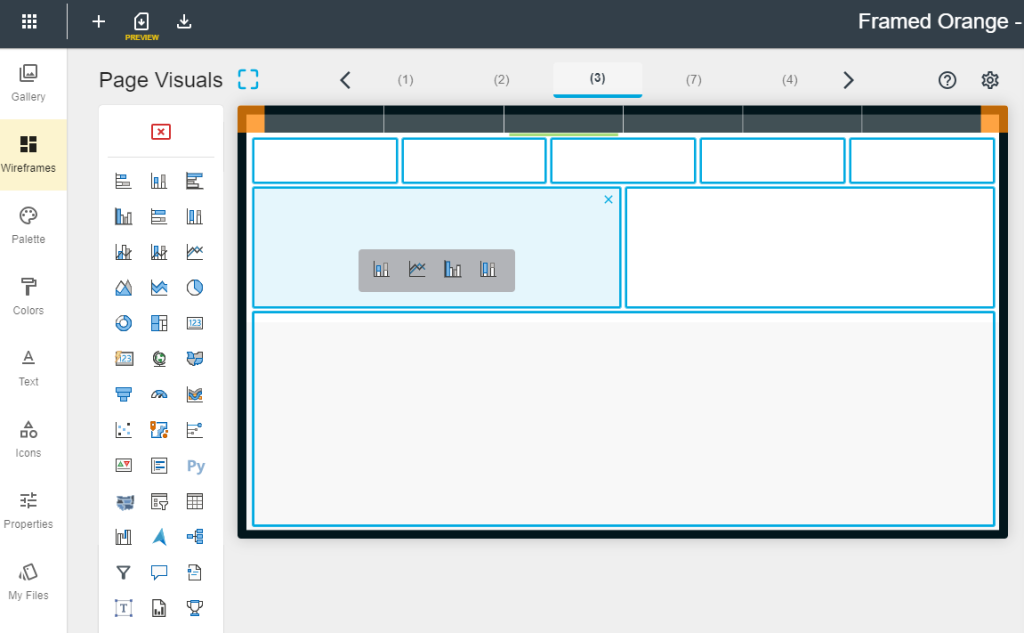
Setting up a background, and perfectly aligned visuals to create beautiful reports has never been easier!
Step 5: Downloading the Modified pbip File
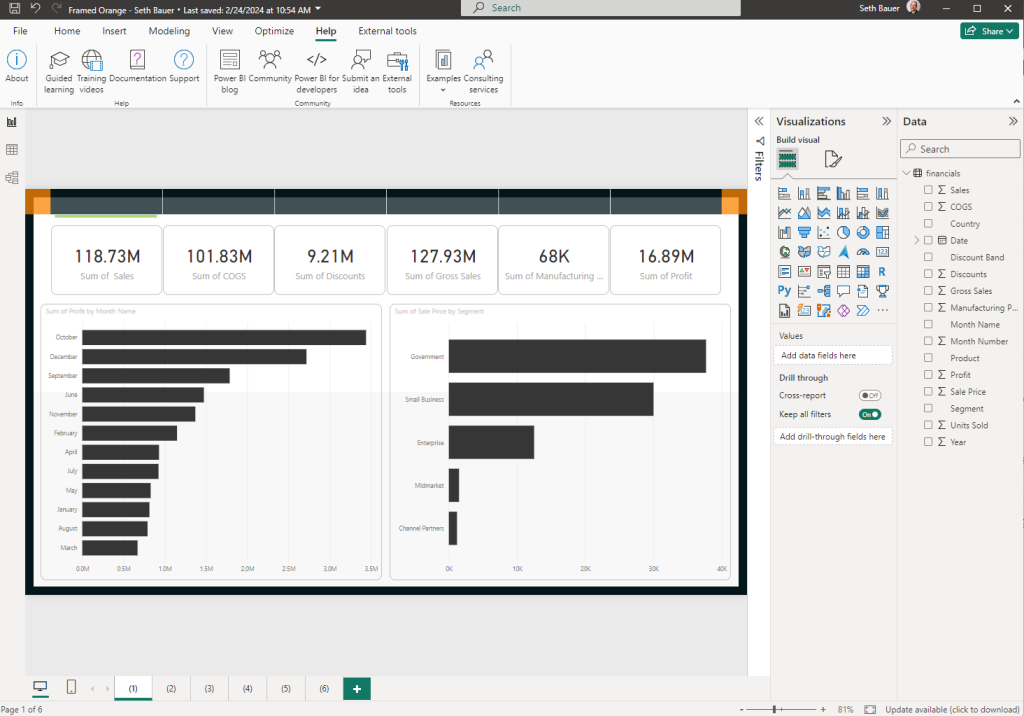
Download the modified project file (pbip) file to your computer. Extract the files and open the PBI file in Power BI Desktop. You will see that all of our properties, new theme, and background are all applied to the report.
Step 6: Adding Data
Load your data or use a sample dataset to see the visualizations populated. Drag and drop or select visualizations to add your data into the pre-configured fields.
Step 7: Exploring My Files Section
Did you realize you missed a few properties or colors, or maybe wanted to add one more page? Not a problem, you can go back and tweak the project file any time you want, because its yours! Discover the My Files section in the Power BI Tips+ Theme Generator, where you can explore and update all settings and properties for your current and future projects.
Conclusion:
With the Power BI Tips+ Theme Generator, you can effortlessly customize and enhance your Power BI reports without spending large amounts of time tweaking all the visualization settings for every report you create. Use the Tips+ Theme Generator to create amazing templates to use over and over again!
Stay tuned for our next tutorial, where we’ll delve into the exciting new AI features within the Power BI Tips+ Gallery. Elevate your reporting game with simplicity and efficiency!