

Welcome to today’s tutorial where we’ll explore an exciting feature implemented to streamline your background creation process in Power BI. If you’ve ever found yourself spending too much time tweaking and aligning visual elements, this AI-powered solution will be a game-changer for you. This new feature continues to simplify the report visualization experience and open doors for other teams to decide on the visualizations, develop the look & feel, and pass off a pbip object to Data Engineers or BI Developers to easily add data into.
If you prefer to follow along via video, you can check out the full walkthrough on the PowerBI.tips YouTube video here:
Background
Designing the look & feel of a report typically begins with tools like PowerPoint, Adobe XD, Illustrator, or Figma, where we craft our initial background designs. Whether simple boxes or intricate layouts, these designs serve as the canvas for our data stories. We decide what visuals we want, how many objects we want on a page, and how much real estate to assign. A lot of time is spent doing this. However, once you have this background image, you still have to create all the visual objects and nudge them into place.

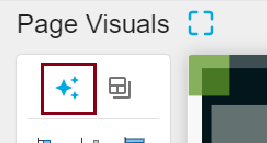
Introducing Visual Auto-Layout AI Feature
Now, with the Power BI Tips+ Theme Generator you now have a tool that can recognize these design elements and automatically generate visual objects, saving you precious time and effort!
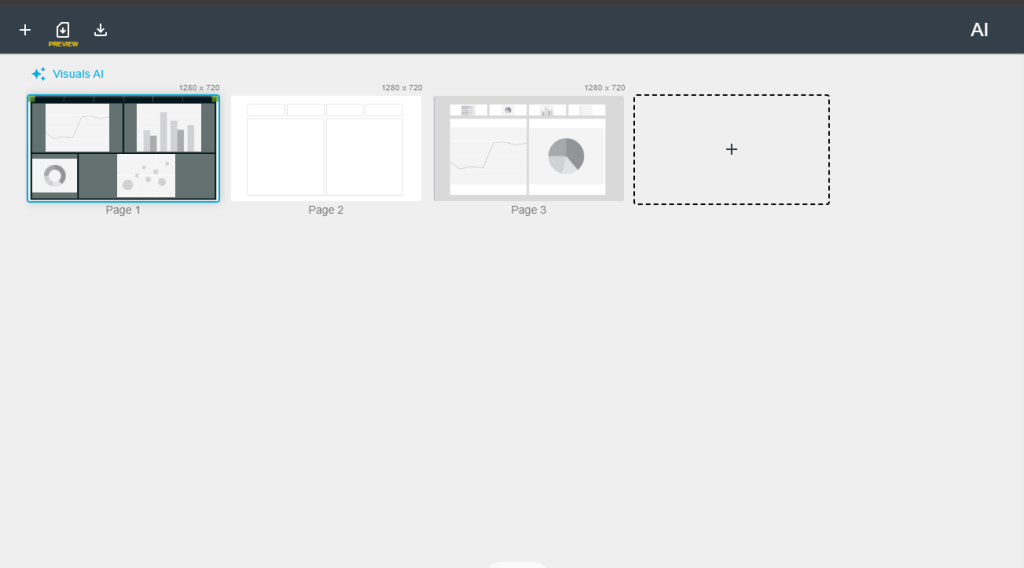
Step 1: Access the Power BI Theme Generator
Navigate to the Power BI Theme Generator, where you can upload your background images. Its extremely easy to generate new pages, and quickly upload your image to each page.
Step 2: Let AI Do the Heavy Lifting
With a click of a button our AI auto-layout feature identifies the background elements and aligns visual objects accordingly. This means no more manual adjustments or tedious alignment tasks. You can do this on a page by page level OR have the Visuals AI generate all images on all pages with just a click of a button!
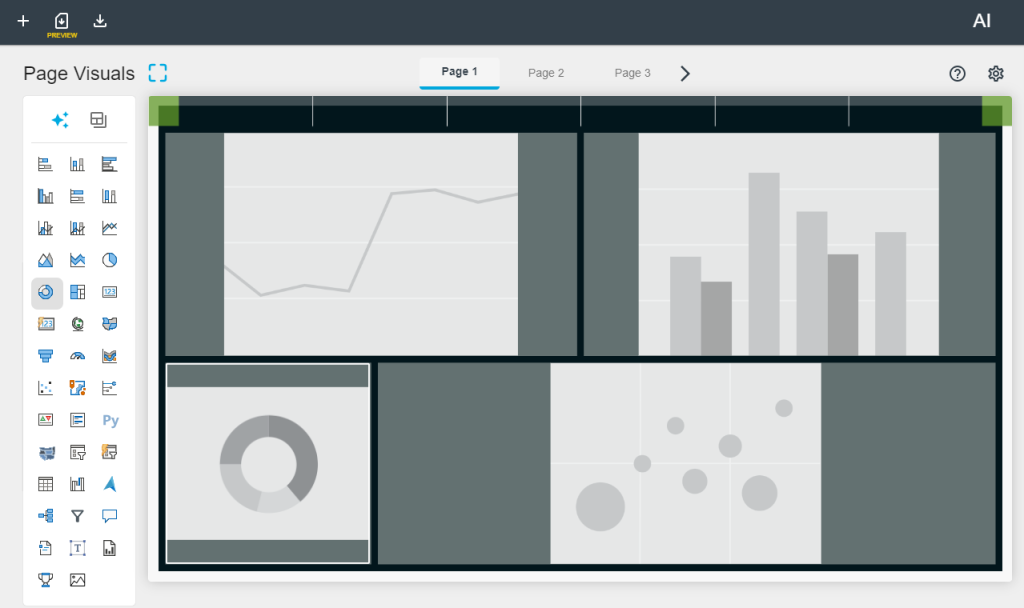
Step 3: Customize Your Visualizations
Once the visual objects are generated, all that’s left to do is select the visualizations you want to insert into each space. Enjoy the flexibility to choose the perfect visual representation for your data insights.
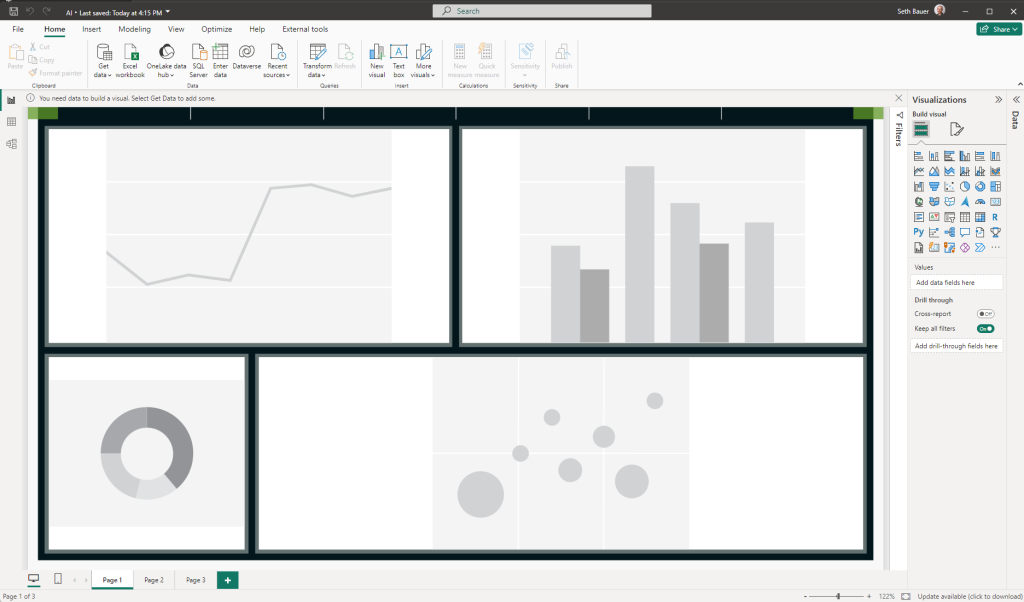
Step 4: Download and Implement
Getting this into a Power BI report is as easily as downloading the PBIX file. This file will contain all your customized background and visualizations. And as always, you can enhance your Theme file with any preconfigured setting just by adding that to your Theme Generator file. After that, just extract the files and open your Power BI report by opening the .pbip file. Voila! Your professionally designed background with perfectly aligned visuals is ready to add data to!
Conclusion
By leveraging the power of AI, you’ve not only saved valuable time but also unlocked new possibilities for creativity and efficiency in your data visualization journey. With this streamlined process, you can focus more on crafting compelling data stories and less on manual design tasks.
I hope you found today’s tutorial insightful. Stay tuned for our next tutorial, where we’ll explore another exciting feature that enhances your Power BI experience. Until then, happy visualizing!