Category: Articles & Opinions

  • Overcoming Challenges in the Center of Excellence

    Overcoming Challenges in the Center of Excellence

    Starting a center of excellence (COE) can feel daunting. We face political challenges. This article pushes to explore the challenges of a COE and some recommendations to handle these challenges.

    The Importance of Attention to Detail

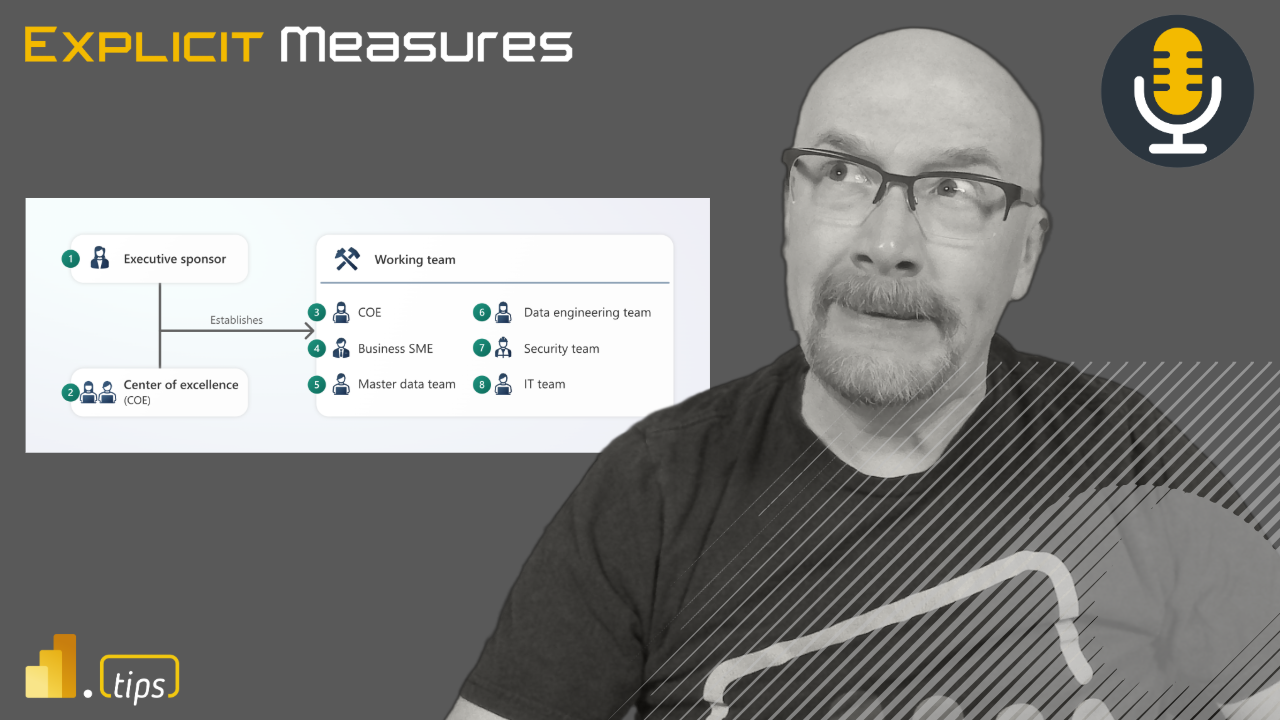
    Microsoft does a great job in outlining the key aspects of COE. For more details on this topic check out the Fabric adoption roadmap found here. A summary of those items are in the list below:

    I strongly feel that documenting the result of these conversations is a huge win. The documentation can be used to show leadership that you have a solid plan. Discussing these topics pushes towards a health data culture. Lastly, when you bring documentation to leadership you show thought of aspects that drive success.

    Foundational Attributes for Success

    The optics of the COE matter. COE performance and leadership are crucial, as they can impact the entire organization. Don’t underestimate the value of setting clear goals. Taking time to identify pain points with your current organization structure help with planning process for the COE.

    • Setting clear goals
    • Addressing pain points that you see, plan to solve those pain points
    • Just start, don’t worry about making the COE perfect, plan for adjustments

    Sometimes I feel that people try to over plan. Therefore, read up on the best practices provided by Microsoft’s documentation, write down your decisions then get moving! I have observed just by communicating and developing the plan really creates some momentum. Bear in mind it won’t be perfect in the first iteration. Plan on being flexible to adjust the COE to the organizations needs.

    Recommendations for Overcoming Challenges

    • Attention to Detail: Paying attention to aspect you can control of the COE’s performance. Engage leadership so they support the development of the COE. Remember the COE is a vote in the direction of better data culture for your company.
    • Setting Clear Goals: Defining clear goals helps the team align towards a unified direction. Address pain points that could derail or distract from the creation of the COE. Connect the success of the COE to Objectives and Key Results (OKRs) outlined by the leadership team.
    • Regular Communication with Executives: Regular communication with the executive team helps remove mis-aligned expectations. When you win let leadership know, they can promote your success. Success means more buy-in from the company.
    • Feedback: Gathering feedback and pivot. Have empath for the process and be willing to adjust. If something is not working within the COE try something new. Ask others involved in the COE for recommendations, some of the smartest people are the ones you already work with.

    For more thoughts on the COE and overcoming those challenges check out our episode on the explicit measures podcast.

  • Creative Thinking in Fabric & Power BI

    Creative Thinking in Fabric & Power BI

    In podcast #286 we take the time to review an older video of John Cleese giving a talk about the Creative Process in Management. We thought this would be an outstanding conversation to draw parallels to the Business Intelligence world. There are so many different areas we can apply creative thinking in implementing Fabric & Power BI solutions.

    You can check out that video by John Cleese here -> https://youtu.be/Pb5oIIPO62g?si=66KNV2I8p5ZlESzz

    Episode 286 – Creativity in Power BI

    Talking Points:

    • What is Creativity, and what strategies can we use to be more creative?
    • Discussion centered around the concept of being creative in handling data, building reports and fostering a data culture.
    • Emphasize that creativity is not a talent but a mode of operation and discussed its relevance in the field of Business Intelligence.

    Key Topics:

    Where does creativity lie:

    • Discussed the distinction between open and closed states.
    • Strategies to foster creativity and measure its benefits.
    • Dedicated time for creative thinking, challenging the conventional to-do list approach.
    • Creating an oasis of quiet for pondering and problem-solving.
    • Embracing humor as a catalyst for transitioning from closed to open thinking.

    Overcoming Barriers:

    • Identifying common obstacles to creativity within organizations dealing with technology and data.
    • Evaluating the balance between analytical rigor and creative exploration in Power BI.

    Applications and Tips:

    • Exploring creativity in the adoption of BI practices, report building, and its application in day-to-day operations.
    • Building reports with an open mindset.
    • Allowing time for pondering before making decisions.
    • Encouraging positive collaboration within a community.
    • Applying the “art of the possible” by exploring new ideas.

    Meeting Creativity:

    • Examining the impact and value of injecting creativity into BI processes for organizational growth.
    • Introducing humor in meetings to foster creativity.
    • Building on ideas without fear of right or wrong.
    • Utilizing random connections for innovative solutions.
    • Creating a positive environment by avoiding negativity.

    Report Building Process:

    • Front-loading creativity in requirements gathering.
    • Incorporating creative thinking in model design and building calculations for visuals.

    This podcast episode is a treasure trove of insights for BI professionals looking to infuse creativity into their work, ultimately contributing to more innovative and effective business intelligence solutions. You can listen to the full conversation on the Explicit Measures podcast here:

    As a special add-on for your enjoyment Tommy came up with a whole slew of jokes in the same vein that John Cleese told in the presentation. Feel free to use them in your next creative meeting!

    Jokes Created by Tommy Puglia:

    How many data scientists does it take to change a light bulb?
    Three. One to replace the bulb, and two to model whether it was the most cost-effective light bulb choice.

    How many machine learning experts does it take to change a light bulb?
    Just one, but it will take thousands of tries to learn how to do it properly.

    How many business analysts does it take to screw in a light bulb?
    Two. One to assure everyone that everything is going according to the plan while the other screws the bulb into the water faucet.

    How many BI consultants does it take to screw in a light bulb?
    Only one, but they’ll first conduct a cost-benefit analysis to determine if the light bulb change will add value.

    How many marketing analysts does it take to change a light bulb?
    One, but they’ll also rebrand the room to make it look brighter.

    How many sales analysts does it take to change a light bulb?
    Just one, but they’ll convince you to upgrade to a smart bulb with a subscription plan.

    How many data warehouse architects does it take to change a light bulb?
    Two: one to change the bulb and another to ensure it integrates seamlessly with the existing lighting infrastructure.

    How many AI developers does it take to change a light bulb?
    They won’t. They’ll train a neural network to predict when the bulb will burn out and preemptively send a drone to replace it.

    How many cloud storage experts does it take to change a light bulb?
    None. They’ll just store light in the cloud and access it as needed.

    How many Business Analysts does it take to screw in a light bulb?
    Just one, but they will first interview everyone in the room to define the requirements for the ‘ideal light’ experience.

    How many Data Analysts does it take to change a light bulb?
    Two. One to replace the bulb, and the other to tell everyone how much brighter it could be with just a few more data points.

    How many stakeholders does it take to change a light bulb?
    Four. One to ask for a greener bulb, one to demand a cost-effective solution, one to insist on a smart bulb, and one to question why the bulb needs changing at all.

    How many report requesters does it take to change a light bulb?
    None. They’ll just ask for a daily report on the status of the light bulb but never actually replace it.

    How many Data Analysts does it take to screw in a light bulb?
    One, but by the time they’ve finished analyzing the best method, the technology for light bulbs has already changed.

    How many stakeholders does it take to change a light bulb?
    Five. One to change it and four to form a committee that debates whether it was better the old way.

    How many report requesters does it take to change a light bulb?
    None. They just keep requesting status updates on the darkness.

    How many BI Consultants does it take to screw in a light bulb?
    Two. One to assure the client that they’re leveraging cutting-edge lightbulb technology, and the other to outsource the actual screwing in to an intern.

    How many BI Consultants does it take to change a light bulb at a large corporation?
    An entire team, but the project will take three years and by the end, they’ll switch to a completely different kind of bulb.

  • Welcome to Community Jam

    Welcome to Community Jam

    PowerBI.Tips LOVES community. And we are out to prove it.

    We are so proud to announce Community Jam by PowerBI.Tips, the all-inclusive, resource driven, and COMMUNITY led learning tool for members of the Power BI Community. Today is our first step – there is so much more to come.

    What is Community Jam

    Community Jam is the one-stop shop for what is important in the Power BI community and keeping up with the latest news. As of launch today, there are three main areas of Community Jam: Release Plan, Power BI Ideas, and Bookmarks.

    Release Plan

    We have incorporated Alex Power’s Power BI Release Plan app into Community Jam, allowing you to see what is on the roadmap for MIcrosoft releases around Power BI.

    Power BI Ideas

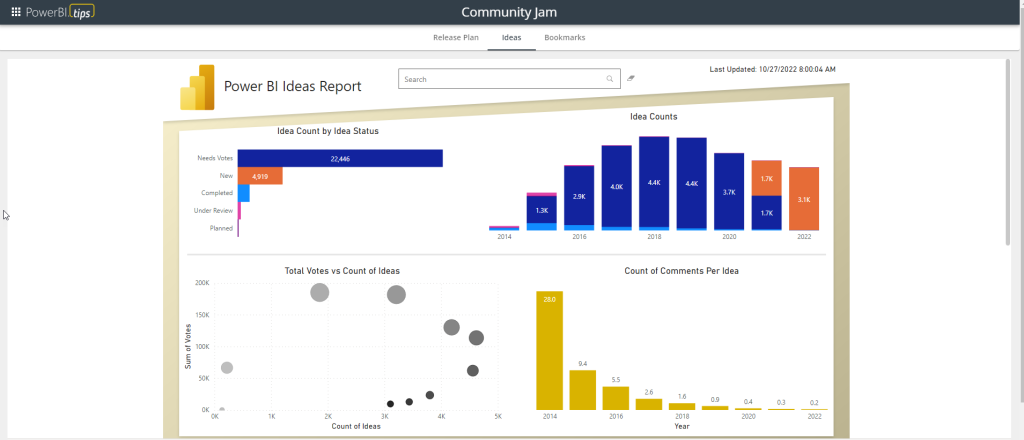
    Mike Carlo has done an incredible job feeding in all of the ideas on ideas.powerbi.com, allow you to easily search, find, and vote for new and hot ideas that should be part of the next wave and future of Power BI features.

    Ideas on Community Jam

    Bookmarks

    This is a cool one. Working with Tommy Puglia, the PowerBI.Tips team has now over 6,000 articles from across the Power BI community of authors and bloggers that you can use as your own knowledge center. Using the bookmarking service Raindrop.io, any new articles, videos, and resources that touch Power BI are saved here.

    Bookmarks in Community Jam – Your Go-To Resource Toolbox

    I want to talk more about the bookmarking feature here. I have been using Raindrop.io for over 3 years to save any relevant article posted around Power BI. With a combination of RSS feeds, Twitter links, and email subscriptions, a ridiculous amount of articles have been written around the how-to’s, what, and did you know in Power BI.

    Tips & Tricks

    You can either browse through the latest articles in the Community Jam website or go to the dedicated Raindrop page. On the Embed page, if you have a raindrop account, you can save articles to your own Raindrop service, or simply read the new articles within Community Jam.

    Use the “more” button to go to page on Power BI that really opens up the amazing features of Community Jam Bookmarks.

    find articles based on nested collections

    Nested-Collections

    Community Jam Bookmarks have nested collections that allow you to further refine the articles. Simply by choosing on the top of the page, you can fine focused articles (new and old) around Community, Power Query, DAX, Admin, or Data Visualization with just one click.

    DAX nested collection

    The top right has a search bar that will allows you to choose based on tags (more to come here) or by your own search. Not only will it search title and description, but Raindrop allows you to search the content of the article as well!

    Search in Community Jam Bookmarks

    Want to learn about variables in DAX? Use nested collections and search, and you got 235 articles to read up on.

    Need to read up on Power Query? How about 917 articles?

    Admin & Governance? 500+.

    What about Tabular Editor 3? 50 focused articles.

    How about Charticulator? 28 dedicated resources.

    Power BI Goals? We got 56 for you.

    The search feature is INCREDIBLE. We have more plans here to include a tagging system (using the # which you can see on the search page) that will further help you find the right resources.

    And More Resources

    Get your favorite PowerBI.tips resources using the app pane in the top left of Community Jam, including the Theme Editor, Charts, DAX Templates and more. Also, you can find the podcast and all training here too!

    Why Community Jam.

    We cannot stress this enough. This is just the beginning of what we see as what should be a central area for Power BI fans to learn and grow within the community.

    Community Jam is for users, for the community, by the community. Empower and grow, network and learn – Community Jam is ready to go!

    If you like the content from PowerBI.Tips please follow us on all the social outlets. Stay up to date on all the latest features and free tutorials.  Subscribe to our YouTube Channel.  Or follow us on the social channels, Twitter and LinkedIn where we will post all the announcements for new tutorials and content.

    Introducing our PowerBI.tips SWAG store. Check out all the fun PowerBI.tips clothing and products:

    Check out the new Merch!

    Hasta La Vista Data
    Go Ahead Make My Data
    PBIX Hat


  • Continuously Improving User Experience

    Continuously Improving User Experience

    In the day to day operations of businesses speed of delivery, cost effectiveness, and satisfaction of outcome is a trifecta of challenges we run against as report authors. Picking and choosing what parts to deliver, and when, determines the overall success of a given report. However, we typically can’t do all at the same time. As a result, we need to keep in mind that there should be a process or cycle of continuous improvement to ensure we are making the biggest impact to the business. In this episode we dive into these areas and more to discuss how to improve upon our solutions and what tips & tricks you can use to ensure you are continuously improving user experience.

    Ways to Improve User Experiences

    A few ideas that we mull over and explore in depth are how do you elicit or collect the feedback that would prompt you as the report author to understand what areas you could improve upon. Are you performing surveys? Are you analyzing or generating reports off the metrics that you have access to via the Power BI Service to understand usage. Are you tracking and managing against the overall influx of requests or tickets and are those going down as you solve problems? Are there tools that would help you dive deep into the tracking and dependencies of a report? We answer all these and more so be sure to check out our conversation.

    Recommendations

    Mike 

    Tommy 

    • Build training for the report 
    • Have a road show for the report 
    • How do you measure educating users on reports 
    • Quarterly report surveys 
    • Number of people filling out survey 
    • Usage of report 
    • How many people are asking for access? 
    • Is the 30 day usage views, Active users  

    Seth 

    • Add a tab to explain how to use portions of the report 
    • Build an index report for use in Apps 
    • Focus on areas of the business the use Power BI the most and least 
    • Have open feedback sessions 

    If you like the content from PowerBI.Tips, please follow us on all the social outlets to stay up to date on all the latest features and free tutorials.  Subscribe to our YouTube Channel, and follow us on Twitter where we will post all the announcements for new tutorials and content. Alternatively, you can catch us on LinkedIn (Seth) LinkedIn (Mike) where we will post all the announcements for new tutorials and content.

    As always, you’ll find the coolest PowerBI.tips SWAG in our store. Check out all the fun PowerBI.tips clothing and products:
    Store Merchandise

  • Power BI Themes

    Power BI Themes

    Themes are the bedrock of consistency. As report authors it is important to create a consistent experience in a single, series or multitude of reports. With a little forethought you can easily build reports that exhibit the same fonts, properties and many other aspects with a Power BI Theme. If you aren’t using a theme and you build reports, its time you learn about them and put them into your arsenal.

    Using Power BI Themes

    Themes are available in a simple form in the Power BI Desktop and you can set color templates and some global properties for fonts and sizes. You can read more about that in Microsoft’s documentation here. However, themes go much, much deeper than that. You can set almost any visual property to a pre-configured setting. This greatly simplifies building a report, and creates a consistent experience across all your report pages. A single theme can be applied and removed from the Power BI desktop with ease.

    Are Power BI Themes Hard to Build?

    Creating a custom theme on your own would be hard… very hard. The theme files are built using the JSON format and have grown in complexity over the years. So, its highly unlikely that you are going to endeavor to build your own. Lucky for you, we love themes and created one of the first and most widely used theme generator to minimize the time it takes you to build a comprehensive theme to maximize your efforts. You can find and use that tool for free here. Another great resource has been provided by Matt Rudy, be sure to check out his Git repo. One of the key reminders when using themes: Make sure you don’t customize any properties in your report before applying a theme because they won’t be applied.

    Discussion

    We tackle all there is to know about implementation, when and how to best use themes and how to maximize your experience using themes in your Power BI reports in this episode. Be sure to join us to learn more.

    If you like the content from PowerBI.Tips, please follow us on all the social outlets to stay up to date on all the latest features and free tutorials.  Subscribe to our YouTube Channel, and follow us on Twitter where we will post all the announcements for new tutorials and content. Alternatively, you can catch us on LinkedIn (Seth) LinkedIn (Mike) where we will post all the announcements for new tutorials and content.

    As always, you’ll find the coolest PowerBI.tips SWAG in our store. Check out all the fun PowerBI.tips clothing and products:
    Store Merchandise

  • Discussing SQLBI’s 7 Reasons DAX is Not Easy

    Discussing SQLBI’s 7 Reasons DAX is Not Easy

    First of all, go read this amazing blog put out by Alberto Ferrari over at SQLBI that he posted awhile ago. It is the context for the conversation we had and is well worth the read. 7 Reason DAX is Not Easy If you are new to DAX you will find a wealth of deep, insightful and helpful content in anything you find on SQLBI. Marco and Alberto are amazing guru’s in DAX and tabular models and have been perfecting their craft and helping the wider community hone their skills for many years.

    I’m not going to re-hash the article as you should go read it yourself on their site. The points we talk about in depth in the podcast relate to focusing on the best methods to approaching and learning DAX. We take our experiences and the methods we learned and discuss at length the different points made in the article. Explore with us how you get better and overall simplify your process when building or troubleshooting DAX.

    Key Takeaways

    Tommy

    Practice with Intent

    Understand each part of the calculation

    Reverse engineer Calculations

    Seth

    Start Simple

    Break down the problem to simple forms

    Use variables and tables to build measures

    Mike

    Use Community Tools –

    Power BI Side Tools (Download with Business Ops)

    DAX Generator

    If you like the content from PowerBI.Tips, please follow us on all the social outlets to stay up to date on all the latest features and free tutorials.  Subscribe to our YouTube Channel, and follow us on Twitter where we will post all the announcements for new tutorials and content. Alternatively, you can catch us on LinkedIn (Seth) LinkedIn (Mike) where we will post all the announcements for new tutorials and content.

    As always, you’ll find the coolest PowerBI.tips SWAG in our store. Check out all the fun PowerBI.tips clothing and products:
    Store Merchandise

  • Data Culture with Matthew Roche

    Data Culture with Matthew Roche

    This month we partnered with the relaunch of the Des Moines user group to host Matthew Roche. This month’s topic is all about data culture. If you don’t know Matthew you should get to know him. His experience in developing enterprise data access is second to none. Along this journey of working with the largest Microsoft clients Matthew has learned a lot about their data cultures.

    Obviously working with so many companies you can see what works and what does not. In this video webinar, Matthew discusses what is Data Culture. Additionally, there are aspects of what determines a successful environment.

    Check out the full video below. Link for YouTube Video.

    Thank You and Follow

    Massive thank you to Matthew our presenter. Huge shout out to James Bartlett and Dipo Thompson for the planning. Be sure to follow our presenters on LinkedIn.

    Other Data Culture Projects

    Matthew has also worked on many other impactful projects. One such project has been the Power BI Roadmap. This the best guide for individuals wanting to start their Power BI journey. On the Explicit Measures Podcast we discuss the Power BI roadmap quite often. Thus, we feel it adds a ton of value. Check it out for yourself.

    Visit the Power BI Adoption Roadmap here

    Data Culture Image from Adoption Roadmap

    Data Culture Slides

    For the link to the slides of this presentation please download them here.

    If you like the content from PowerBI.Tips please follow us on all the social outlets. Stay up to date on all the latest features and free tutorials.  Subscribe to our YouTube Channel.  Or follow us on the social channels, Twitter and LinkedIn where we will post all the announcements for new tutorials and content.

    Introducing our PowerBI.tips SWAG store. Check out all the fun PowerBI.tips clothing and products:

    Check out the new Merch!

    Hasta La Vista Data
    Go Ahead Make My Data
    PBIX Hat


  • Measuring Data Culture Success

    Measuring Data Culture Success

    This topic was gleaned from the absolute wealth of knowledge put down in the MSFT Power BI Adoption Roadmap. We highly recommend you check the full roadmap. In this episode, we focused in on Data Culture, this topic is a bit ambiguous as it relates to how you measure the outcome or success of your organizations data culture. Despite that, we took a good shot and covered quite a bit of ground and came up with some good ideas of how to better measure and determine how to build, how to measure and challenges organizations face when embarking on increasing the value of decision making based on data.

    Its a Culture Thing

    “You know it when you have it, and you know it went you don’t.” – Mike Carlo

    “If you are trying to measure culture, you are really just trying to measure behavior.” – Tommy Puglia

    “It’s pattern changing of people… one of the largest challenges any organization will have..” – Seth Bauer

    How do you Measure it?

    Behaviors are hard to measure, but you can put things in place to evaluate it. Tommy uses his sociology degree and brings up a good point in that there are ways in which we can directly and indirectly measure culture. Overall, the time invested in each of the different areas of the adoption roadmap will indicate how successful the data culture is. Success metrics are pointed out in how widely available data is to the organization.

    Is it easy for individuals to find, access and use the right data at the right time? When they find it, do they know what it means? As organizations begin to invest time and resources in building out areas of the adoption roadmap the better and stronger they become at making data based decisions. The investments start to develop patterns of behavior that drive to better outcomes. Listen for more ideas on what sort of KPIs you could measure, or different patterns and behaviors would indicate your data culture is strong.

    Listen to for these key points and more in our recent conversation

    Listen to the Podcast

    If you like the content from PowerBI.Tips, please follow us on all the social outlets to stay up to date on all the latest features and free tutorials.  Subscribe to our YouTube Channel, and follow us on Twitter where we will post all the announcements for new tutorials and content. Alternatively, you can catch us on LinkedIn (Seth) LinkedIn (Mike) where we will post all the announcements for new tutorials and content.

    As always, you’ll find the coolest PowerBI.tips SWAG in our store. Check out all the fun PowerBI.tips clothing and products:
    Store Merchandise

  • Trolling the Power BI Ideas Site

    Trolling the Power BI Ideas Site

    Trolling… we should clear up the definition of this right off the bat. We aren’t talking about the type of trolling where we spend a bunch of time finding things on the Power BI Ideas site and say obnoxious things about them to elicit a response. We may say obnoxious things, but not in that context. In any case, what we spend time doing periodically is seeing what fantastic ideas people are coming up with and requesting for future feature enhancement. Today we’re going to dive into some of our favorites and would encourage you to give them a look. If you agree with us, be sure to vote them up!

    The Power BI Ideas Site

    If you aren’t familiar this site was created right alongside the Power BI Community site and has been part of the ecosystem of Power BI for a long time. It certainly speaks to Microsoft wanting to hear from, and build a great community around Power BI right from launch. The site is a direct way that users can submit ideas, garner support from the community, and raise the visibility of that request. The Power BI product teams then review the most voted on requests and determine if the request is something that they want to add into the tool.

    Trolling & Contributing

    Perusing the ideas and contributions of others is always a good way to broaden your scope. It gives you a taste of what other people need and want in a tool that may serve you just fine. Its also a shortcut to understand what isn’t in the tool that maybe you thought was. More importantly though, the site is a great way to contribute your ideas to making Power BI even better than it is already. We encourage everyone to contribute.

    Top Picks

    Mike’s Ideas: 

    Tommy Ideas: 

    Seth’s Ideas:

    Join us for the full conversation as we discussed all these and more in the podcast!

    If you like the content from PowerBI.Tips, please follow us on all the social outlets to stay up to date on all the latest features and free tutorials.  Subscribe to our YouTube Channel, and follow us on Twitter where we will post all the announcements for new tutorials and content. Alternatively, you can catch us on LinkedIn (Seth) LinkedIn (Mike) where we will post all the announcements for new tutorials and content.

    As always, you’ll find the coolest PowerBI.tips SWAG in our store. Check out all the fun PowerBI.tips clothing and products:
    Store Merchandise

  • Power BI Formal vs. Self-Training

    Power BI Formal vs. Self-Training

    We’ve been having an amazing amount of fun having conversations on our podcast “Explicit Measures”. Join us live on Tuesdays and Thursdays on YouTube or listen on Spotify or Apple Podcast. During our podcast this last week, we talked about which method is better when trying to learn all the different aspects of Power BI, Formal vs. Self-Training. Given that the tool has been out 6+ years, there are plenty of resources available now to all end users. As such, we discussed in detail many aspects of what these approaches offer. We’re huge proponents of making sure that all individuals keep learning, and the time you invest in yourself increases your value personally and professionally. Above all, whether it is formal training, or self-training, we encourage everyone to keep learning.

    Formal vs. Self-Training

    Formal

    Typically this type of training revolves around someone teaching you. One of the benefits of formal training is that it allows beginners and advanced users alike to accelerate their learning. The main reason is because the expert teaching can provide insights and shortcuts that have to be hard earned when doing Self-Training. Formal training will almost always be something you need to pay for.

    Self-Training

    Self-Training revolves around what material is out there that you find on your own. This means you are learning things as you go. A lot of the different things we learned ourselves fall into this bucket. The challenge with this method of learning is that you don’t know what you don’t know. As a result, it may take longer for you to experience the bigger issues and solve the problems without anyone guiding you. Some types of materials that support Self-Training are the Power BI Community, blogs and books. When you are researching and finding your own learning path the material is usually free.

    Our Recommendations

    Have your organization support your goals. Is there potential for you to tie this to your yearly goals? Is there some way you can take what you learned and share with other colleagues.

    Some of our favorite Links for learning:

    Other Questions & Areas Discussed

    Is Self-Training the same thing as solving a problem for your current job need?

    Practical vs. Theoretical Learning.

    Is there a difference between knowing Power BI in your job vs. knowing Power BI?

    Will Formal or Self-Training set you apart from others when looking for a job?

    Check out the full episode below where we discuss all these things in detail.

    If you like the content from PowerBI.Tips, please follow us on all the social outlets to stay up to date on all the latest features and free tutorials.  Subscribe to our YouTube Channel, and follow us on Twitter where we will post all the announcements for new tutorials and content. Alternatively, you can catch us on LinkedIn (Seth) LinkedIn (Mike) where we will post all the announcements for new tutorials and content.

    As always, you’ll find the coolest PowerBI.tips SWAG in our store. Check out all the fun PowerBI.tips clothing and products:
    Store Merchandise