Category: Articles & Opinions

  • Power Query – Get Started!

    Power Query – Get Started!

    As a user that builds Power BI reports, did you know the different technologies that come into play when you interact with the tool? This is one of the first questions I ask to new audiences or people I’m training on Power BI. Why is this important? The reason is that it is crucial to understand what part of the tool you are in so that you can separate out the different tasks that you should be doing or trying to accomplish in each area. The other biggest reason is you need to know what you should be searching for in your favorite web browser when you are looking for answers to your current problem.

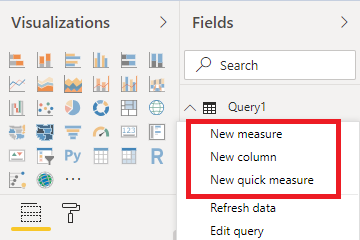
    With that said, there are two main components to the Power BI Desktop, Power Query (aka. Edit Queries) and the Tabular Model that you have access to in the main part of the tool. I’ll mention the tabular model first, but we won’t be diving into that in this article. It is responsible for compressing our dataset and gives us the speed we see over all the data we want to slice and dice. We can create relationships in our model window, and we can create additional calculations to extend our original dataset by using measures or calculated columns. The underlying language in the Tabular model is “DAX”.

    model
    measures and calculated columns

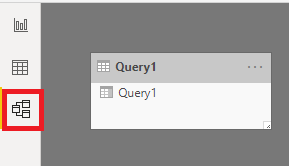
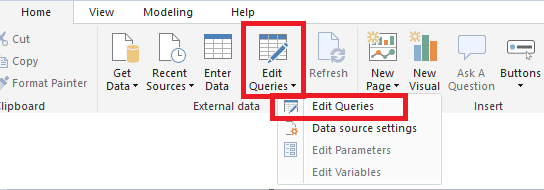
    Power Query is our ingestion engine, it connects to our data sources and allows us to perform the ETL (Extract, Transform, Load) activities on our raw datasets. This is extremely helpful and an absolute must to create clean data, and shape it into the best form for loading our models that we want to work with in our reports. The underlying language in Power Query is called “M”. When you toggle open edit queries

    edit queries

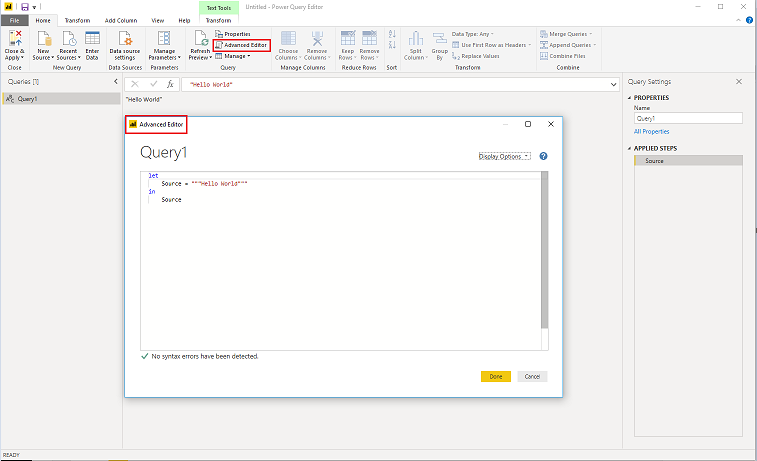
    You are presented with a new window that makes a clean separation between the two interfaces. Connecting to or creating data creates a new query, clicking the “Advanced Editor” will open another popup window where we can see the “M” code for all of the steps we have taken in that query. Most of everything you do in Power Query will be in the interface as you get started, but getting to the point of understanding how to manipulate the code in the Advanced Editor will change the way you can build reports immensely.

    advanced editor

    The vast majority of Power BI users are extremely new to Power Query, so today I wanted to spend a little time talking about a book that has helped me immensely in understanding how to get the most out of that aspect of the tool.

    One of the best things you can do when trying to understand something is to get an expert to show you how to do it, whether that is in a class setting, a presentation or a book. They have knowledge around the area and can streamline your learning process. There are people who learn in different ways, but I would argue that each type has different levels of retention. For instance, when I go to a session that is heavy in coding and techniques, I take a bunch of notes because I know that while it all makes sense in the session, I’ll forget the specifics and have to refer to my notes when I need to apply what I learned. The same goes with books I read, I grab snippets of techniques and write down a bunch of reference things for later. Whereas, if I go to a class and have to walk through the steps on my own or take them away as homework, it forces me to practically walk through an exercise and the steps in order to complete it. Doing this locks the technique in, and I’m able to recall how to do it when I need it instead of having to look things up again.

    If you are serious about getting better at the ETL portion of your Power BI report building there are numerous resources out there, but today I’d like to spend some time talking about one in particular that I would highly recommend authored by Gil Raviv.

    (Disclaimer: Gil Raviv is a friend, and his book was gifted to me)

    Suffice to say Gil is one of the best to learn from since he was part of the MSFT team that created Power Query. To read more about Gil, check out his bio on his website here -> https://datachant.com/about/

    https://www.amazon.com/Collect-Combine-Transform-Business-Skills/dp/1509307958/ref=cm_cr_arp_d_product_top?ie=UTF8

    The main reason I’m recommending this method to learn is that it isn’t JUST a book. Think of this as an instructional class, where you have a bunch of material for both preparation and homework. What Gil does here is amazing from a sharing perspective. Along with the book, you are given access to almost 200 files that include the data sources and the Power BI Desktop files with the solutions built into them… Take a moment to digest how much content is in here, it is quite astounding.

    The layout of the book is designed with the business user in mind, and focuses on the most often used steps and how you perform them. As you advance through the book, you will have the opportunity to build along with each lesson, if you get stuck or don’t quite understand a lesson, then you have the solution file as a reference. I loved the interaction here, in most of the lessons I just created my own queries right along side the solution queries and if I ever got jammed up I could just click in to the solution query for the correct step. This made things really conducive to staying engaged in the lesson and moving through a lot of material.

    Like our journey with Power BI, it starts simple and moves towards advanced concepts. About mid-way to ¾ of the way through you will be introduced to the advanced editor and M, here you will start to learn how you can manipulate the queries themselves without the UI… Getting here puts you in such a powerful position with your ETL. Working through these lessons has empowered me to easily understand how to manipulate my backend sources, modify my steps I built in the UI with additional filters or actions, and troubleshoot potential issues in Power Query. If all that isn’t enough, Gil gives his top pitfalls and things to avoid section which is an invaluable resource section.

    I really enjoyed this book, and it sets a high bar for me moving forward in that I will be looking for other materials from other authors to provide this level of engagement with something I want to learn. The structure of the book, using the chapters to read through the step by step way to perform the action, having the source material and the solution files all in one spot makes for a fantastic way to learn. Whether this book is your first foray into Power Query, or you choose to go it alone, I highly recommend that you get started in the journey.

    If you like the content from PowerBI.Tips, please follow us on all the social outlets to stay up to date on all the latest features and free tutorials.  Subscribe to our YouTube Channel, and follow us on Twitter where we will post all the announcements for new tutorials and content. Alternatively, you can catch us on LinkedIn (Seth) LinkedIn (Mike) where we will post all the announcements for new tutorials and content.

    As always, you’ll find the coolest PowerBI.tips SWAG in our store. Check out all the fun PowerBI.tips clothing and products:
    Store Merchandise

  • Power BI Dataflows: Change is Coming

    Power BI Dataflows: Change is Coming

    I have been holding on to a copy of Satya Nadella’s book “Hit Refresh” for quite some time. With all the Power BI goodness, the job, etc.… I just hadn’t gotten around to it. However, it made its way into my bag on a recent flight and I found it to be an exceptional story and a very clear view into how Satya plans to take Microsoft into the future. You might say he “open sourced” his plans. After reading this and comparing it to what I’ve been hearing and seeing regarding the fundamental changes in culture and products coming out of Microsoft, I think I’m in a familiar group of those that say he appears to be an exceptional leader who has the talent, vision, and focus to achieve the goals he has set out for himself and Microsoft.

    The main three focus areas for the direction of Microsoft according to Satya revolve around Mixed Reality, Artificial Intelligence (AI), and Quantum Computing. It is important to understand this direction, because it can provide insight into the changes we see in product suites and what future these changes might hold. Setting aside Mixed Reality and Quantum Computing for the moment, we’re already being exposed to how AI is starting to augment Power BI. The latest announcements at PASS Summit revolve around exposing AI delivery mechanisms to business users via Automated Machine Learning features to gain even deeper insights. The work to introduce AI automatically into the tool is already present in features like Explain the Increase/Decrease, Quick Insights and Q&A. Innovations in bringing AI into reporting and analytics is going to continue to change how we look at information in a future that is much closer than I think many are prepared for.

    With the book in mind I was also doing a lot more study in architecture and design in the Azure ecosystem and strengthening my understanding of how the modern data platform is built and can expand to support multiple business needs. Without getting too involved, the overall gist of what I’m seeing is that the process of data ingestion, movement, transformations and storage are being made easier. The 2nd generations of the initial services are being rolled out and the suite of services are starting to do a large part of the heavy lifting in some of the most challenging areas. As a result, these services have a greater potential for wider adoption and becoming a large part of newer modern solutions. In addition, after tying all the services together from source to analytics I started to see a specific service that could be considered the hub for all this analytics activity. Azure Data Lake Storage Gen 2. This service is certainly being positioned as the main storage entity and seems to hold the architectural location as the de facto place where both Enterprise and Business are being funneled for interaction. Data cleansing, machine learning, warehousing, event hubs, etc., etc. can all pull/push from Azure Data Lake Storage Gen 2, and these interactions and manipulations are being made easier with each release.

    Taking what we understand about the overall goals of Microsoft, the centralization around a hub data and activity begins to not just make sense, but be a pivotal part of enabling future objectives to grow and be accessible to every business. Getting “All” of your business data in a single location for analysis will allow you to leverage current and future services to enhance and make use of AI and other technologies quickly, more efficiently and at a much lower cost.

    Power BI Dataflows is the first step in integrating the business into this ecosystem. Power BI Dataflows leverage a familiar product in Power Query, to connect to many sources and perform Extract, Transform and Load operations. They allow flexibility to map data to existing data entities and create new entities that have the potential to streamline and consolidate data silos. These objects that are the result of data flows are stored as CDM folders in Power BI.

    CDM Structure
    CDM Structure

    Two main things to hit here: First, a CDM folder consists of a CSV file for your data, and a model.json structure for metadata definition. Second, “in Power BI” means Azure Data Lake Storage Gen 2 behind the scenes, Microsoft just creates it for you so you don’t need it as a separate service if you aren’t using it for anything else.

    Where this new feature gets exciting is when it is used with your own Azure Data Lake Storage Gen 2. Power BI can connect to your existing Azure Data Lake Gen 2 storage instead and the CDM folders will be put there. This brings the business user into the Enterprise space and allows IT, Data Scientists and business users to collaborate in a single data repository. In addition to the above, we’ve already heard earlier this year that all of Dynamics and now 3rd party line of business and collection tools like SAP and Adobe will also plug into the Azure Data Lake Storage Gen 2 using the CDM folder structure. This means data will be constantly being added to the entities themselves. Power BI Dataflows offer up a unique opportunity to bridge some of the widest gaps that exist between business and IT in the data space.

    CDM Architecture
    CDM Architecture

    For more details on how to use data flows be sure to check out Matthew Roche’s video here -> https://www.youtube.com/watch?v=0bJpCVj3JfQ

    And for the full technical details, take a look at the “Power BI and Dataflows” Whitepaper here by Amir Netz -> https://docs.microsoft.com/en-us/power-bi/whitepapers

    In short order, to be at the top of the competition you’ll have to use Artificial Intelligence to be competitive and stay relevant, and I assume Mixed Reality is going to be a part of that as well. I would argue that what we are seeing here are the building blocks for that future and the efforts to adopt these services will allow us to make exponentially faster gains in analysis and decision making that will give businesses significant competitive advantages. Power BI is front and center in this endeavor as the analytics platform, and that should make any user of the tool excited indeed.

    The preview of Power BI Dataflows is out, based on how these pieces are falling into place across the board, and understanding the direction of Microsoft based on where the ship is being steered, I have a strong inclination that we’re going to be busy re-architecting solutions very soon and that platforms of services will allow businesses to make even more rapid innovations and advancements in their data journey’s. Power BI has already made for a fun ride, but this last month has me feeling like I may have just strapped a rocket to my back that is now being prepped for ignition.

    This is an opinion piece, and as such, I reserve the right to change my opinion as more information is learned. That being said, I’d love to hear feedback from you the reader if you have any on the subject.

  • Intro to Guy In a Cube

    Intro to Guy In a Cube

    Kicking off my video series for PowerBI.Tips I have to give incredible props to Adam Saxton.  Adam is a Microsoft Employee who creates THE BEST content for PowerBI.  There are a lot of videos out on the internet that are interesting and helpful to learn from.  However, Adam takes it to another level.  The videos are relatively short and packed with useful information.  Below is the introduction video to Adam who is The Guy in a Cube.

    I will be definitely sharing more videos from Adam in the future!