Tag: Import Data from Excel

  • Using R Visuals in Power BI

    Using R Visuals in Power BI

    For those of you who have been hanging around PowerBI for a while you have likely heard about integration with R visuals.   No, this isn’t a twisted dream where Power BI now ships with Pirates… Rather, this has been a highly untapped feature.

    In a brief summary R or as it is known on its site R Project for Statistical Computing, is a statistical open source software package that enables mathematicians, statisticians, or data scientists to quickly calculate complex analysis.  It is the tool of us super nerds.  Now R by it’s self isn’t super powerful, it’s the numerous packages that have been developed by people way smarter than me that can do very amazing functions.  Packages include functions for forecasting, math functions, statistic functions and best of all charting functions.  Well, this may be fine and dandy so what?  Well here is the best part.  Microsoft has chosen to integrate and support various releases of R into it’s tools.  For example R can now be leveraged within SQL server 2016, and now visuals built in R can be leveraged in Power BI Desktop and PowerBI.com.  R can also be used to transform and prepare data during a date set load.

    The important note here is that Microsoft has released it’s own open version of R.  This distribution is called MRAN, and can be found at this site.  The MRAN has been slightly tweaked from the R Project.  In the Microsoft version of R, (which I will refer to as MRAN) there has been stability fixes and the improved performance (added Multi threaded Performance).

    So enough back ground lets fire this thing up.

    First you will need to install the latest version of MRAN.

    Navigate to the following address https://mran.microsoft.com/ Click the Download button found  at the top middle of the page.

    mran-download-page
    mran download page

    Note: At the time of this Tutorial the current version of MRAN is 3.3.1, it is likely that this will change since Microsoft is constantly updating this site and releasing new stabilized & enhanced performance versions of R.

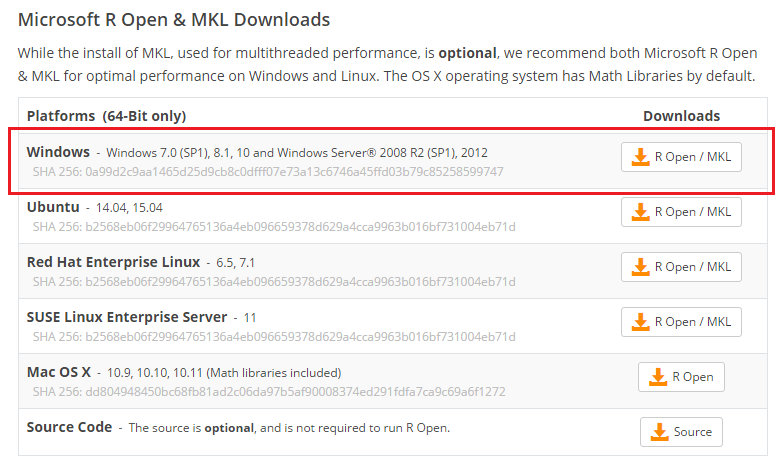
    Select the platform that you will be using to install MRAN on.  I’m using windows, thus I’ll be downloading and installing the top installation version.
     

    windows-platform-of-mran
    Windows Platform of MRAN

    Note: If you need additional installation help you can follow / read the documentation provided by Microsoft.  It can be found here.

    In order to keep this tutorial brief I will assume you know how to install software and have made it through the MRAN installation successfully.  Once installed you should have the following program installed in your start menu.

    Installation of R
    Installation of R

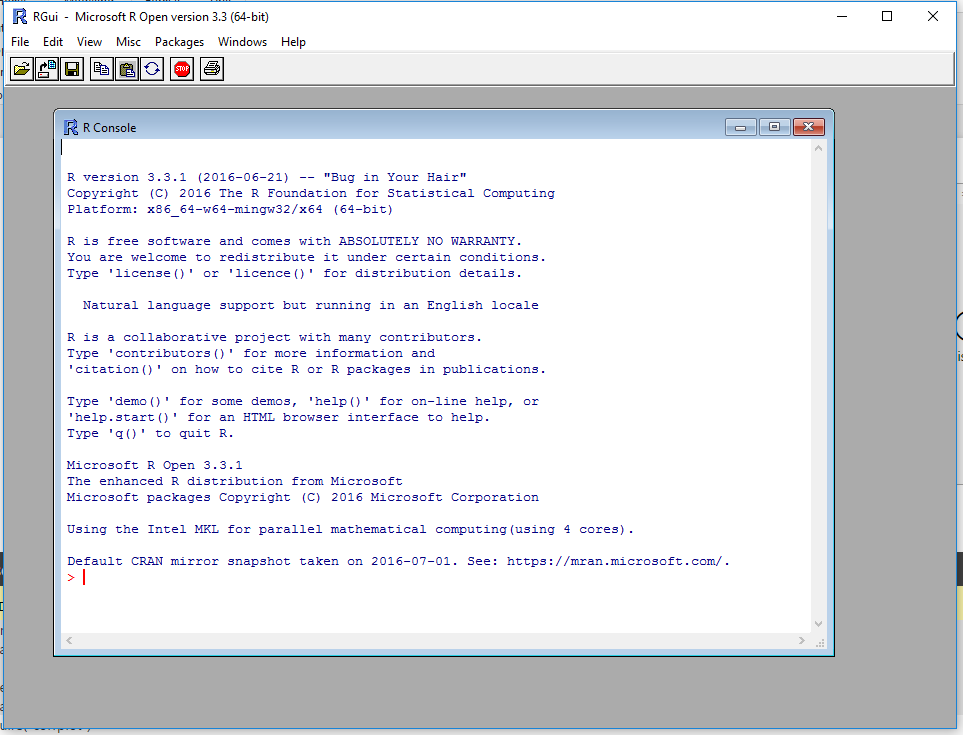
    Run the new installation of R.  The R installation will open up a console window.
    R Console
    R Console

    At the bottom of the console window is a red line where you enter commands.  Enter the following code and press enter.

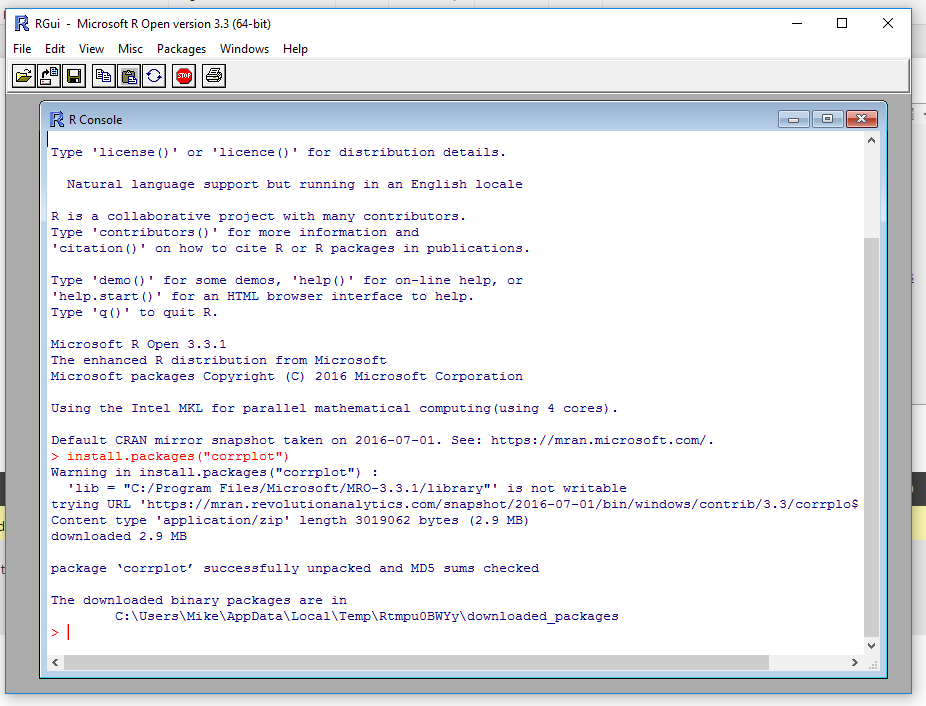
    install.packages(“corrplot”)

    This will install the proper R package that we will use later in PowerBI.  After running this line of code the console will download the correct package and install it on your computer.
    Install corrplot Function
    Install corrplot Function

    At this time you can close the R console program.

    Now, open up PowerBI Desktop.  Once in PowerBI desktop click on the File Button at the top left hand part of the screen.  Next, Click Options and Settings.
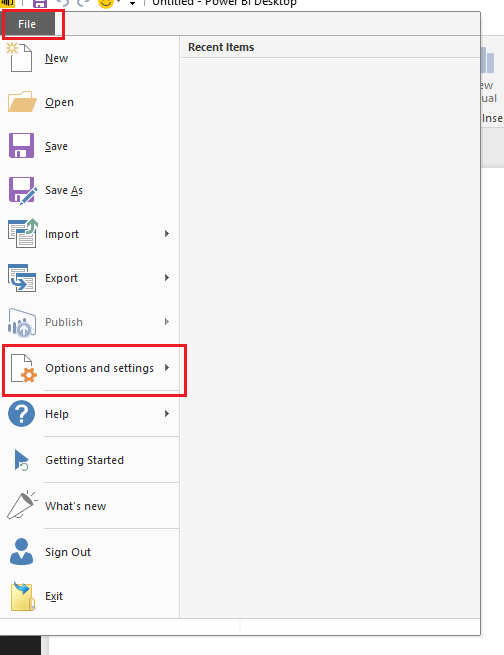
    Powerbi Options and Settings
    PowerBI Options and Settings

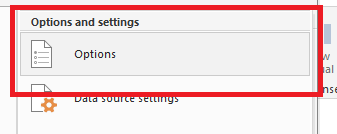
    Then click on the Options button.

    Options Button
    Options Button

    Under the Global options menu on the left verify that your new installation of MRAN is listed.  PowerBI should automatically detect the installation and show the installation with the current version number in the home directory:

    R Home Directory
    R Home Directory

    Seeing the listed installation in the Home Directory verifies that R has been properly installed on your computer. Clicking OK will close the window.

    Data Time!!  Below is the M Language that can be used in your Query Editor.  Copy the code below and enter it into the Advanced Editor found in the Query Editor.

    let
     Source = Excel.Workbook(Web.Contents("https://powerbitips03.blob.core.windows.net/blobpowerbitips03/wp-content/uploads/2016/09/CarDetails.xlsx"), null, true),
     CarData_Table = Source{[Item="CarData",Kind="Table"]}[Data],
     #"Changed Type" = Table.TransformColumnTypes(CarData_Table,{{"Year", Int64.Type}, {"Make", type text}, {"Model", type text}, {"Liters", type number}, {"Hp", Int64.Type}, {"Cylinders", Int64.Type}, {"MPG City", Int64.Type}, {"MPG Hwy", Int64.Type}})
    in
     #"Changed Type"

    Note: If you want to learn how to enter M language code into the Query Editor follow this Tutorial.

    Once you have pasted the code above into the Query Editor it should look like the following:
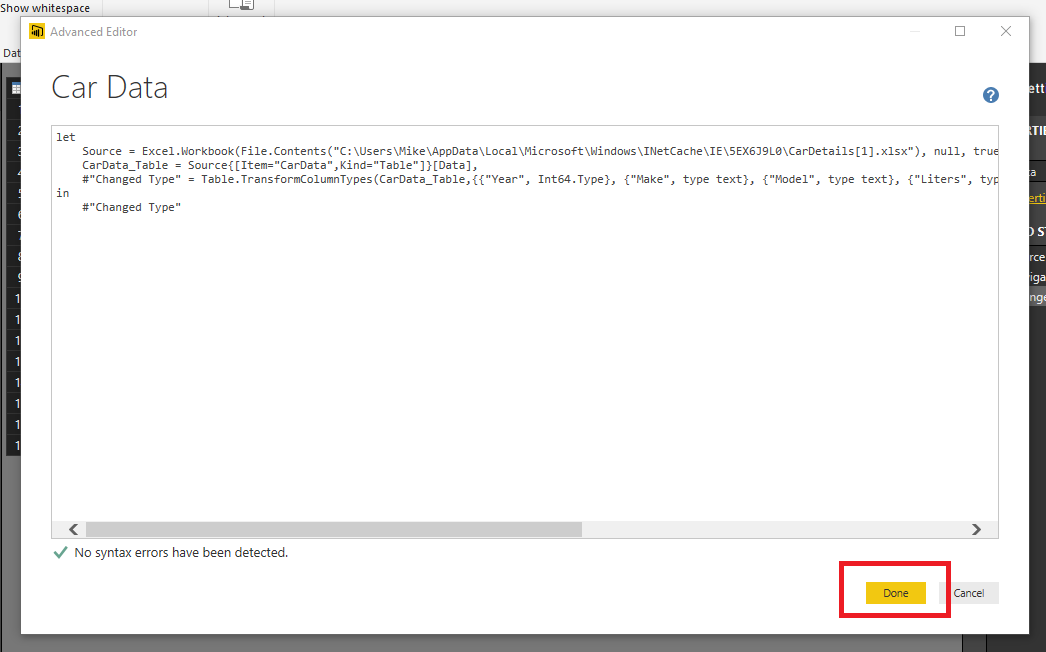
    Advanced Editor
    Advanced Editor

    Clicking Done will close the Advanced Editor and you will have data loaded into the Query Editor.  You must have an internet connection to connect to this data.  Rename your query to Car Data.  Then on the Home ribbon click Close & Apply to load the data into the data model.
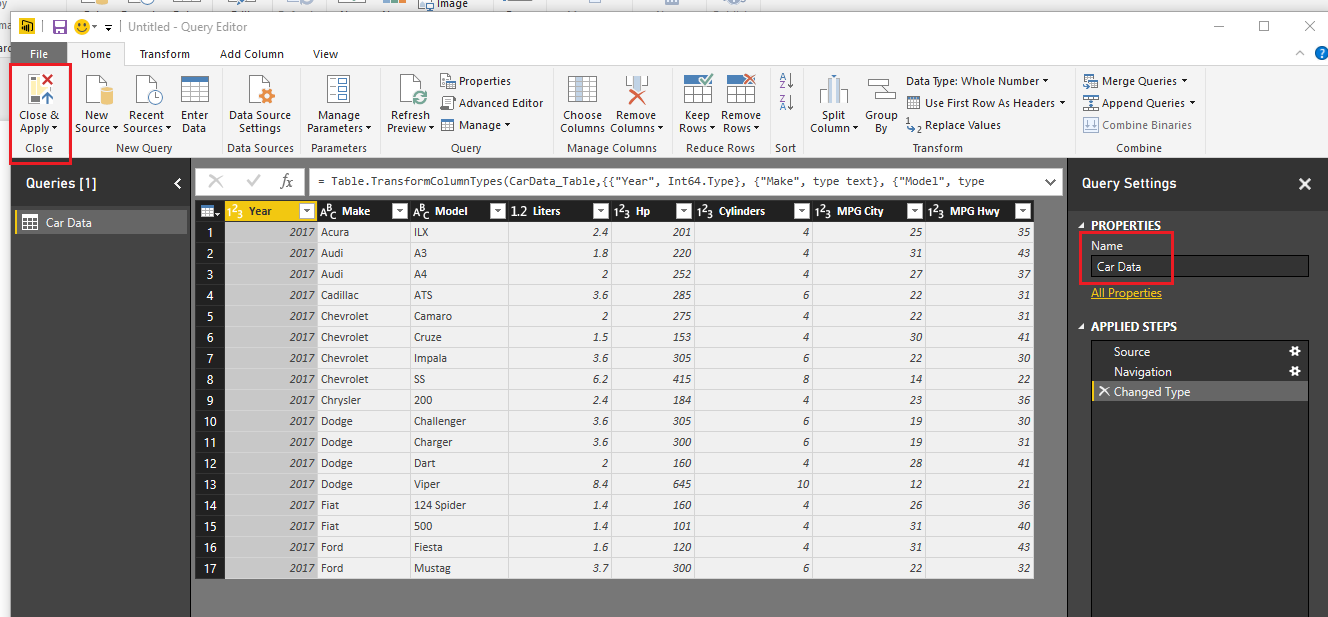
    Car Data in Query Editor
    Car Data in Query Editor

    Generate a simple table visual to see our data in table form:
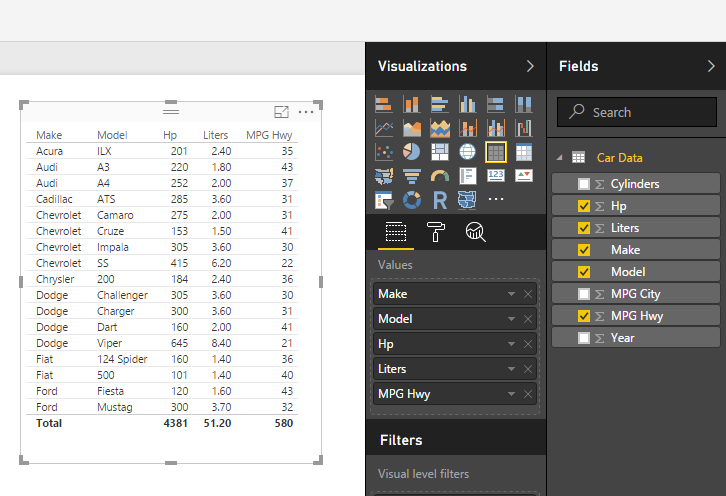
    Table Visual
    Table Visual

    Add an R visual by clicking the R inside the Visualizations bar.  When you click on the R visual you will see a pop-up, click Enable to proceed.
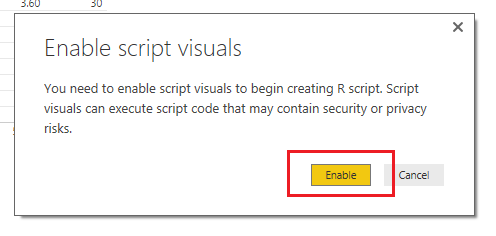
    Enable R Visuals
    Enable R Visuals

    Doing this will open up a visual pane on the page and reveal an R script editor at the bottom of the page window.
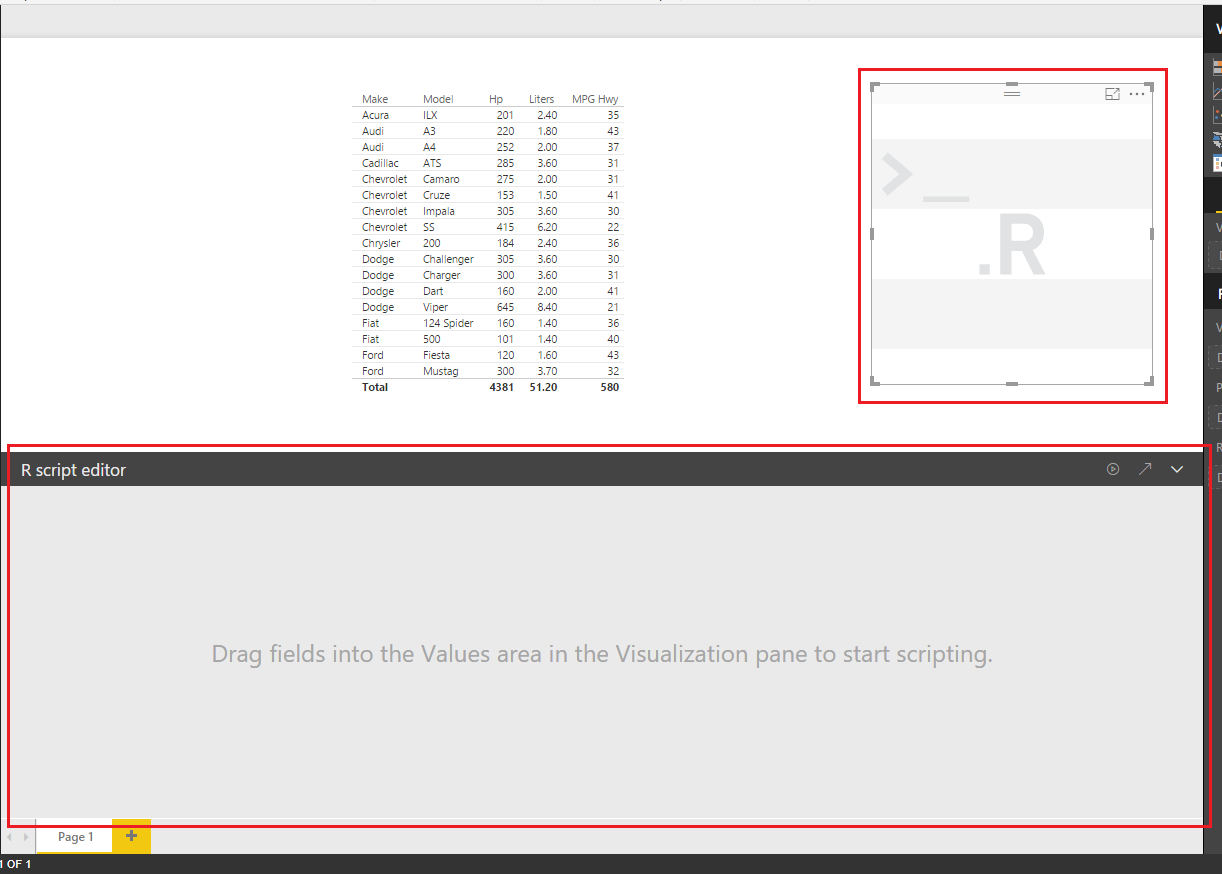
    R Script Editor
    R Script Editor

    While keeping the R visual selected add the following fields to the visual under the Values field:
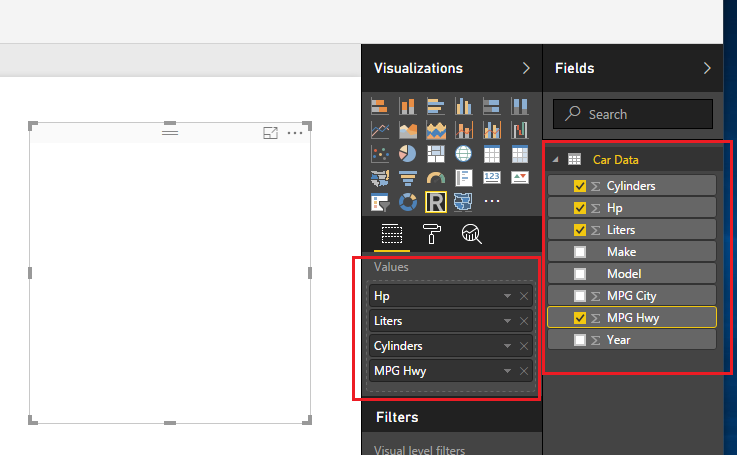
    Add Columns to R Visual
    Add Columns to R Visual

    After adding these fields the R Script Editor will update and reveal code which informs you that your data from the selected columns will be added to a dataset.
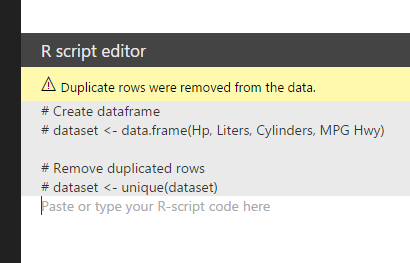
    R Code Script Editor
    R Code Script Editor

    Next add the following code into the white area below the #dataset <- unique(dataset) statement.

    require(“corrplot”)
    library(corrplot)

    M <- cor(dataset)

    corrplot(M, method = “circle”, tl.cex=0.6, tl.srt = 45, tl.col = “black”, type= “upper”, order=”hclust”)

    This loads a package called corrplot which allows you to apply a graph that has a correlation plot between metrics.  The M <- cor(dataset), takes your data runs a function called cor and then saves the results into a new variable called M.

    Next click the Play button icon found on the right of the grey bar on the R Script Editor.
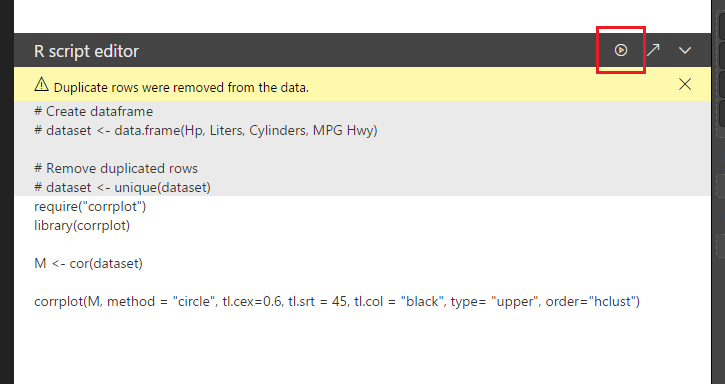
    Running the R Script
    Running the R Script

    Success! You have completed a correlation plot using R within PowerBI.  Nice job.
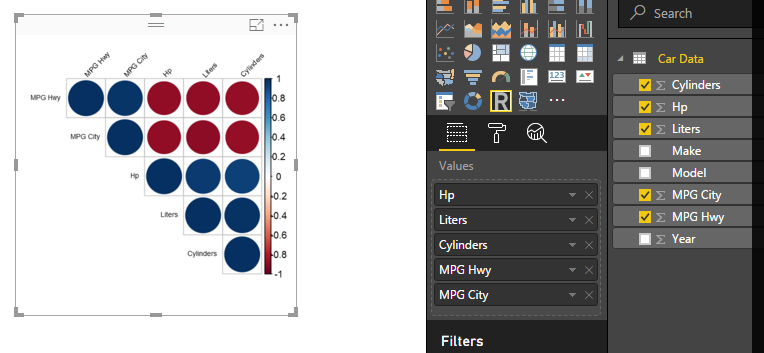
    Final Plot
    Final Plot

    Bonus:

    If you want to get fancy with this correlation plot you can change the circles to the actual correlation values.  Change the last line of the R Script Editor code to the following and press the run script button:

    corrplot(M, method = “number”, tl.cex=0.6, tl.srt = 45, tl.col = “black”, type= “upper”, order=”hclust”)

    This removes the circles and then populates the correlation plot with numerical values representing the correlation between the various data features.

    Correlation Numbers
    Correlation Numbers

    The blue numbers represent values that have a positive correlation, while the red numbers represent a negative correlation.  In practical terms the higher the Horsepower  (HP) of the vehicle the lower the Miles per Gallon (MPG) that are realized.


  • Query Editor – Editing M Code

    Query Editor – Editing M Code

    In this tutorial we’ll learn how to copy and paste queries to and from the Query Editor.  When your working in Power BI Desktop often you will need to share and model the data before it can be applied to the visual.  In my experience you’ll need to add a calculated column or break out a date such as 1/5/2016 into the the Year 2016 or Month 01, components to properly display a visual.

    We will start off with from a prior example where we build a shaded region map.  The tutorial to create this Power BI Desktop file is located here.

    If you want to cheat and download the final PBIX file you can download and open the zipped file here: Regional Filled Map Example

    This file was made in Power BI Desktop April 2016 version, 2.34.4372.322, download the latest version from Microsoft Here.

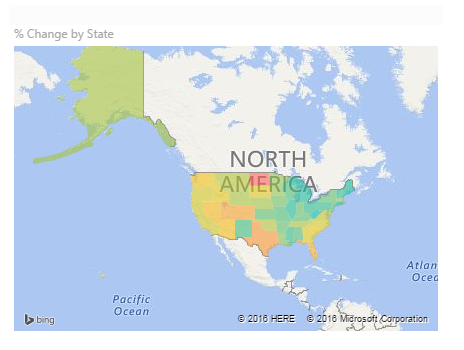
    Open the zip file that you downloaded and extract the file inside labeled Regional Filled Map Example.  Open the file.  Once you’ve opened the file on page 1 of the you see a map of the united states that looks similar to the following.

    Opened File with Map
    Opened File with Map

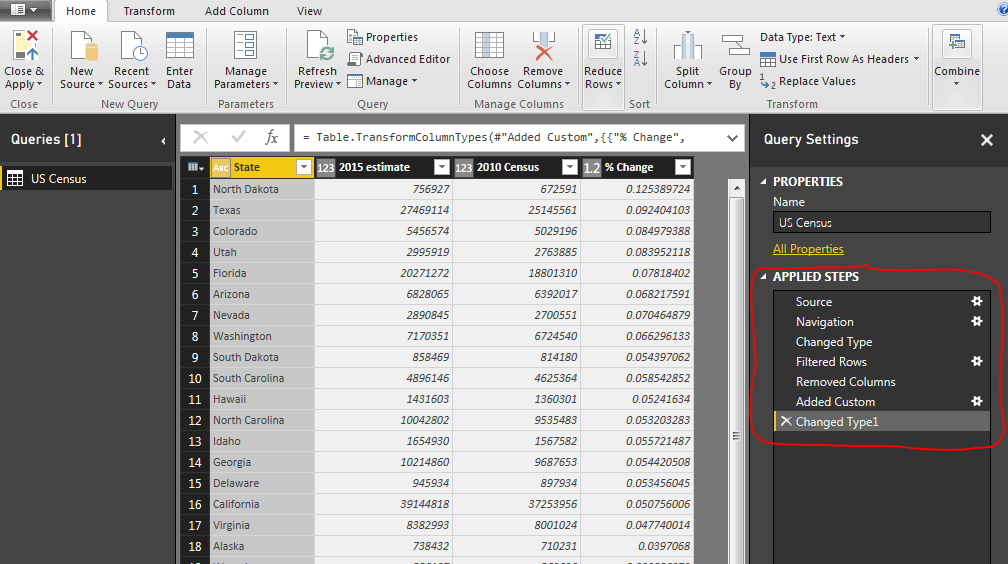
    Now we well enter the query editor.  Click on the Edit Queries on the Home ribbon.  You opened the Query Editor.  In this window we shape and model the data so we can properly visualize it on the pages.  Couple of things to notice here.  Every time you press a button on the ribbon, the query editor generates an Applied Step.  Each step writes a line of M code which transforms the data as it is loaded into the computer’s memory.   In this case we have (7) seven steps starting at Source  and ending with Changed Type1.

    Query Editor Revealing Applied Steps
    Query Editor Revealing Applied Steps

    We want to expose the code that is begin generated at every step behind the scenes.  Click on the View ribbon and then click on the button called Advanced Editor.

    Query Editor - Advanced Editor
    Query Editor – Advanced Editor

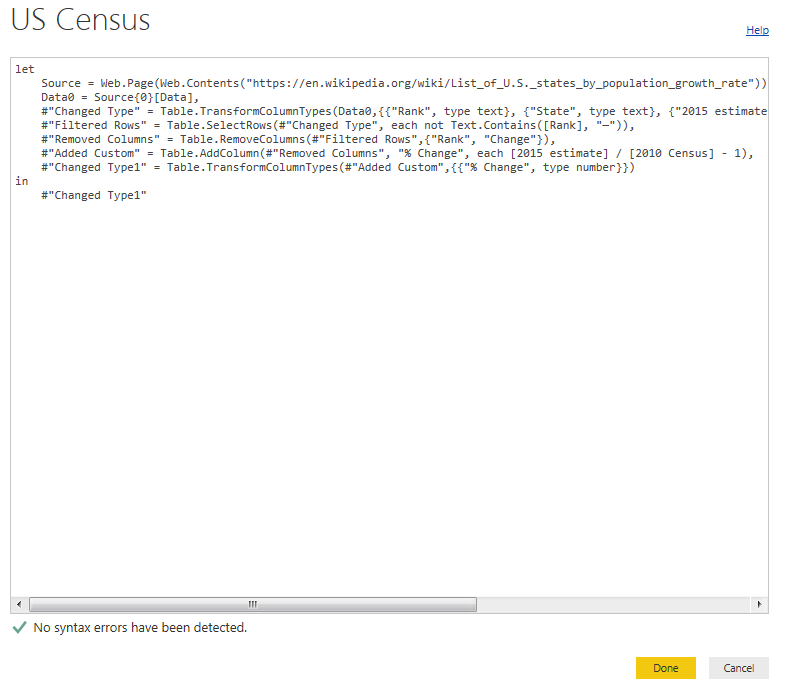
    Opening this window reveals the M language code that is generating each Applied Step we saw earlier.

    Note: some of the steps we saw earlier such as Filtered Rows had a space in it. In the query editor any applied step had a space in the name gets the added #”” around the applied step name.  Thus, in the query editor Filter Rows would be #”Filtered Rows”.  The hashtag and the quotations define the complete variable.  If you changed the name of the applied step to FilteredRows, with no space.  In the Advanced Editor you’d only see the step labeled as FilterRows, no hastag or quotations needed. 

    Now that the M language is revealed you can made modifications to the code.  In cases where you want to make a function you would do so in the Advanced Editor.  For our example today select all the code and copy it to the clipboard using the keyboard shortcut CTRL+C.  Click Done to close the window.

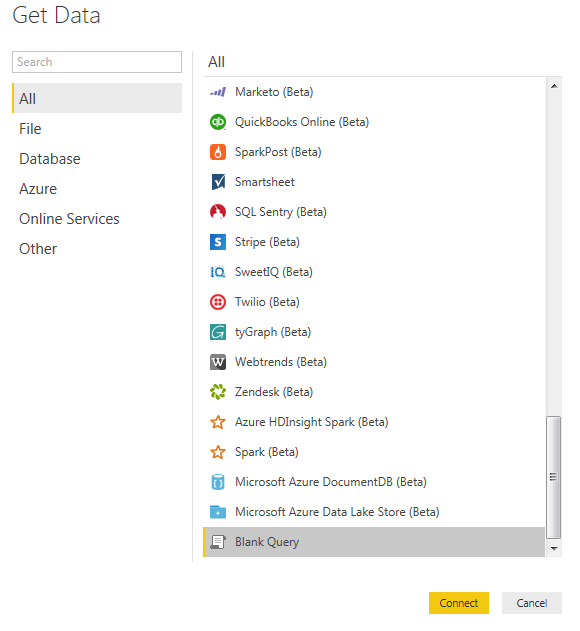
    Now lets copy that code into a brand new query.  Click the Home ribbon, then click New Source, scroll all the way to the bottom of the list and select Blank Query. Click Connect to start a blank query.

    Get Data - Blank Query
    Get Data – Blank Query

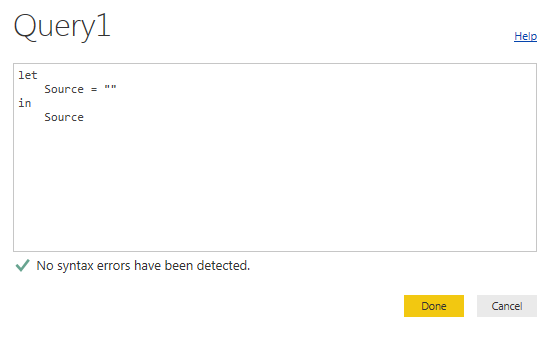
    A new Query will now open up.  Click the View ribbon, then click Advanced Editor.  A blank editor window will open.

    Blank Query
    Blank Query

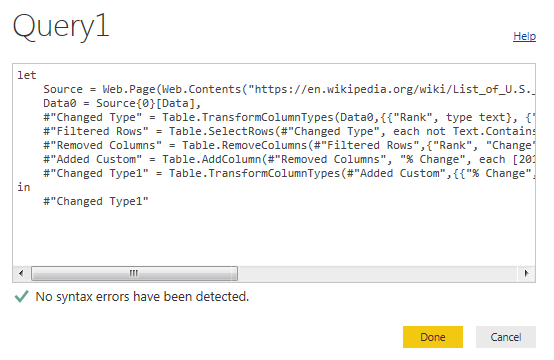
    Paste the code we copied earlier into this window.  Now the new Query1 should look like the following:

    Paste Code in to Advance Editor
    Paste Code in to Advance Editor

    Click Done and the new query will now load.  It is that simple, now we have two identical queries.

  • Map it, Map it Real Good

    Map it, Map it Real Good

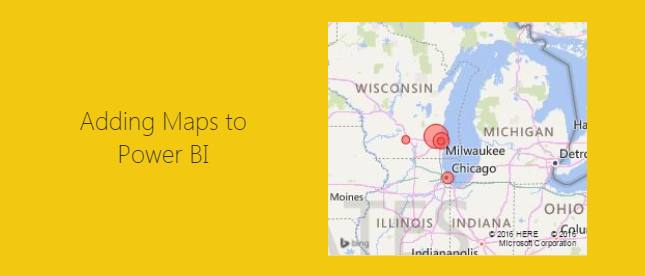
    This tutorial is a real simple mapping exercise.  I was talking with a colleague today about Power BI and I was challenged to map something using latitude and longitude.  I had played with mapping before but not using latitude or longitude.

    I’d have to say if you want to impress someone with your PowerBI skills adding a map is a good way to do so.  Typically this a functionality that you can’t add into excel, well at least not with out some serious effort.

    Alright, here we go..

    Resources for this project are:

    • Power BI Desktop (I’m using the March 2016 version, 2.33.4337.281) download the latest version from Microsoft Here.
    • Excel file with a table in it with our location information that can be downloaded here: Locations Data Set

    After downloading the Locations Data Set, Open up PowerBI and load the Excel file into Power BI.  If you need to learn how to load Excel files you can follow the loading excel tutorial.

    Click the Get Data on the Home ribbon.  Select the first option Excel and click Connect at the bottom of the Get Data window.

    Navigate to the downloaded file called Locations.xlsx and open the file by clicking Open in the bottom right hand corner.

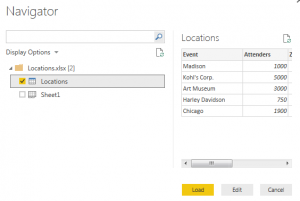
    Next, the navigator window will open.  Select the table (denoted with the grid with a blue top header) called Locations.  Then Click Load to load the data into the data model.

    Navigator Window
    Navigator Window Selection

    Note: there are two different icons in the Navigator window. One is called Locations which is a Table within the Excel document.  While the other is called Sheet1, which is simply the first sheet in the excel workbook.  For Future references it is much easier to make tables in excel and use them to load data in to PowerBI than using just a worksheet.  So whenever possible try to form your data in Excel into Tables.  When loading a table the headers of the table automatically load into the column names in the PowerBI data models.

    We now have loaded the data into a new Table in PowerBI called Locations.

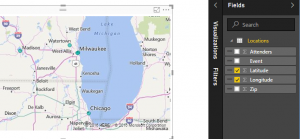
    To make the map check the boxes for Latitude and Longitude.  Power BI intelligently understands that latitude and Longitude are mapping functions and we are now presented with a map with tiny blue dots.

    Map from our Data
    Map from our Data

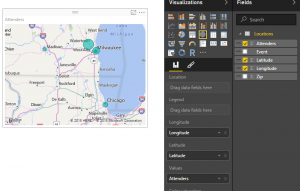
    Lets add some more data to enhance the map.  We can change the size of the circles at each location by dragging the column called Attenders over to the Values field for this visual.

    Change Bubble Size
    Change Bubble Size

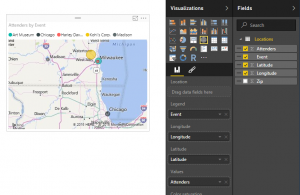
    We have now changed the size of the circles relative to each other to show the number of people that we saw at each location.  To add color to the map drag the column called Event to the Legend option of the visual.  This yields a map that now has each circle with a different color according to the event name.

    Colored Bubble Map
    Colored Bubbles on a Map

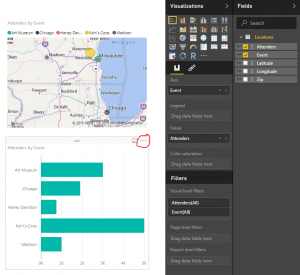
    To enhance our visual further we will add a bar chart with the total count of attenders per event.  To do this click any where on the visual page (this will de-select the map visual on the page).  Now click the Event column and then the Attenders column.  This will present you with a table list of events and the corresponding attendees.  Leaving the table visual highlighted click the Stacked Bar Chart which is in the upper left hand corner of the Visualizations window.

    Adding a Bar Chart
    Adding a Bar Chart

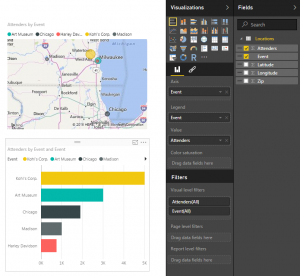
    I circled the triple dots on the bar chart.  Click the triple dots and a menu will appear. First click Sort By, then click Attenders.  This will sort the attenders in descending order from the largest amount at Kohl’s Corp. down to Harley Davidson.  Drag the column labeled Event to the visualization option called Legend.  This colors the bar chart.

    Colored Bar Chart
    Colored Bar Chart

    Note: The colors in the bar chart match the colors in the map we made earlier.  This build uniformity in your reports and when your filtering items colors across visuals make sense.

    Take some time to click on each of the bars on the bar chart.  Notice how the map re-draws with only the data for that selected item.  To select multiple bars on the bar chart hold the CTRL button and click on the multiple bars.

    Nice job.  We have finished the mapping tutorial.  Share if you liked it below.

  • Manually Enter Data

    Manually Enter Data

    There are often times when you need a small data set in order to make a visual behave exactly how you want it to.  This may mean you need a small table to represent a range of numbers or text values.

    Here are the Resources for this tutorial:

    • Power BI Desktop (I’m using the March 2016 version, 2.33.4337.281) download the latest version from Microsoft Here.

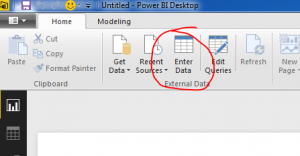
    To enter your own data Click the Enter Data button on the Home ribbon.

    Enter Data
    Enter Data Button

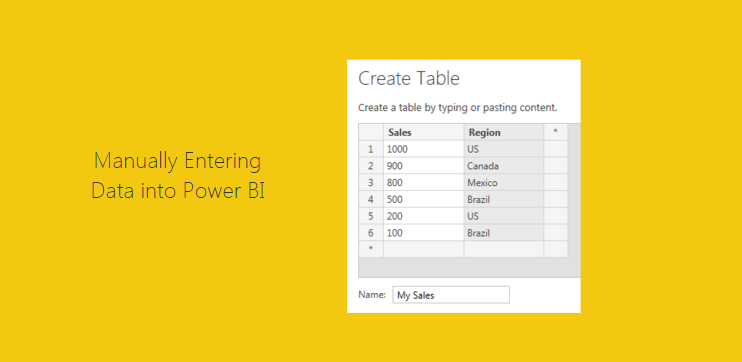
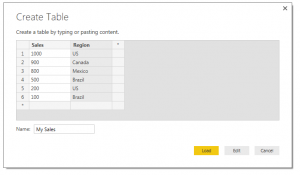
    Next you are prompted with the Create Table window.  In this window you are given the layout of a unfilled table.  To begin entering data you can click in the first cell in Column one and start entering data.  By pressing enter a new cell will populate below.  You can Rename the column by double clicking the column name.  To add a second column you Click on the symbol next to your existing column.  Finally to edit the table name you can type in the desired table name in the Name input box in the bottom left hand portion of the window.

    Create Table
    Create Table Window

    Finally, you can either to choose to Load the data as is or Edit the data to make additional changes (this can be useful to edit the data types of each column or to populate equations in subsequent columns).  For the sake of this tutorial we will simply load the data.  Click Load to load the data into the data model.

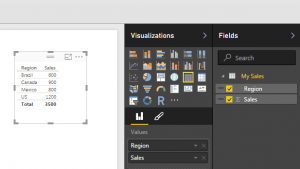
    Now drag over the columns into the page view to begin generating visuals.  By default PowerBI makes a table of data to show you the values you just entered.

    Sales Table
    Visual of Sales Table

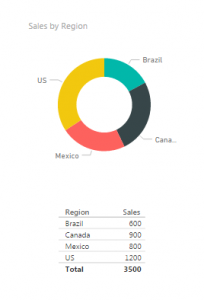
    Select the table visual (you know it is highlighted when it has the trim boarder as shown above) and Click the Doughnut Visual.  This transforms the data into a doughnut, and who doesn’t like a nice data doughnut?  Click anywhere in the page to de-select the new doughnut visual.  Add a second table by dragging over he Region and Sales columns.  We can now see the pretty graphic and the numbers supporting that visual.

    Visuals
    Visuals Made with our Custom Data

    I bet you didn’t notice that something changed here.   Look closely at the data we see now vs. what we entered earlier.  Go ahead, scroll up, I’ll wait…  Did you catch it?

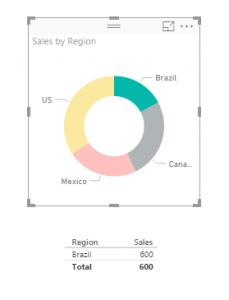
    We now have 5 rows of data but we entered 6 before.  That is because the Sales column is a number column and can be aggregated.  Look in the fields column and you see there is a little sum symbol in front of the Sales column.  This means that this column has a default summarization associated.  To see what is the default summarization highlight Sales by clicking on the column name in the grey area.  Then Click the ribbon titled Modeling, and there it is in the properties section the Default Summarization is Sum.  Every time you use the Sales column it will be summarized in the tables and visuals views.  Our visual table shows Brazil with a total sales of 600, because we had two Regions labeled as Brazil 500 and 100.

    Now you can click on any of the data points in the doughnut.  Notice the table automatically filters down to only show the areas you selected.

    Brazil Data
    Data Filtered to only Brazil

    ProTip: you can select multiple selections by holding down CTRL and selecting multiple items in the visual.  You can only do this inside of one visual.  As soon as you click another visual all filtering will disappear.

    Again, I hope you enjoyed this quick tutorial. If you liked it make sure you share it below.

  • Import an Excel file into PowerBI

    Import an Excel file into PowerBI

    We are going to kick this blog off with a simple example of how to load data from excel into Power BI Desktop.

    Note: I’m a firm believer of always understanding your data.  If you are receiving data files or extracts from an automated system or from an individual, trust me it will make a difference.  So, make sure you understand the source of the data and how the structure of your data may change over time.  For example, you have have a column that has both text values and number values; or the data may add additional columns in the future.  Thus, the data load into Power BI Desktop (PBID) will need to be flexible.

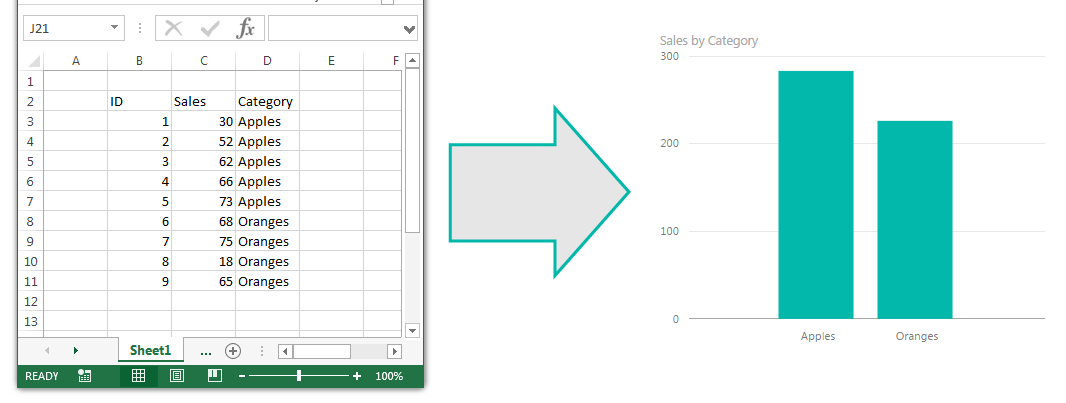
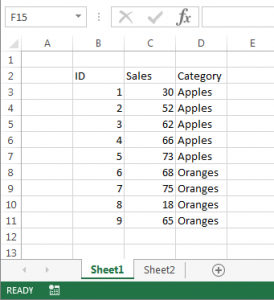
    Lets start off with some simple data in excel:

    Excel Data Image
    Sample of Data in Excel

    We have three columns of data, two have number in it and one has text values.

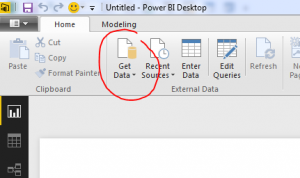
    For now we will close out of excel and jump over to Power BI Desktop.  Once the program loads we will click the Home ribbon then select the Get Data button.

    Get Data Button
    Button for Get Data

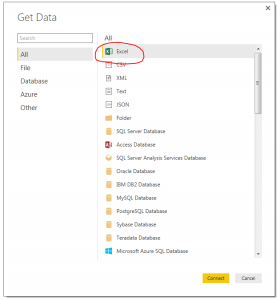
    After pressing the button a new menu will pop up showing us all the sources where data can be ingested from.  The very first item in the list is Excel.  Click the Excel then click the Connect button in the lower right hand corner.

    Excel Data Source
    Select Excel as Data Source

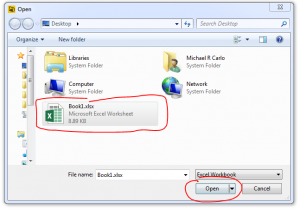
    After clicking Connect a new window will pop up asking for the location of the Excel file.  Navigate to our sample data called Book1.xlsx you can down load the actual file I used here: Book1  I saved my Book1.xlsx file on the desktop of my computer.  Select Book1 and then Click Open.

    Open Excel File
    Open Excel File Dialog Box

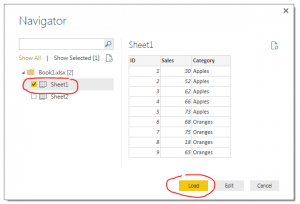
    Next we are presented with the Navigator screen that reveals what is inside the workbook.  There are two sheets.  For now we are only interested in the data on Sheet1.  Select Sheet1 and then click Load.  This will load our data from Sheet1 into the Power BI Desktop data model.

    Navigator Image
    Navigator Selection Screen

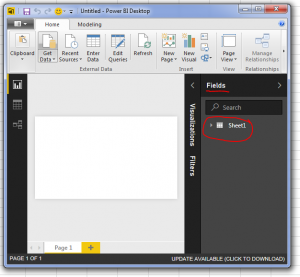
    Now our data has been added to the Power BI Desktop data model.  The data and the various columns we loaded can be found in the tool bar at the far right of PBI called Fields.

    Fields View
    Location of Loaded Excel Data

    Tech Tip: Power BI Desktop (PBI) opening the file and loading the relevant data into the memory of the computer.  This has an approximate 4 to 1 compression ratio.  In practical terms this means that a 100MB file will only consume 25MB of file size in PBI when it is saved.  This is extremely useful as the data model can be quite large when loading multiple data files but the PBI file will compress down to a manageable size.


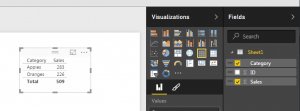
    Make a PBI Table
    Make a Data from Column Sales and Category

    Finally, the Sheet1 data table can be expanded into is respective columns by clicking the triangle next to the table icon.  Finally you can drag and drop the column names into the visualization page to begin making visualizations.  For this demo I used the Category Column and the Sales column to make a table.

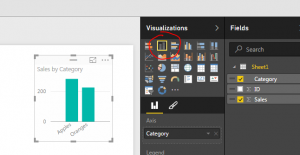
    By selecting a different visualization in the visualizations bar you can change your data table into a Bar Chart.

    Power BI Desktop Bar Chart
    Data Transformed into a Bar Chart

    Well that is it for the first tutorial.  Share your thoughts and comments below.  Let me know if you have any suggestions on what you would like to see next.