Tag: Scrims

  • Keeping it Versatile

    Keeping it Versatile

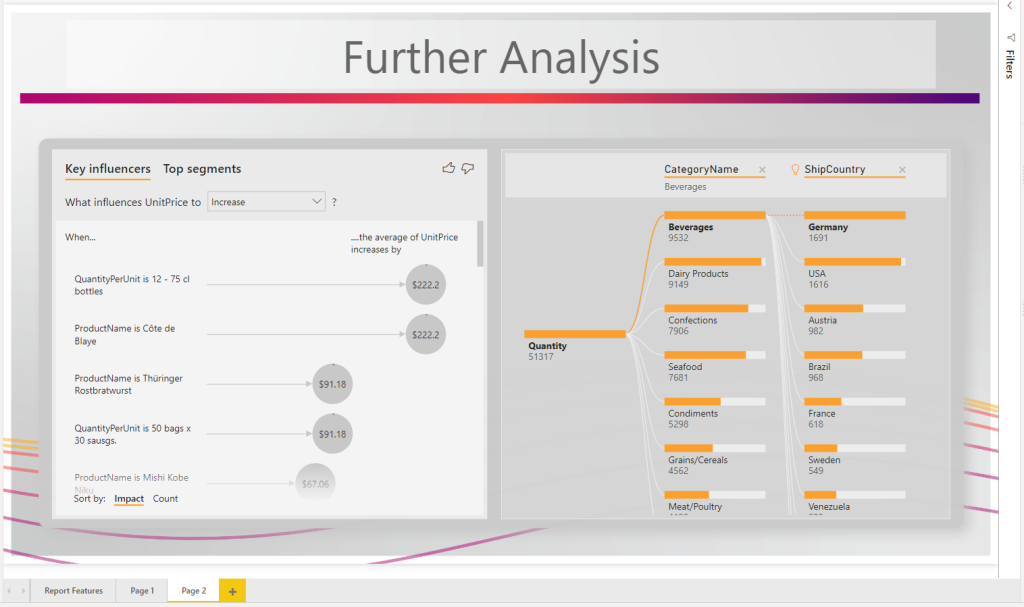
    I was recently working on some new ideas for a Scrim when I stumbled upon something interesting. A scrim is pretty specific in its layout, and this one is no different. The images are set so that the report author can easily snap the visual sizes into the space. This makes the most sense as it is easy and delivers great looking results. However, I believe that some designs will allow us to get much more mileage out of a single Scrim. In this Scrim I have changed the shape of visual spaces and this has led to some interesting outcomes. I’ll be interested if my excitement around the possible use cases for this Scrim are as significant as I think they are. With that said here are some of the biggest highlights of my latest Scrim – Versatile.

    • Gradient background to add depth
    • Transparent background – allows report author to use any background color
    • Visual shapes are curved on two edges
      • Use unique visual shape
      • Use normal square
      • Use area for title
      • Use area for context

    Downloads

    Download this Scrim here:  https://powerbi.tips/product/scrims-versatile/

    For additional details, and how you can implement all the above in this Scrim check out the video below.

    See how to use this Scrim

    If you like the content from PowerBI.Tips, please follow us on all the social outlets to stay up to date on all the latest features and free tutorials.  Subscribe to our YouTube Channel, and follow us on Twitter where we will post all the announcements for new tutorials and content. Alternatively, you can catch us on LinkedIn (Seth) LinkedIn (Mike) where we will post all the announcements for new tutorials and content.

    As always, you’ll find the coolest PowerBI.tips SWAG in our store. Check out all the fun PowerBI.tips clothing and products:
    Store Merchandise

  • Introducing Scrims

    Introducing Scrims

    PowerBI.tips is excited to announce our new tool to help you build the best looking reports, Scrims.

    We’ve built out a fast and easy solution for snapping visualizations into place while giving your reports the extra special look and feel that allows your audiences to be impressed without losing focus on the important stuff. We developed Scrims to give you this shortcut to amazing looking reports

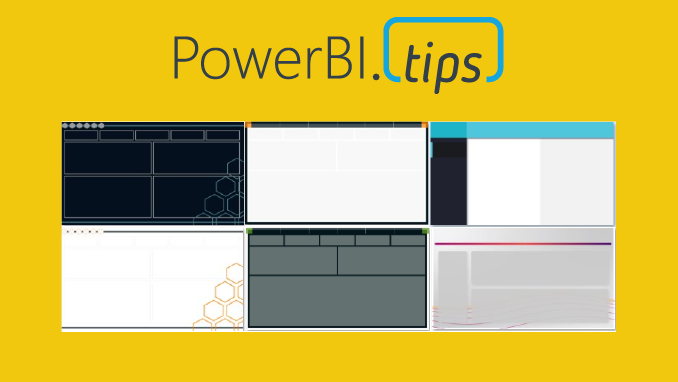
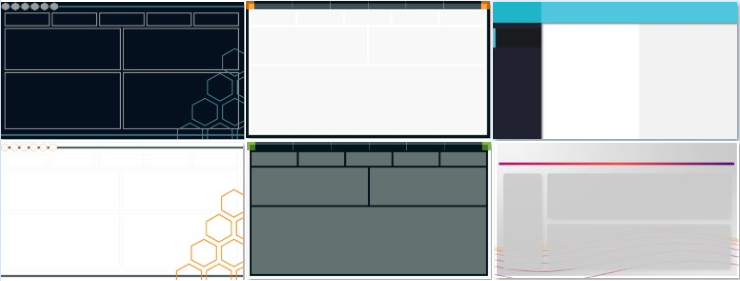
    16:9 (1280 x 720) examples

    What are Scrims?

    A Scrim is a background image that you would use on your Power BI Report pages. Why the name Scrim? The term scrim is used in theater productions. It is a backdrop that is placed on the stage behind the actors. It adds context & engages the audience with the production. We thought this idea crosses over well with Power BI.

    A scrim can change the mood of a theater just like a well designed background image in your report. Scrims were developed to be easily adaptable to different color themes and in each set of offerings we release we’ll be providing you with as many color options as possible.

    Why Do I need One?

    Scrims solve several problems.

    1. The most important problem it solves is time. As BI practitioners ourselves we know the demands that are placed on you. More often then not the visual look and feel gets the least amount of attention due to deadlines. We want all the time you invest in the data and building visuals to impress your audiences by being presented in a beautiful way.
    2. Scrims are designed the same way we developed Layouts. By emphasizing proper design focused on the Gestalt design principles to ensure the end users experience enjoyable and non-distracting reports.
    3. Using a Scrim you will reduce the number of objects on the page. Less elements means faster rendering reports. Here is a blog that tests this by adding more visuals to a page “More Visuals Mo Problems”. Scrims add the illusion of a very large number of objects without a negative impact.

    Scrims come in a Bundle

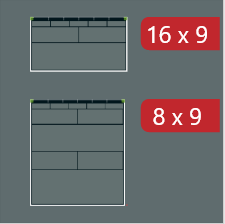
    A Scrim bundle contains a series of images that you can use in any way you want in your Power BI file. Each Scrim will have different page sizes to best suit your report needs. Every Scrim will contain a default 16 x 9 (1280 x 720) aspect ratio. Most Scrim bundles will have additional ratios such as 8 x 9 (1280 x 1440) or 4:3 (960 x 720). You will see the sizes prominently displayed for each bundle with the red tags.

    8:9 (1280 x 1440) examples

    Each bundle contains 6 pages minimum for each size, which means on average you will receive at least 12 pages in each bundle. Each Scrim bundle also includes the color theme that corresponds with it in JSON format to easily upload into your Power BI Report.

    Theme Color example
  • Scrims Instructions

    Scrims Instructions

    Thanks for your interest in our product Scrims. For more details on what is a scrim click this link to Learn More.

    Download a scrim from the products page. You can access all the available scrims here.

    Instructions

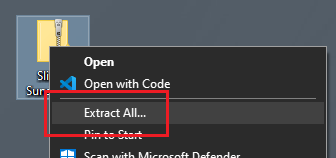
    After downloading, you will have a Zip file stored on your computer. Right Click on the zip file and Select the option Extract All from the drop down menu.

    Right click menu option Extract All

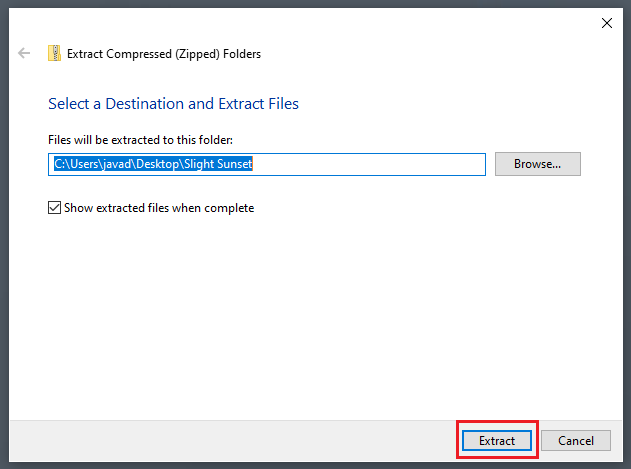
    The extract compressed folder menu will appear. Click on the Extract button found in the bottom right corner of the menu.

    Extract Compressed folder dialog box.

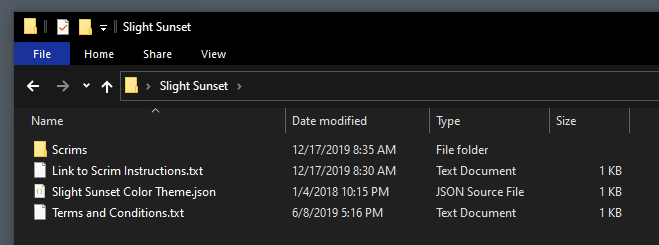
    A new folder will be extracted to the location noted in the previous menu screen. Open the newly created folder. Within this folder you will find all the images for the Scrims and a JSON theme file to use within your report.

    Folder contents, Scrims images, links to instructions, terms & conditions, and color theme file.

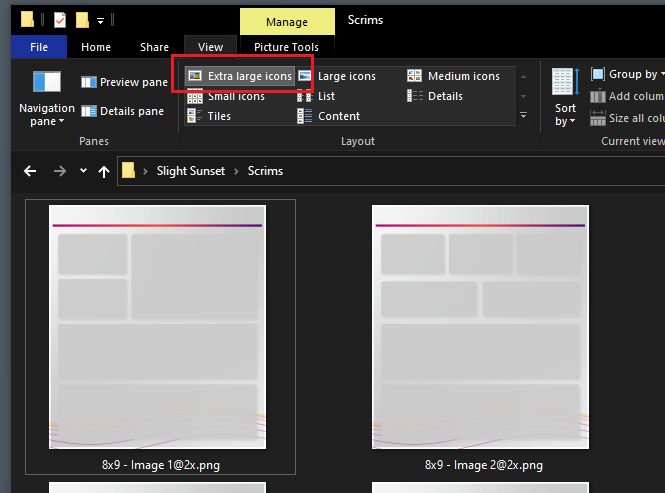
    When working with scrims it is helpful to see which image contains the the correct background layout for each of your pages. I find that it is helpful when reviewing images as Extra large icons. To turn this on, Open the View ribbon in the File Explorer. Then in the Layout window select the option titled Extra large icons.

    Change view of File Explorer to Extra Large Icons

    Add Scrims to Report

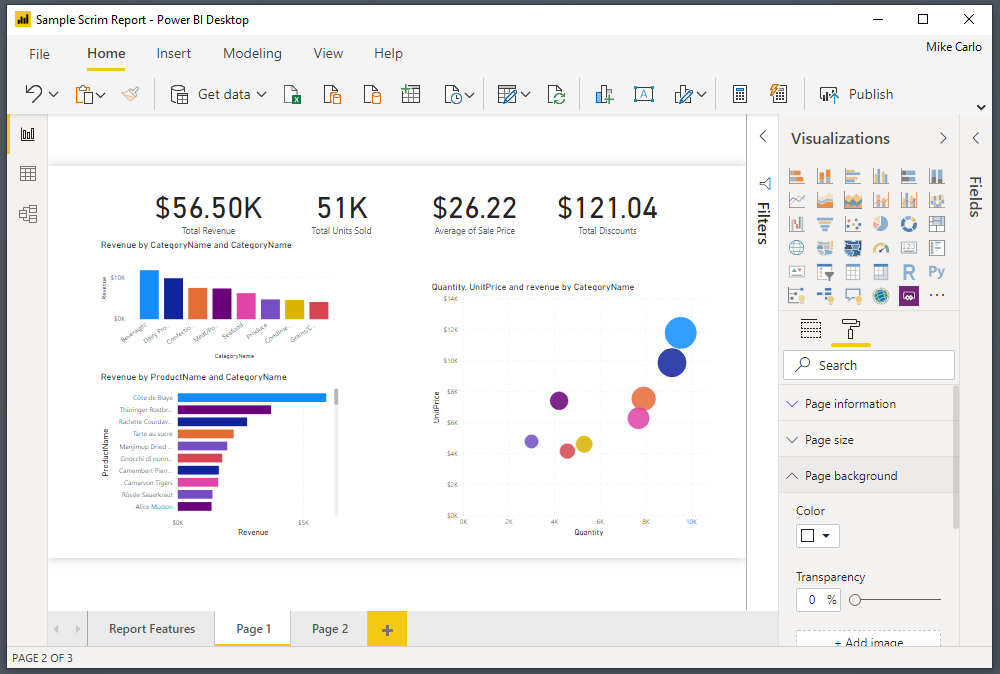
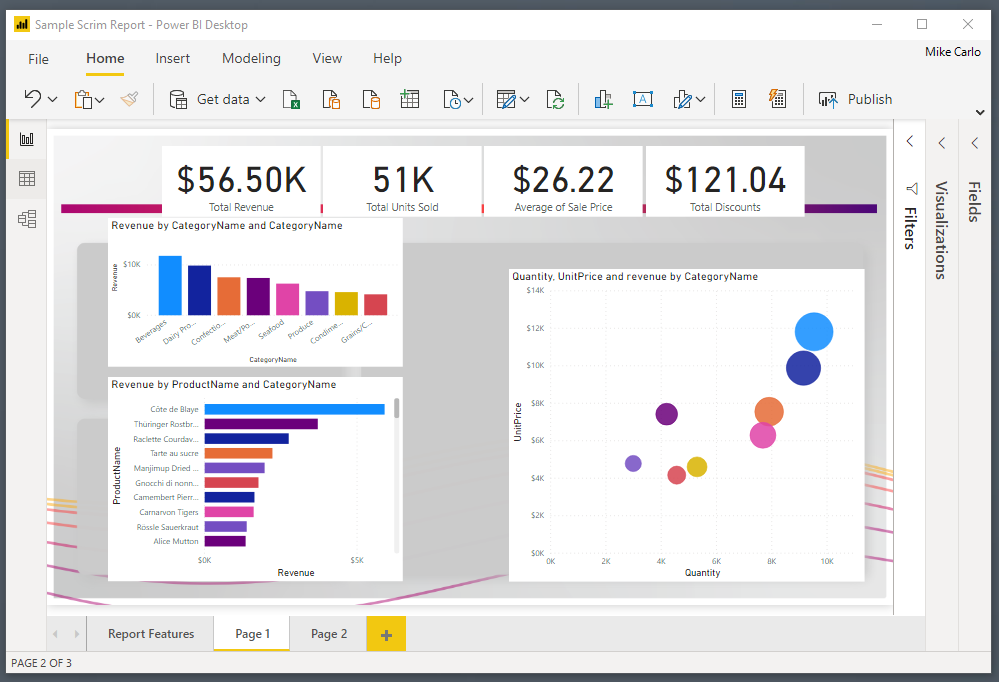
    Open a Power BI report in the Power BI Desktop application.

    Image of a Power BI report in Power bi desktop

    Note: Reports do not necessary have to be brand new. You can use scrims on existing reports. For illustration purposes an existing report was opened with only visuals. The remainder of this tutorial will show you how to add scrims to a pre-developed report.

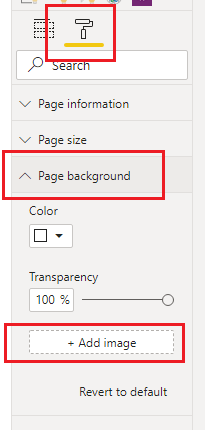
    Click on the Paint Roller button. Then Open up the Page background item in the menu options. Click on the option labeled Add image.

    Note: for these options to appear you have to have a report open and none of the visuals selected on the page.

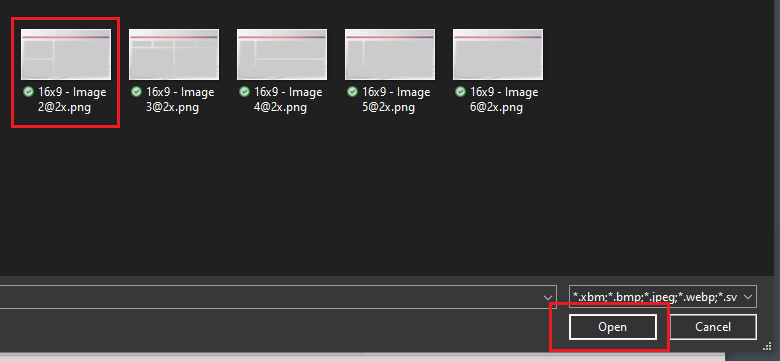
    In the open file selection dialog box pick the scrim that you want to load. Click on Open to load the image to the report page.

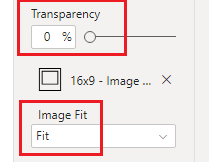
    The image will not initially appear. This is because the default settings for background are set incorrectly for this feature. Change the transparency to 0% and adjust the Image Fit to the drop down option of Fit.

    Note: Images provided in scrims are larger than the report page pixel size. This is because in order for the images to not look blurry we have to supply a larger image. The Fit feature then scales the image back down to the report canvas size but retains a crisp and clean look.

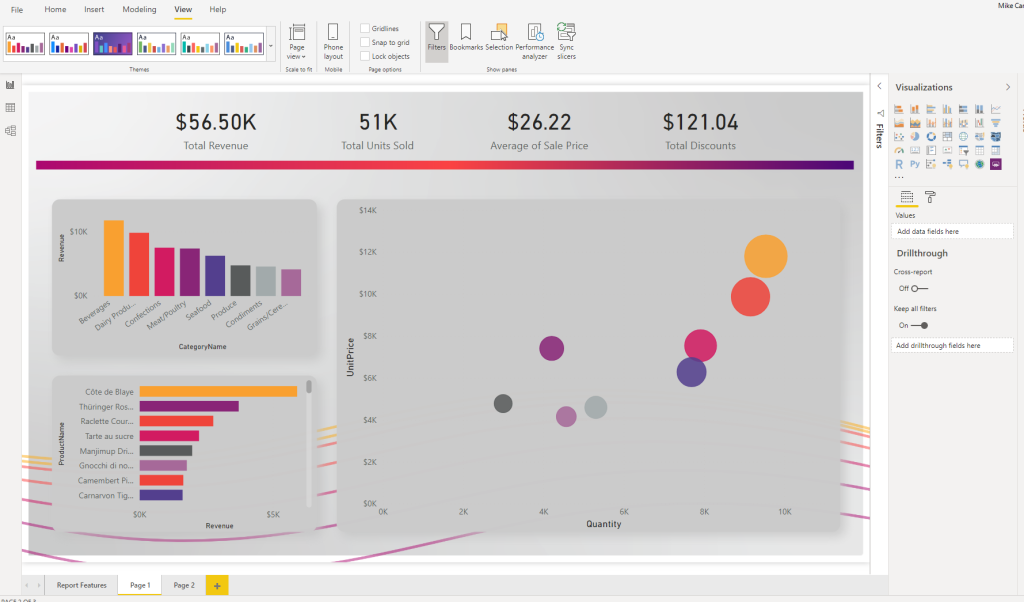
    Our report should now look similar to the following:

    Add JSON Themes

    Initially the visuals will not be formatted for the style of the report. We can control this by using a JSON theme file to pre-format some options for the visuals.

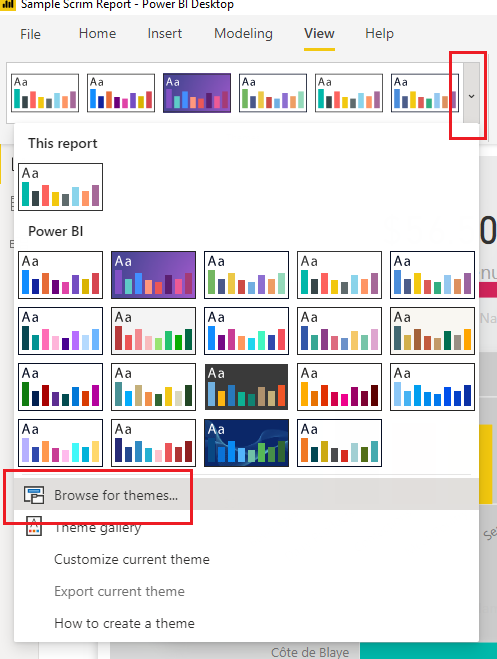
    On the View ribbon, select the Drop Down Arrow icon. Then Select the option at the bottom of the menu titled Browse for themes…

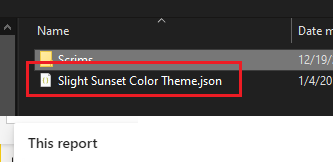
    Navigate to the scrims download folder and add the supplied theme with scrim download.

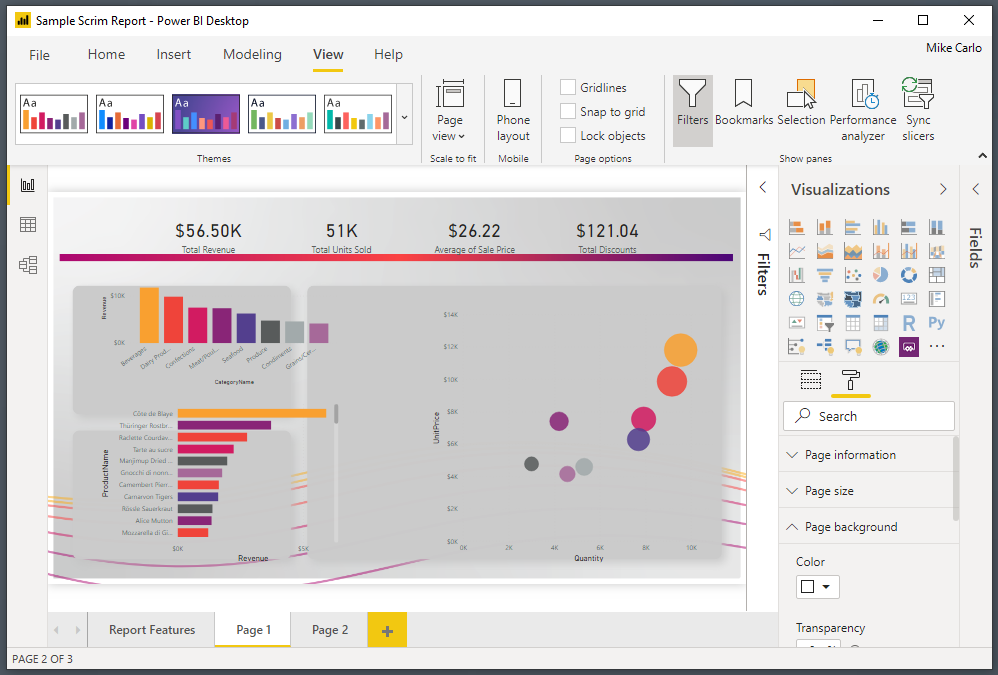
    This will apply formatting for the colors and some Visual style properties.

    Clean up Visuals

    Next Select individual visuals and Align them to the defined areas within the scrim.

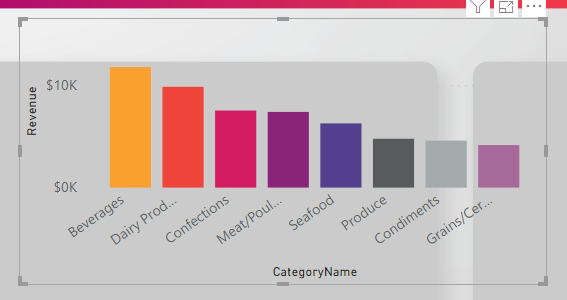
    See sample image below with visuals aligned to the scrim.

    Finalize Report

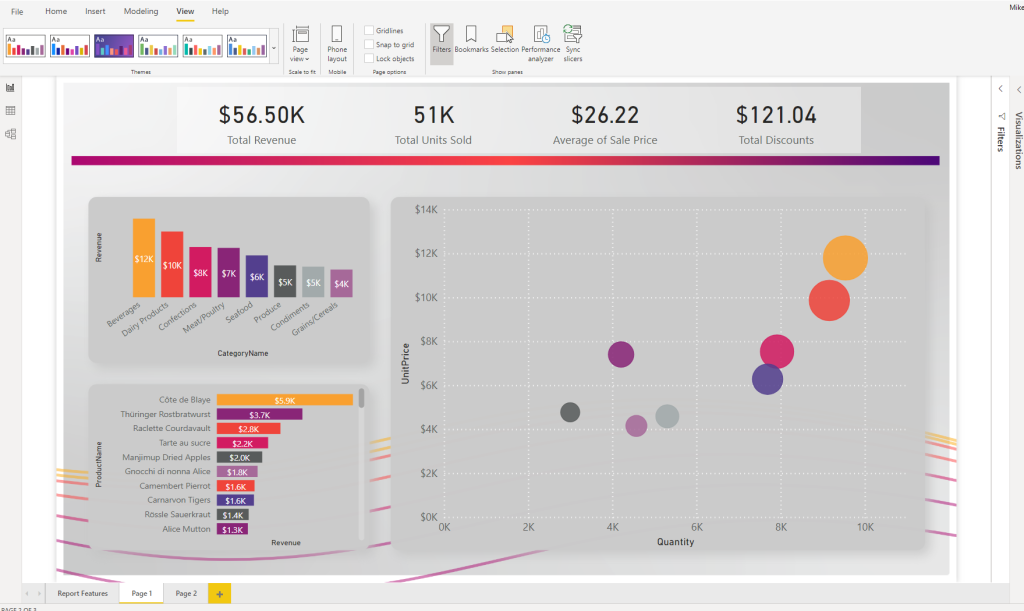
    Apply any additional style properties for your visuals. In the below image the following settings are added for reference:

    • The top 4 cards are grouped and the group
    • The Grouped cards were applied a background of white @ 40% transparency
    • Labels were added to the bar charts
    • Unneeded axis were removed from the bar charts for clarity
    • White lines were added to the scatter chart for x and y axis

    Then rinse wash and repeat for every other page you need to develop.

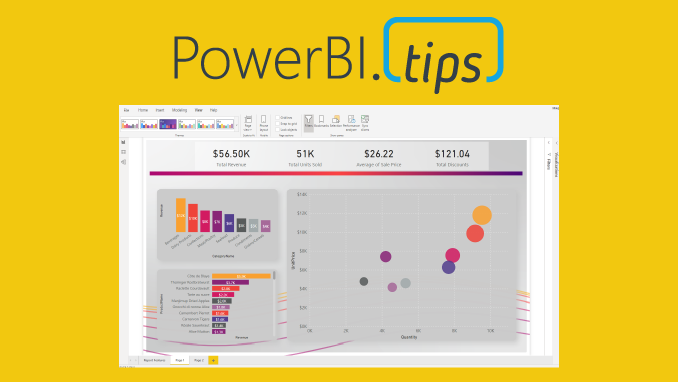
    Here is a completed sample of this report:

    Check out scrims today