October 17, 2016
Pareto Charting in PowerBI
Build a Pareto chart in Power BI using DAX measures for cumulative totals and percentages. Identify which products comprise the majority of your sales.
Tag
28 posts
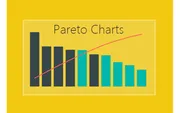
October 17, 2016
Build a Pareto chart in Power BI using DAX measures for cumulative totals and percentages. Identify which products comprise the majority of your sales.
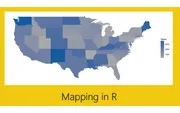
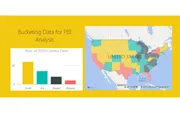
October 10, 2016
Create a US map in Power BI with state labels and year-over-year change indicators using R and ggplot2. Color-coded labels show positive and negative trends.
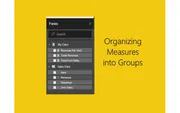
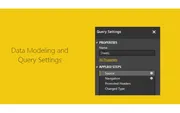
October 4, 2016
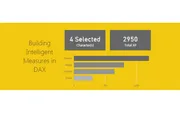
Organize your Power BI data model by creating a dedicated measures table. Group all your DAX measures in one place for cleaner, more maintainable reports.
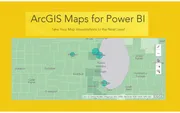
September 30, 2016
Explore the ArcGIS Maps visual in Power BI with heat maps, reference layers, and advanced selection tools. Add demographic overlays like household income.

September 27, 2016
Create beautiful hexagonal bin plots in Power BI using R and ggplot2. Visualize data density with heat map style honeycomb patterns.
September 21, 2016
Create advanced R visuals in Power BI combining area plots, bar charts, and scatter points using ggplot2. Learn how R scripts respond to slicer selections.

September 15, 2016
Get started with R visuals in Power BI Desktop. Install Microsoft R Open, configure Power BI, and create your first correlation plot using the corrplot package.
September 1, 2016
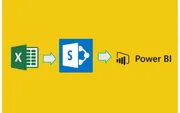
Learn how to connect Power BI Desktop to SharePoint document libraries and load Excel files. Enable scheduled data refreshes with SharePoint O365.
August 31, 2016
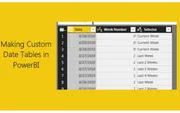
Create a custom dynamic date table in Power BI Query Editor using M language. Build week-based selectors that automatically update when refreshed.
August 30, 2016
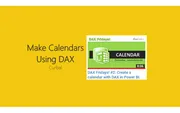
Learn how to create custom calendars in Power BI using DAX with Calendar() and CalendarAuto() functions. Video tutorial from Ruth Pozuelo at Curbal.
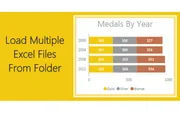
August 10, 2016
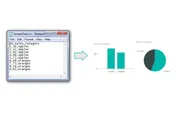
Learn how to load multiple Excel files from a folder into Power BI using a custom function. Combine workbooks with multiple sheets into a single query.
August 4, 2016
Learn how to create a variable query in Power BI to manage file locations. When you move files, update one query instead of changing every source path.
July 28, 2016
Create a smart card visual in Power BI that displays the selected item name when one item is chosen, or shows the count when multiple items are selected.
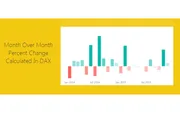
July 14, 2016
Learn how to calculate month-to-month percent change in Power BI using DAX. Use PREVIOUSMONTH to compare current month sales against prior month values.
June 16, 2016
Learn how to automatically load only the most recent file from a folder in Power BI. Perfect for automated reports that receive daily data files.
June 10, 2016
Build a DAX measure that dynamically calculates percent change as you select different items in Power BI visuals. Learn to use DIVIDE and FILTER functions.
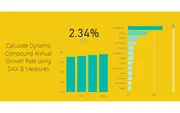
May 27, 2016
Learn how to calculate a dynamic Compound Annual Growth Rate (CAGR) in Power BI using DAX. The calculation updates automatically as you select different data points.
May 19, 2016
Learn how to copy and paste queries to and from the Query Editor using the Advanced Editor. Master the M language to share and model your Power BI data.
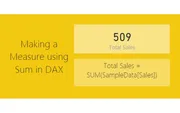
May 7, 2016
Learn how to create measures in Power BI to calculate totals using the SUM function in DAX. Watch how totals dynamically change as you select different data points.
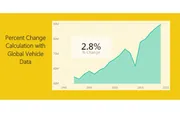
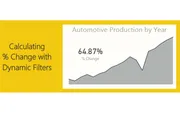
May 2, 2016
Learn how to create percent change calculations in Power BI using DAX measures with practical examples using real-world automotive production data.
April 27, 2016
Learn how to create histograms with custom bins in Power BI using DAX measures to categorize and visualize your data distributions.
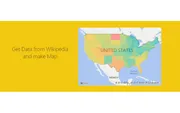
April 20, 2016
Learn how to pull data directly from Wikipedia into Power BI and create a beautiful filled map showing US population growth by state.
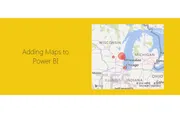
April 14, 2016
Learn how to create impressive map visualizations in Power BI Desktop using latitude and longitude data with this step-by-step mapping tutorial.
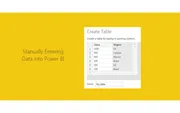
April 13, 2016
Learn how to manually enter data directly into Power BI Desktop to create small tables for your visualizations without needing external files.
April 11, 2016
Learn how to troubleshoot and fix broken file connections in Power BI Desktop when your data source has moved or can't be found.
April 7, 2016
Learn how to load multiple files from a folder into Power BI Desktop using the powerful automated data loading feature that will change how you work with data.
April 1, 2016
Learn how to import CSV files into Power BI Desktop, create tables and charts, and copy visuals to build compelling data visualizations.
March 29, 2016
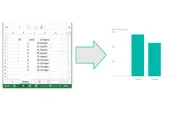
Learn how to load data from Excel into Power BI Desktop with this simple step-by-step tutorial covering the Get Data function and basic visualizations.