


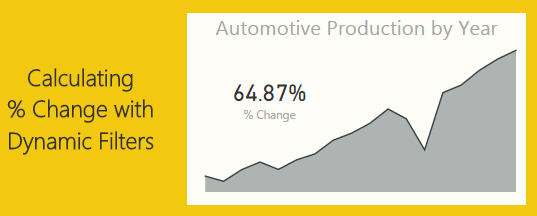
This tutorial will produce a measure that will dynamically calculate a percent change every time an item is selected in a visual. The previous tutorial can be found here. In the previous tutorial we calculated the percent change between two time periods, 2014 and 2013. In practice it is not always desirable to force your measure to only look at two time periods. Rather it would be nice that your measure calculations change with changes in your selections on visuals. Thus, for this tutorial we will add some dynamic intelligence to the measures. Below is an example of what we will be building:

First here is the data we will be using. This data is the same data source as used in the previous % change tutorial. To make things easy I’ll give you the M code used to generate this query. Name this query Auto Production.
let
 Source = Web.Page(Web.Contents("https://en.wikipedia.org/wiki/Automotive_industry")),
 Data0 = Source{0}[Data],
 #"Removed Columns" = Table.RemoveColumns(Data0,{"Change", "Source"}),
 #"Changed Type" = Table.TransformColumnTypes(#"Removed Columns",{{"Production", Int64.Type}, {"Year", Int64.Type}})
in
 #"Changed Type"
Note: the code shown above should be added as a blank query into the query editor. Add the code using the Advanced Editor. Another tutorial showing you how to add advanced editor code is here.
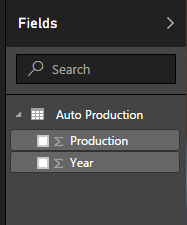
Once you’ve loaded the query called Auto Production. The Field list should look like the following:
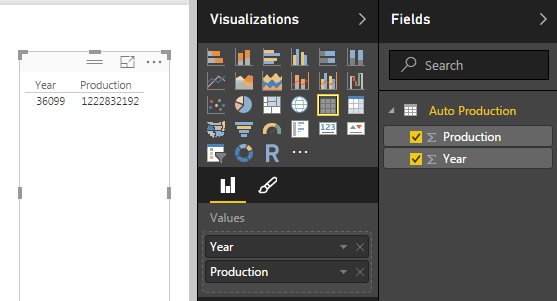
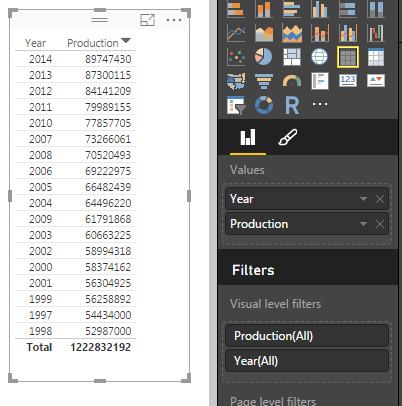
Next add a Table with Production and Year. this will allow us to see the data we are working with. When you initially make the table the Year and Production columns are automatically summed, thus why there is one number under year and production.
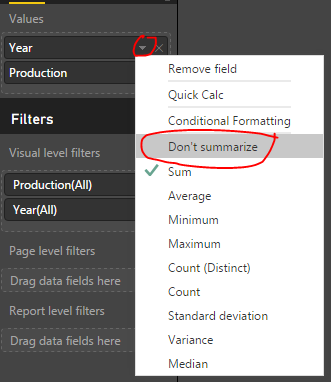
Rather we want to see every year and the production values for each of those years. To change this view click on the triangle in the Values section of the Visualizations pane. This will reveal a list, in this list it shows that our numbers are aggregated by Sum change this to Don’t Summarize.
Now we have a nice list of yearly production levels with a total production at the bottom of our table.
Next we will build our measure using DAX to calculate the percent changes by year. Our Calculation for % change is the following:
% Change = ( New Value / Old Value ) - 1
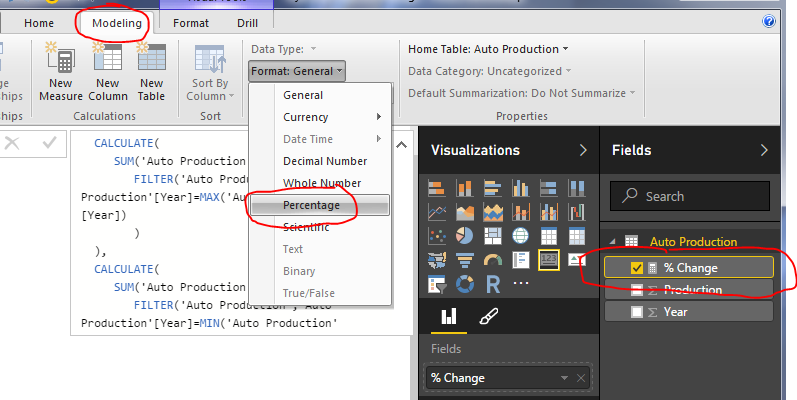
Below is the DAX statement we use as our measure. Copy the below statement into a new measure.
% Change =
DIVIDE(
 CALCULATE(
 SUM('Auto Production'[Production]),
 FILTER('Auto Production','Auto Production'[Year]=MAX('Auto Production'[Year])
 )
 ),
 CALCULATE(
 SUM('Auto Production'[Production]),
 FILTER('Auto Production','Auto Production'[Year]=MIN('Auto Production'[Year])))
,0)
- 1
I color coded the DAX expression between the two equations to show which parts correlated. Note we are using the DIVIDE function for division. This is important because if we run into a case where we have a denominator = 0 then an error is returned. Using DIVIDE allows us to return a zero instead of an error.
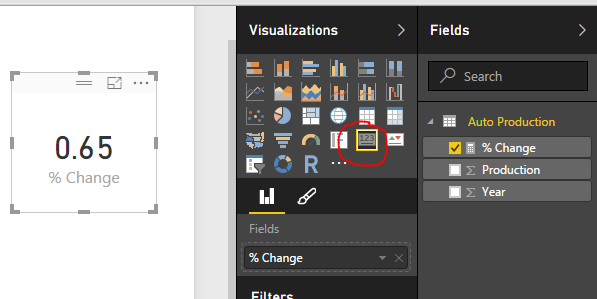
Next add our newly created measure as a Card.
Change the % Change measure format from General to Percentage, do this on the Modeling ribbon under Formatting.
Next add a slicer for Year.
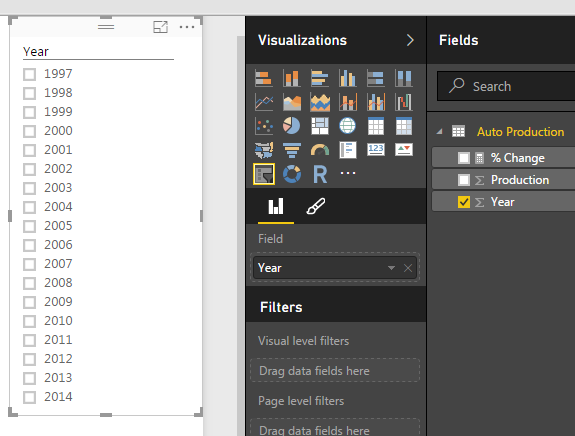
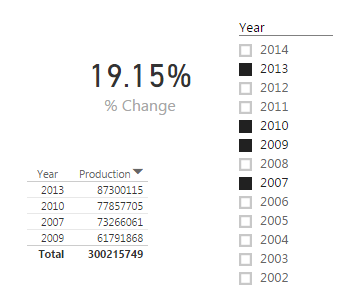
Now you can select different year and the % change will automatically change based on our selection. The % change will always select the smallest year’s production and the largest year’s production to calculate the % Change. By Selecting the Year 2013 and 2007, the percent change is 19.15%. The smallest year is 2007 and the largest is 2013.

If we select a year between 2013 and 2007 the measure will not change.
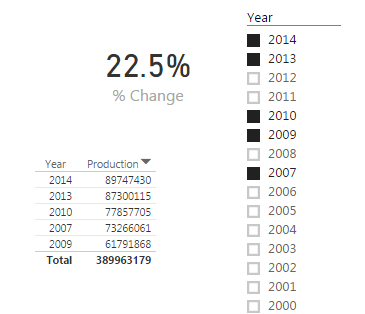
The measure will only change when the starting and ending years are changed. By selecting the year 2014, the measure finally changes.
Pretty cool wouldn’t you say? Thanks for taking the time to walk through another tutorial with me.
Want to learn more about PowerBI and Using DAX. Check out this great book from Rob Collie talking the power of DAX. The book covers topics applicable for both PowerBI and Power Pivot inside excel. I’ve personally read it and Rob has a great way of interjecting some fun humor while teaching you the essentials of DAX.
