Over the course of time Power BI has come to encompass a wide variety of technologies and tools. One such product that has been integrated into the suite of Power BI is paginated reports. Before Power BI, paginated reports were served up in SQL Server Reporting Services. That product was the major reporting tool used by businesses using Microsoft products. Now, Power BI brings us the best in visualization, analysis and insight. Paginated reports give you pixel perfect outputs that can be easily printed, emailed, and output to Excel. It strikes me as a bit peculiar that over the years while the focus has been to push into Power BI visualizations heavily, almost every client I’ve ever worked with has always asked for outputs of Power BI reports that are best served up in a paginated way.
What is really exciting is now we have an ecosystem in which we can bring all these report types together. You can create “perfect world” reports where we can analyze and export in fashions that meet the needs of a wider audience. Today I want to talk specifically about the release of Paginated reports in external embedded scenarios in the November feature release cycle. The integration of paginated reports has been on a steady cadence of releasing new features. I want to serve up an overview of current state for embedding these report types, and where there is room for improvement. I’m also interested in the community feedback to determine if my experiences or blockers are similar or different. Be sure to comment below.
What you need
First off, in order for you to use paginated reports in Power BI, you will need to likely upgrade you license. It is a widely known request that something should be done about removing this feature from premium pricing. If you want to change that, throw your weight into the request to change that, you can do that via the community ideas section for Power BI to make this feature available to Pro users -> https://ideas.powerbi.com/forums/265200-power-bi-ideas/suggestions/35959420-paginated-reports-please-make-it-available-in-pr
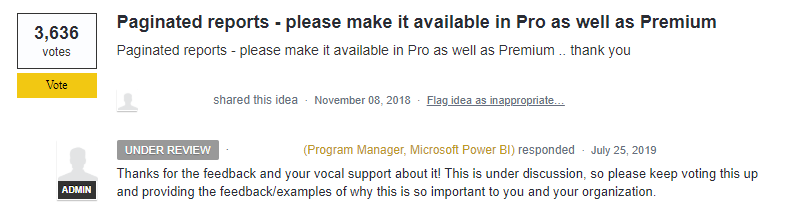
Importantly, having Pro license won’t fix the cost for an embedded scenario completely, but one can hope that if it is available to Pro, then the A1 – A3 sku levels would work as well for future embedding.
Lets get back on track! You will need an A4 sku or P1 in order to use the paginated reports. A full walk-through of how you can develop this solution can be found here. The great thing about an A sku is that you can turn it on and turn it off. This means that if you want to kick the tires and showcase the capabilities before purchasing, you still have the ability to do so.
What Works
Aw yea! Look at this beauty, you see that in the embedded sample report? PDF, Excel, Word, PowerPoint! All there, and all exporting the pixel perfect greatness of paginated. I don’t have to assume how much businesses will salivate over this one, because I’ve had all these conversations. With paginated reports in our external facing applications we have the ability to merge all these report types into seamless products for our business users.
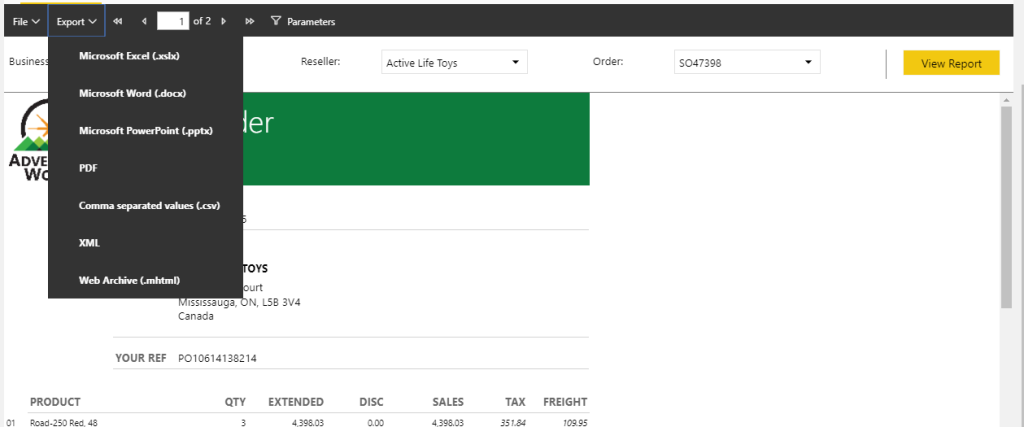
You want to test this out for yourself? You can! Check out the playground in embedded and you can see just how these features serve up in all your export dreams.
https://microsoft.github.io/PowerBI-JavaScript/demo/v2-demo/index.html
Here are the current data sources that are supported.
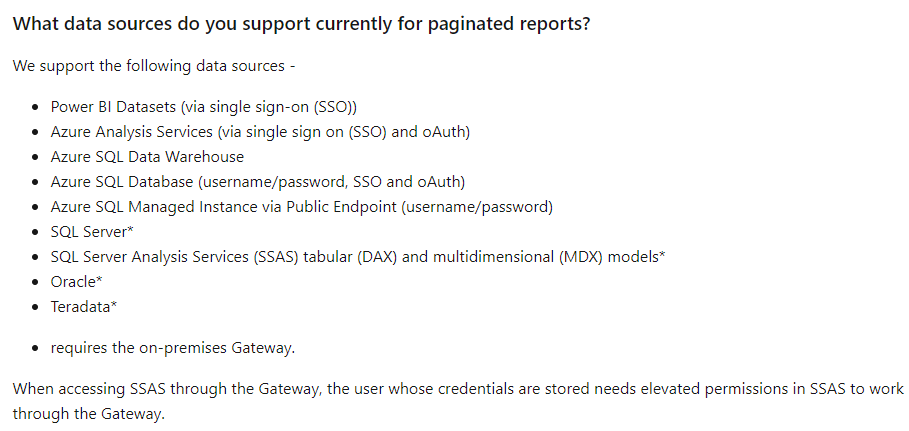
Not surprisingly, all the Azure sources feed us up all the data & security that we would want to use in terms of access. This will support existing data extraction methods used for paginated in other reporting tools. There is great news from a Power BI model perspective as well! If you want to integrate your Analysis and paginated reports to serve off the same model this is really easy to do now because I can connect to AAS or a Power BI Dataset.
What is Needed
There are a few things that you should be aware of that aren’t yet baked into the feature release. This is where I’m wondering how much of a blocker it may be for others as it is for me. There are likely many companies that have hundreds or thousands of paginated reports. The majority of your reports are likely served up via stored procedures with parameters in the SSRS report. These provide data context prior to execution of the procedure thereby limiting the results. This WILL work if you are using Azure SQL DB or Azure Managed instance. It WILL NOT work for on-premises SQL or a Platform as a Service (Paas) solution where you are hosting your own SQL Server in an Azure VM.
Export to Excel – Dump my data!… Personally, I don’t mind that this feature isn’t in the export options. I actually hope it doesn’t get added in the way it works in legacy tools. One challenge I’ve always had is trying to get business users out of using reports as export dumping tools. With the advent of Power BI, and all the ways we can surface up curated data sources, I want to see this type of practice stop. We need to get better at training people where and how to ingest data and make it easier for them. Rather than let them dump out loads of data and creating silo’d processes of their own.
Close
I’m really excited that paginated reports has been added as a supported report type for embedding. Paginated reports will certainly hold a place in my future deployments. Additionally, I would love full support for on-premises data and Paas solutions in order for major migrations to occur of paginated reports into Power BI. For me, I will need to consider the cost of refactoring all those stored procedures if I want to stay on-premises or make a case for moving all of reporting only to Azure SQL.
For more details on the release and links to the announcement you can find it here -> The Details: https://powerbi.microsoft.com/en-us/blog/embed-paginated-reports-in-your-own-application-for-your-customers-preview/
If you like the content from PowerBI.Tips, please follow us on all the social outlets to stay up to date on all the latest features and free tutorials. Subscribe to our YouTube Channel, and follow us on Twitter where we will post all the announcements for new tutorials and content. Alternatively, you can catch us on LinkedIn (Seth) LinkedIn (Mike) where we will post all the announcements for new tutorials and content.
As always, you’ll find the coolest PowerBI.tips SWAG in our store. Check out all the fun PowerBI.tips clothing and products: