
Measures – Year Over Year Percent Change
How do I calculate year-over-year percent change with DAX measures?
TL;DR. Load monthly data with Year and Month columns, then create LastYear and ThisYear measures with CALCULATE and a date reference. YoY Percent Change is DIVIDE([ThisYear], [LastYear], 0)-1, formatted as a percent on the Modeling ribbon.
What question does this measure answer?
How this month (or period) compares to the same period last year, for example November visitors this year vs last year.
Which measures do I create?
Date Reference, LastYear, ThisYear, then YoY Percent Change. LastYear and ThisYear use VAR CurrentDate and CALCULATE with a year filter.
How is YoY percent change written?
YoY Percent Change = DIVIDE([ThisYear], [LastYear], 0)-1, then set the measure format to percent on the Modeling ribbon.
Is this the same as month-to-month percent change?
No. This post is the year-over-year variation of the earlier month-to-month tutorial. Same idea, different period.
Related: Using Variables within DAX, Creating A DAX Calendar, and Measures – Month to Month Percent Change.
This tutorial is a variation on the month to month percent change tutorial. This specific exploration in year over year performance was born out of reviewing my google analytics information. The specific analysis question I am trying to answer is, how did this current month of website visitors compare to the same month last year. For example I want to compare the number of visitors for November 2016 to November 2015. Did I have more users this year in this month or last year? What was my percent changed between the two months?
Here is a sample of the analysis:
let’s begin with loading our data and data transformations. Open up PowerBI Desktop, Click the Get Data button on the Home ribbon and select Blank Query**.** Click Connect to open the Query Editor. Click Advanced Editor on the View ribbon. While in the Advanced Editor paste the following code into the editor window, click Done to complete the data load.
Note: If you need some more help loading the data follow this tutorial about loading data using the Advanced Query Editor. This tutorial teaches you how to copy and paste M code into the Advanced Editor.
let
    Source = Table.FromRows(
        Json.Document(
            Binary.Decompress(
                Binary.FromText(
                    "VdDBDcQwCETRXnyOFMAYcC1W+m9jV8BhfH1ygJ9zBr/8CvEaz+DYNL7nDAFjnWkTTNsUbIqnLfyWa56BOXOagy2xtMB5Vjs2mPFOYwIkikIsWd6IKb7qxH5o+bBNwIwIk622OCanTd2YXPNUMNnqFwomp0XvDTAPw+Q2uZL7QL+SC1Wv5Dpx/lO+Hw==",
                    BinaryEncoding.Base64
                ),
                Compression.Deflate
            )
        ),
        let
            _t = ((type text) meta [Serialized.Text = true])
        in
            type table [#"Start of Month" = _t, Sales = _t]
    ),
    #"Changed Type" = Table.TransformColumnTypes(Source, {{"Start of Month", type date}, {"Sales", Int64.Type}}),
    #"Inserted Month" = Table.AddColumn(#"Changed Type", "Month", each Date.Month([Start of Month]), type number),
    #"Inserted Year" = Table.AddColumn(#"Inserted Month", "Year", each Date.Year([Start of Month]), type number)
in
    #"Inserted Year"
While still in the Query Editor rename the query to Data. Then click Close & Apply to complete the data load into the data model.
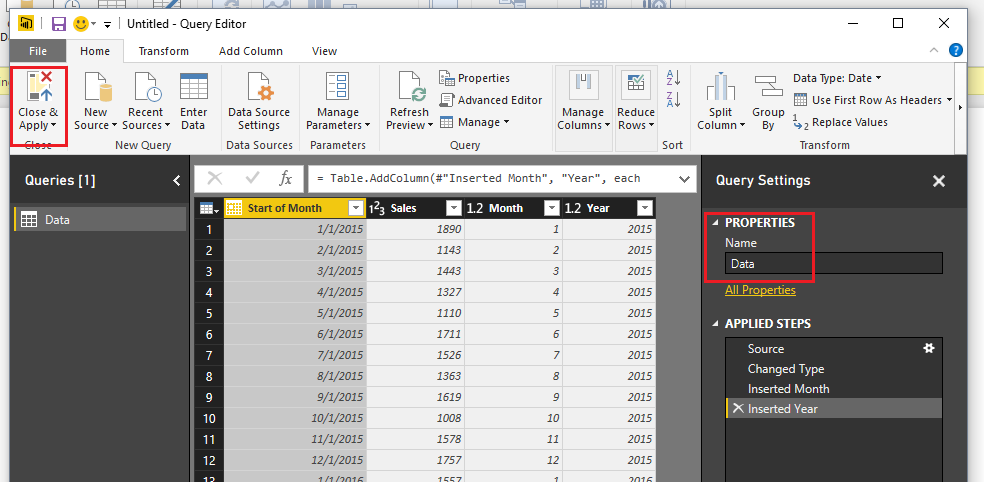
Load Monthly Data
Next, make four measures. On the Home ribbon click the New Measure button. Enter the following to establish a reference date to the subsequent equations:
Date Reference = DATE(2016,12,31)
Enter in the following equation to calculate the last year monthly sales amount.
LastYear = VAR CurrentDate = [Date Reference] RETURN CALCULATE( SUM(Data[Sales]), Data[Year] = YEAR(CurrentDate)-1 )
Note: Using the NOW() function calls the current time when the query was last run. Thus, if you refresh your data next month the NOW() function wrapped in a YEAR() will return the current year from the date-time observed by PowerBI.
Following the same process enter the following additional measures. The ThisYear measure calculates the sales for the current month.
ThisYear = VAR CurrentDate = [Date Reference] RETURN CALCULATE(SUM(Data[Sales]),Data[Year] = YEAR(CurrentDate))
Finally, add the calculation for the Year to Year comparison.
YoY Percent Change = DIVIDE([ThisYear], [LastYear], 0)-1
Since the YoY Percent Change is a real percentage we need to change the formatting to a percent. Click on the YoY Percent Change measure then on the Modeling ribbon click the % symbol in the formatting section of the ribbon.
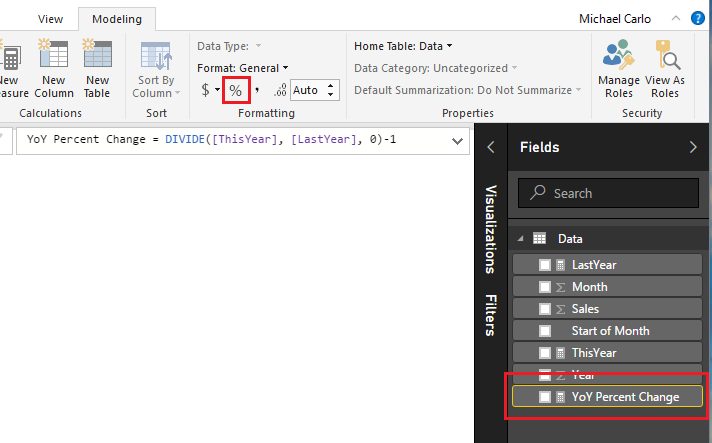
Change Measure Format
Next, add a Stacked Column Chart with the following columns selected.
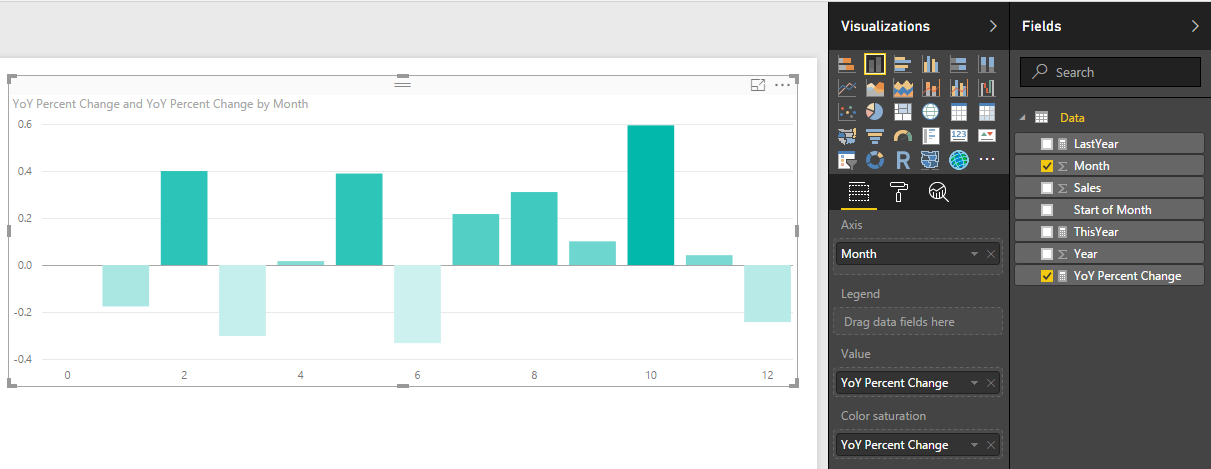
Add Stacked Column Chart
OK, we have a chart, but it is kinda awkward looking right now. The x-axis is the month number but we don’t have a month 0. That simply does not make sense. Let’s change some of the chart properties. While having the Stacked Column Chart selected click on the Paint Roller in the Visualizations pane. First, click on the X-Axis and change the Type to Categorical.
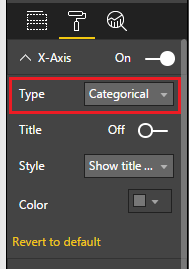
Change X-Axis
Then click on the Data Colors and turn on Diverging. Change the Minimum color to Red and the Maximum color to Green. Set the Center to a value of 0.
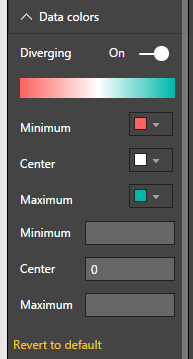
Change Colors
Click on the Title change it something meaningful, Center the text and increase the font size.
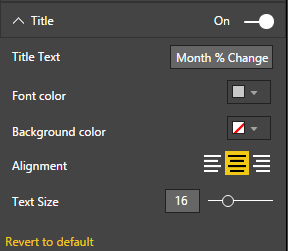
Change Title
Our bar chart looks much better. However, the month numbers do not look quite right. Visually the month indicators would be cleaner if we didn’t have any decimals. Click on the Month field and then on the Modeling ribbon change the Data Type to Whole Number. There will be a warning letting you know that you are changing the Data Type of the Whole number. Click OK to proceed with the change.
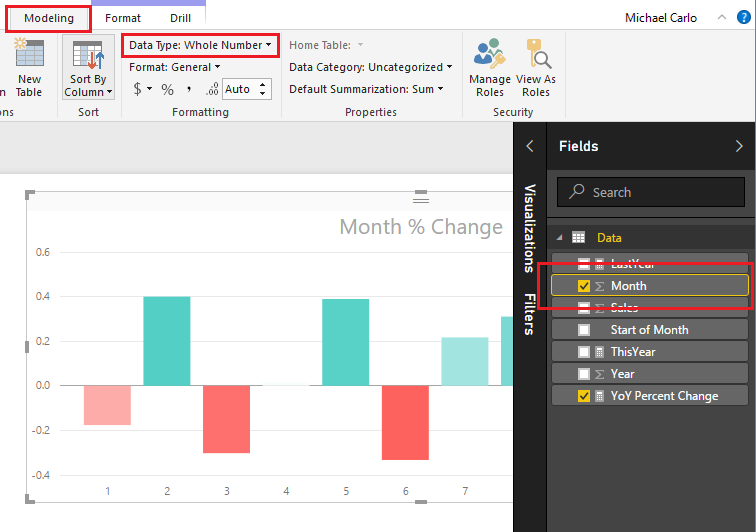
Change Month to Whole Number
Another successful percent change tutorial completed. I hope you enjoyed this year over year month comparison example. Make sure you share if you like what you see.