To say this another way. Not all columns have datatypes in DAX, specifically speaking to using dynamic ranking with an “Other” category. Let me explain.
The Tabular model is comprised of tables with typed columns. This is a truth learned in one’s Tabular infancy. Whether the table is imported, calculated, or Directly Queried does not matter; all tables have columns with explicitly defined types.
DAX is the language of the Tabular model. It has less type discipline than tables in the Tabular model. Measures can have a Variant data type. Implicit type conversions abound. Nor are DAX expressions limited to returning scalar values. DAX is a query language. An expression may return a table. When defining a table in DAX, projected columns have no explicit type. Each row’s value is calculated independently and its type depends on its value. This is the phenomenon we seek to explore in this post. If this seems unsurprising, you can probably stop here.
A practical scenario
Here is the scenario where I discovered this. I was helping a colleague with a dynamic ranking measure and aggregation. The requirement read:
Show the top for production plants as ranks 1 through 4. Group all others ranked 5 or lower together as “Other”.
We have three tables:
- a fact table
'Fact' - a dimension table
'Dim', related to'Fact'with the relationship'Fact'[DimKey] <-N:1- 'Dim'[DimKey] - a disconnected table,
'Rank Selector', with the values: “1”, “2”, “3”, “4”, and “Other”.
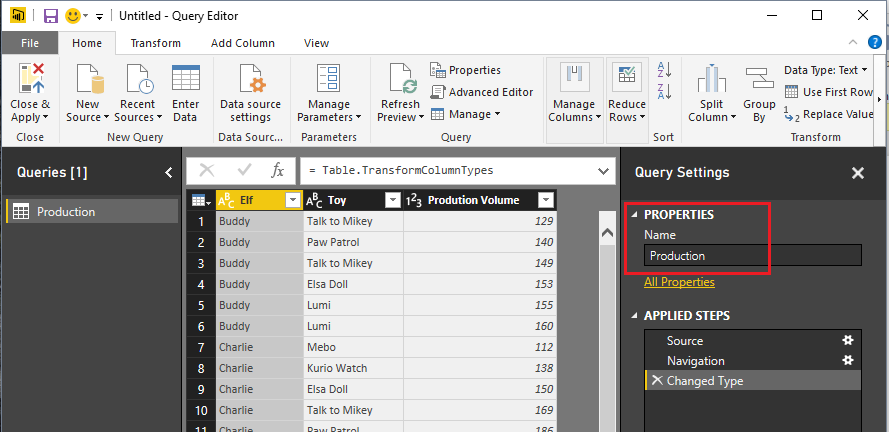
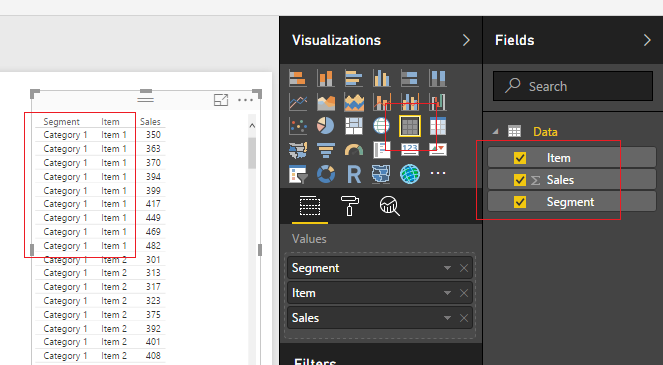
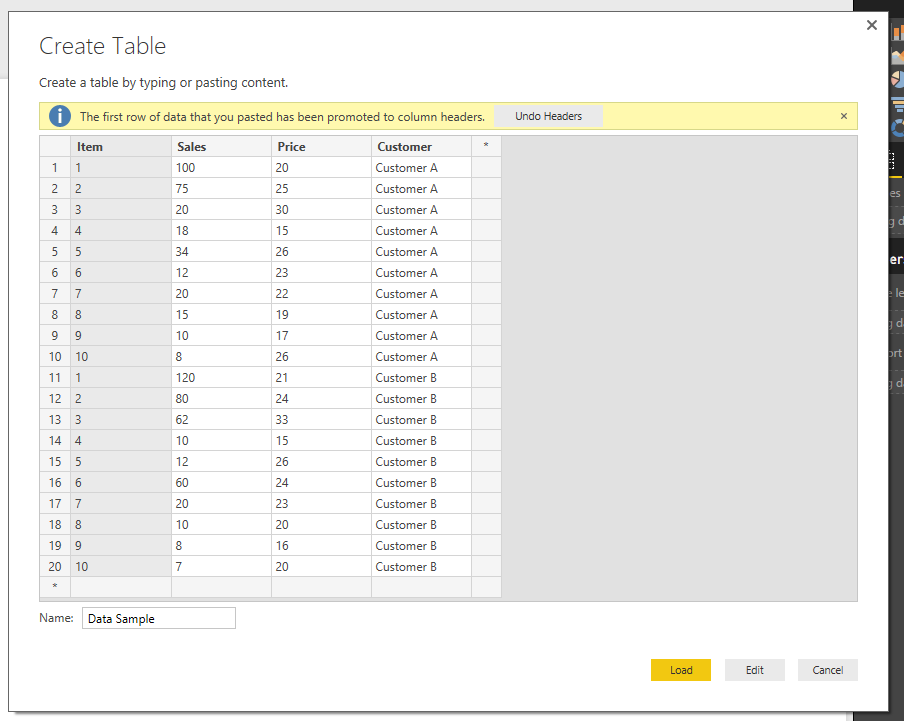
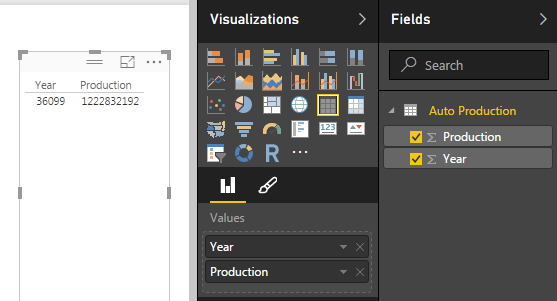
We aggregate 'Fact'[Value]. Here is a Power BI file with sample data and code.
Our first try
We started with a measure [Agg] as our base measure.
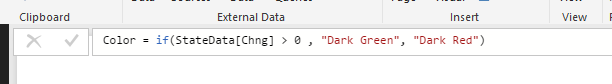
Agg = SUM ( 'Fact'[Value] )[_Rank (variant)] is a helper ranking measure, returning a rank 1-4 or “Other”.
_Rank (variant) =
VAR rawRank = RANKX ( ALL ( 'Dim' ), [Agg],, DESC )
// note this value is either a number 1-4 OR the string, "Other"
VAR groupedRank = IF ( rawRank <= 4, rawRank, "Other" )
RETURN
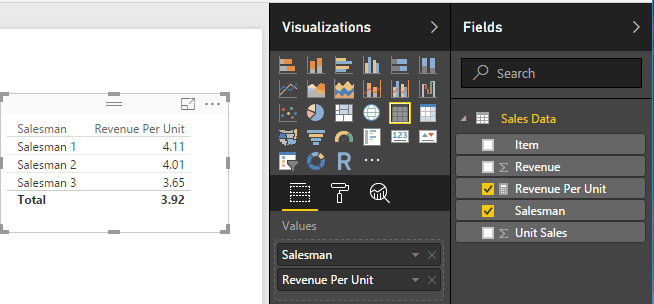
groupedRankBelow is a screengrab of these two measures evaluated against our 'Dim'[Plant]. As you can see, [Agg] returns a value for each plant. The top four plants have ranks of 1, 2, 3, and 4. The other plants all have the same rank, “Other”. This is all as expected.
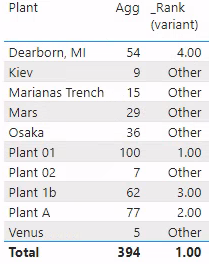
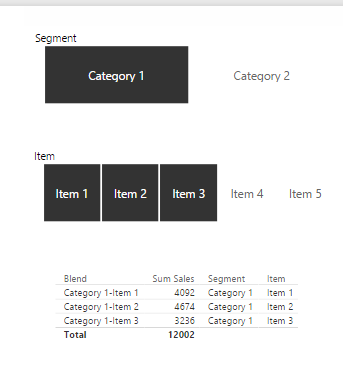
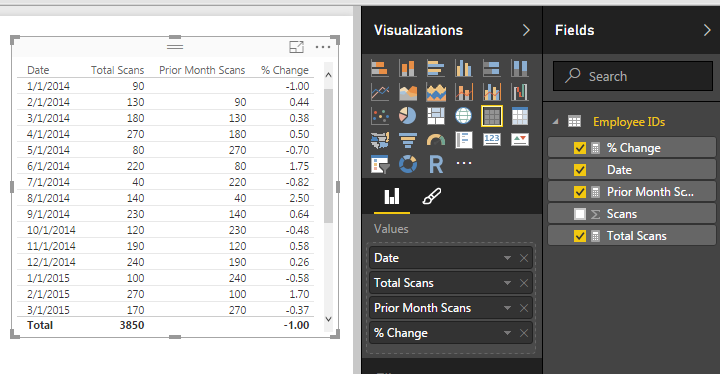
'Dim'[Plant] with [Agg] and [_Rank (variant)] measures, working largely as expected. Each dim value has a value for [Agg] and a rank of 1-4 or the string, “Other”.The issue reared its head when we attempted to use these ranks to define a new visual based on 'Rank Selector'[Rank]. We defined a measure to show [Agg] based on the plant’s rank (1-4 or “Other”), rather than the plant name. Note that 'Rank Selector'[Rank] is a column in a data model table, with Data type: Text. Our expectation is that we will see a table like the image below.
Wherein our heroes encounter a challenge
[Ranked Agg (variant)] is the display measure to show aggregations against 'Rank Selector'[Rank]. We wrote the variant version you see below first, not realizing the perils that laid ahead. (Correct implementations follow later.)
Ranked Agg (variant) =
VAR rankContext = VALUES ( 'Rank Selector'[Rank] )
VAR ranked =
ADDCOLUMNS (
ALL ( 'Dim' ),
"@rank", [_Rank (variant)],
"@val", [Agg]
)
VAR currentRank = FILTER ( ranked, [@rank] IN rankContext )
VAR result = SUMX ( currentRank, [@val] )
RETURN
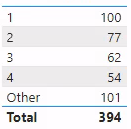
resultWhen we visualize this measure against 'Rank Selector'[Rank], we get the result below.
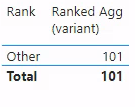
'Rank Selector'[Rank] value “Other” and “Total”. Specifically, we do not see any value for ranks “1”, “2”, “3”, or “4”.A table visualization showing only the 'Rank Selector'[Rank] value “Other” and “Total”. Specifically, we do not see any value for ranks “1”, “2”, “3”, or “4”.
What is going on here? We see data only for the Rank Selector'[Rank] label “Other” but none of the numbers. Let us walk through the measure step-by-step to understand this result.
VAR rankContext = VALUES ( 'Rank Selector'[Rank] )rankContext captures whatever the current filter context is for 'Rank Selector'[Rank]. This is one or a collection of the values: “1”, “2”, “3”, “4”, and “Other”. For a detail row of a table visualization, the context contains exactly one of those values. For a total row (assuming no other slicers or filters), the context contains all of those values.
VAR ranked =
    ADDCOLUMNS (
        ALL ( 'Dim' ),
        "@rank", [_Rank (variant)],
        "@val", [Agg]
    )
ranked is a table with all rows and columns of the data model table 'Dim' and two projected columns, [@rank] and [@val]. For any row, i.e., for any specific plant, [@rank] is one of 1-4 or “Other”. Many rows may have [@rank] = "Other". We do not expect ties, so there are exactly four rows with numeric ranks, one each for the ranks 1-4. (This table looks like the first table visualization screenshot above.)
The critical part of both the ranking logic and the phenomenon we are exploring is in currentRank. This is a subset of the table, ranked, holding only the row or rows which have a [@rank] value that exists in the filter context captured in rankContext (again, one or a collection of the values “1”, “2”, “3”, “4”, and “Other”).
Note, that we see data only for the Rank Selector'[Rank] label “Other”. As you recall, our [_Rank (variant)] seemed to work correctly above – it definitely returned ranks 1-4, not just “Other”. 'Rank Selector'[Rank] has the correct values. We checked that our logic in [Ranked Agg (variant)] was correct. We verified in DAX Studio that ranked held the correct table. We even got to the point that we checked whether VALUES was behaving as we expected in rankContext. (I will note that if you find yourself verifying the behavior of an expression as basic as VALUES ( 'Rank Selector'[Rank] ), then you, too, may find yourself questioning what has brought you to this point.)
VAR currentRank = FILTER ( ranked, [@rank] IN rankContext )We continued checking and troubleshooting and identified that currentRank had binary state: either it would be an empty table or it would be a table holding only rows with [@rank] values of “Other”. It would never hold a row with a rank value of 1, 2, 3, or 4. It seemed that the predicate in our FILTER would never find 1 to be equal to 1, or 2 equal to 2, and so on.
How could basic logic be so broken just in this measure? There was much gnashing of teeth. Several head-shaped indents were beaten into the nearest wall.
DAX, the language, has a more permissive type system than the Tabular model
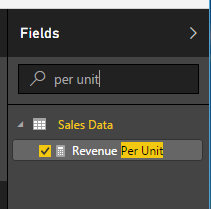
You may have observed some apparent inconsistency in my quoting or not-quoting the rank values above. In fact, I have been scrupulous to always quote values when referring to 'Rank Selector'[Rank], the model column with type Text, and to not-quote the rank values returned from [_Rank (variant)]. The column 'Rank Selector'[Rank] has exclusively string values. The measure [_Rank (variant)] sometimes returns a numerically typed value in the range 1-4 and sometimes returns the string “Other”.
In DAX, 1 = 1 is an equality test that returns TRUE. Similarly, 1 IN {1, 2, 3, 4} returns TRUE, because 1 = 1 and 1 exists in the table there. In DAX, 1 = "1" is an equality test that throws a type error. Numbers cannot be tested for equality with strings. They are different types. Therefore, a number can never be equal to a string. Thus, 1 IN {"1", "2", "3", "4", "Other"} also throws a type error.
The lightbulb moment
In [Ranked Agg (variant)], currentRank has a column [@rank] with type Variant. Sometimes, [@rank] has a value in the range 1-4, type Whole Number. Sometimes it has the value “Other”, type Text. When we evaluate the predicate [@rank] IN rankContext, there are exactly two possible results. Either we ask for an impossible membership test, “Is this numerically typed rank value in the set of Text values?”, or we ask whether the string “Other” is in that set. The first cannot succeed. The second only succeeds for the “Other” rank.
The Fix
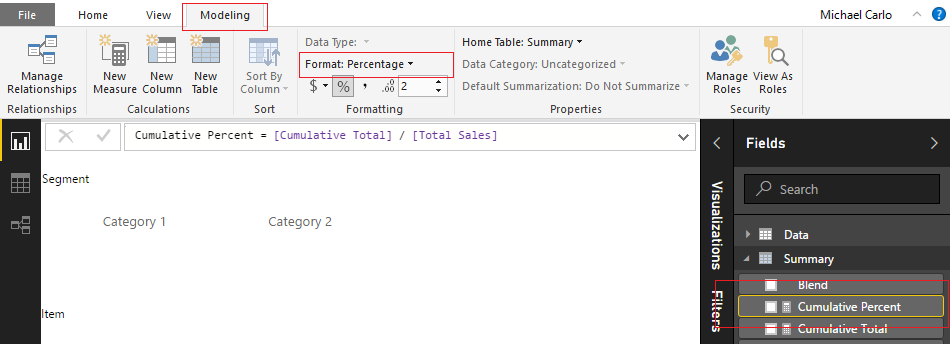
The fix, then, is straightforward. We must always return a value of type Text in our ranking measure. Correct measures are below with comments highlighting the modifications.
_Rank (typed) =
VAR rawRank = RANKX ( ALL ( 'Dim' ), [Agg],, DESC )
VAR groupedRank =
    // with an explicit typecast, our measure now *always* returns a string-typed value
    IF (
        rawRank <= 4,
        FORMAT ( rawRank, "0" ), // force string type
        "Other"
    )
RETURN
    groupedRank

Ranked Agg (typed) =
VAR rankContext = VALUES ( 'Rank Selector'[Rank] )
VAR ranked =
    ADDCOLUMNS (
        ALL ( 'Dim' ),
        "@rank", [_Rank (typed)], // the only difference here is using our typed rank helper measure
        "@val", [Agg]
    )
VAR currentRank = FILTER ( ranked, [@rank] IN rankContext )
VAR result = SUMX ( currentRank, [@val] )
RETURN
    result
The measures above give us the results we expected all along, as you can see in the table visualization below.
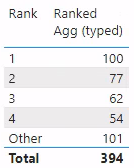
[Ranked Agg (typed)] alongside.Below is a screengrab of all the measures in visualizations, so you can see the differences.
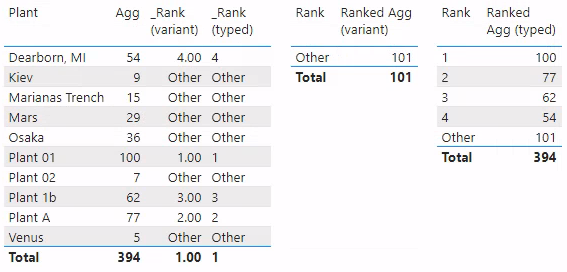
'Dim'[Plant] table with [Agg], [_Rank (variant)], and [_Rank (typed)]; the incorrect behavior with [Ranked Agg (variant)]; and the correct behavior with [Ranked Agg (typed)].Summary
Tabular model tables have columns of explicit type. DAX expressions have implicit types. Columns defined in DAX have Variant type. Each row has an implicit type based on its value. If such a column is a Calculated Column added to a data model table, then an explicit type must be assigned and all values in that column will be cast to that type at load time. When such a column is used as an intermediate step in some calculation, each row may have a different type. If your operations depend on types, you must account for this explicitly. This is especially relevant when operating on data model and DAX tables together.
Insights from the community
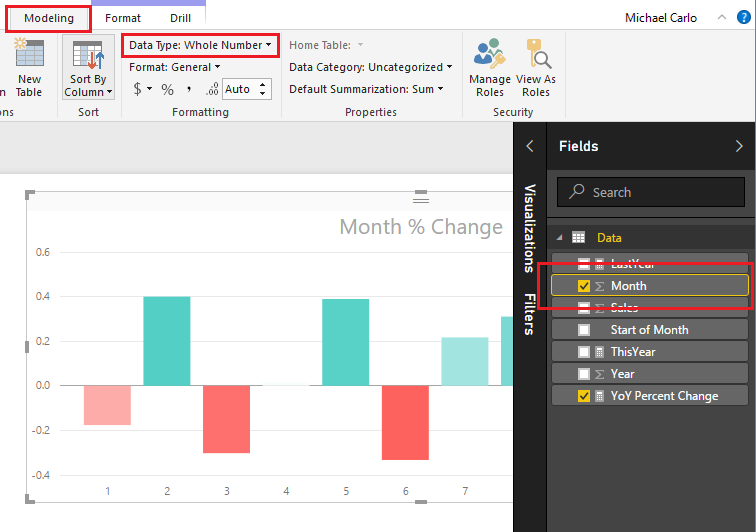
When talking about this with some peers, Maxim Zelensky (blog, Twitter) observed that there is no type indication in Power BI Desktop. Nevertheless, you can identify this sort of thing in DAX Studio. The result of a query such as that below will right-align Variant-typed values and left-align Text-typed values. This query references the included Power BI file and its results are shown in a screenshot below. You can observe similar alignment in the table visual shown above. In general, when visualized, numeric data is presented with right-alignment and textual data left-aligned. This practice predates Power BI; it is a general rule that Power BI and DAX Studio wisely adopted.
EVALUATE
ADDCOLUMNS (
    VALUES ( 'Dim'[Plant] ),
    "@text", [_Rank (typed)],
    "@variant", [_Rank (variant)]
)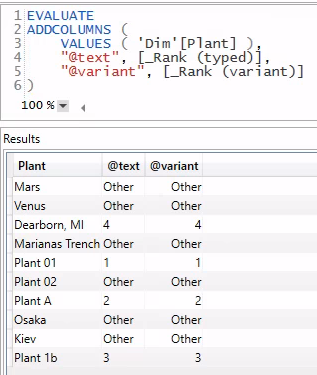
[@text] left-aligned and [@variant] right-aligned.Using the sample code and PBIX
Here is a link to download the PBIX that was used for examples above. This has four visuals to demonstrate the phenomenon discussed in this blog post. The first visual is a table with 'Dim'[Plant], [Agg], [_Rank (variant)], and [_Rank (typed)]. Of note in the first visual is left-vs-right alignment of the two [_Rank ...] measures. The second visual is a table with 'Rank Selector'[Rank] and [Ranked Agg (variant)], showing the incorrect results of the measure depending on a Variant-typed intermediate column, with a value only for rank “Other”. The third visual contrasts with the second, using [Ranked Agg (typed)] to show the correct behavior of the dynamic ranking and grouping logic, with a value for all ranks and a correct total. Lest one protest that the phenomenon above may be an artifact of using VARs, the last visual, on the bottom, shows an example that uses no VARs and references no other measures. The behavior of this last visual is identical to the incorrect [Ranked Agg (variant)] version.