Here is a super helpful video from Guy in a Cube about how to have multiple logins using Google Chrome. Often I find my self juggling between a work account and my PowerBI.Tips accounts to test out various Power BI features. This little trick definitely saves you time and headache when jumping between accounts.
Side note: I also found this great technique works on Azure (portal.azure.com) if you frequent this site for work and for your other adventures.
This week I had a number of team members tell me how difficult it was to share a PBIX file and the corresponding data between team members. The department hasn’t committed 100% to the idea of using PowerBI.com, and thus wanted to share the actual report. I pointed my team mates to my earlier tutorial about using variables for file locations. After reading the tutorial the team came back with a bunch of griping about how they didn’t want to go into the query editor, people name variables different things, and thus it’s hard to understand what another team member was doing, blah, blah, blah…
So, in order to make peace I took another look at trying to make the sharing of a PBIX file easier. This time I decided to use the Parameters feature within PowerBI. This feature within the Query Editor was released all the way back in April of 2016. I read about it, thought it was interesting but couldn’t find a really good use case. In my current predicament, the parameters feature is the perfect solution.
By using a parameter to store a folder and or file location you enhance the user experience by making it easier for a user to change the Query.
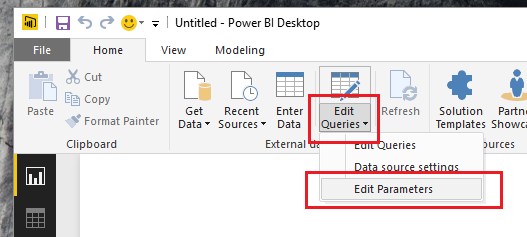
To modify a parameter after it has already been built click on the bottom half of the Edit Queries button, found on the Home ribbon. A menu will pop up and you can select Edit Parameters.
Edit Queries
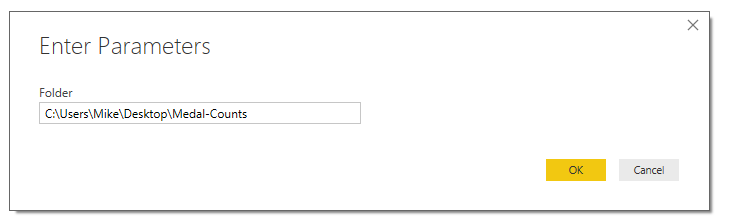
The Enter Parameters screen will pop up. This is where you would change the parameters for a query. In our example this is where we will enter a new folder location for our data.
Enter Parameters Screen
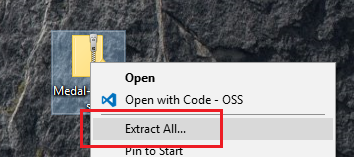
Let’s begin the tutorial. To start we will need to work with some data. In my earlier tutorial, I used the Olympic Medals Count. We will reuse this dataset. Start by downloading the zipped folder Olympic Metal Count files from the following location. Once you have downloaded the sample data, extract the folder and subsequent files from the zipped file. In windows 10, which I am using, you can right click on the downloaded file and select Extract All..
Extract All from Zipped Folder
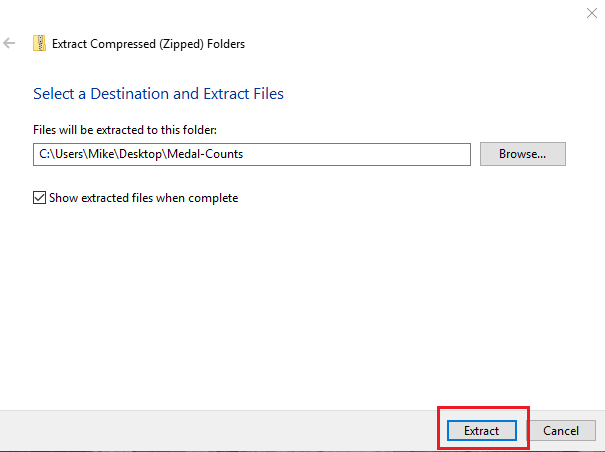
A pop-up window will appear to complete the extraction process. By leaving the default settings the folder will be extracted into the same location as the downloaded file. Click Extract to complete the extraction.
Complete Extraction
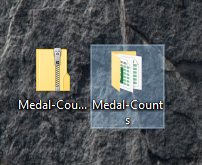
We now have a folder with all our data.
Extracted Folder
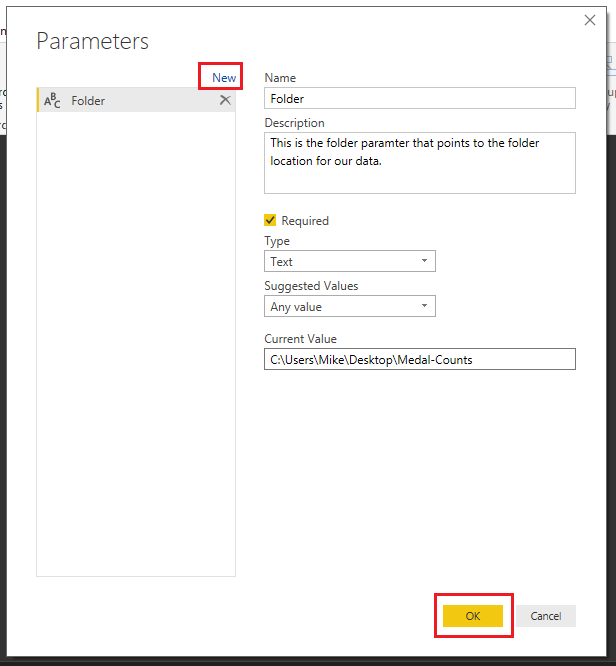
With the data prepared we can now make the parameters within PowerBI. Open PowerBI and click the top half of the Edit Queries button. The Query Editor will open. Click the Mange Parameters found on the Home ribbon. The Parameters screen will open. Click the blue New button at the top left. Enter the name Folder, and include a brief description of this parameter. Since the folder parameter is essential to the query we must leave the Required box checked. Change the Type to Text, and leave the Suggested Values to Any value. Finally enter the Folder Location where our Medal-Count file is located into the Current Value. Click OK to complete the parameter.
Make Parameter
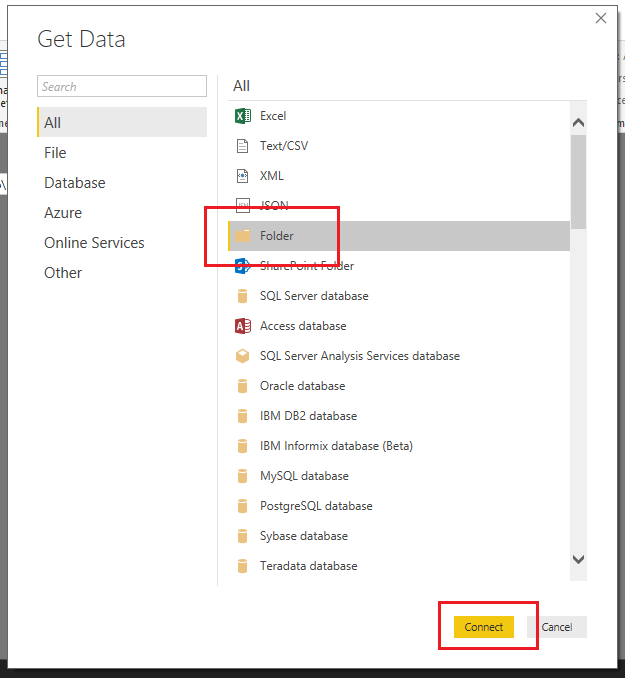
Next, we will create the actual query to load the folder containing our Metal Counts. Click on the New Source button. This will open the Get Data window. Select the Folder option located in the list on the right. Click Connect to complete the Get Data.
Connect to Folder
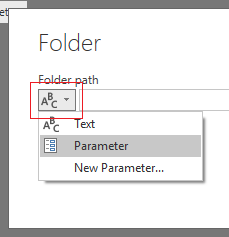
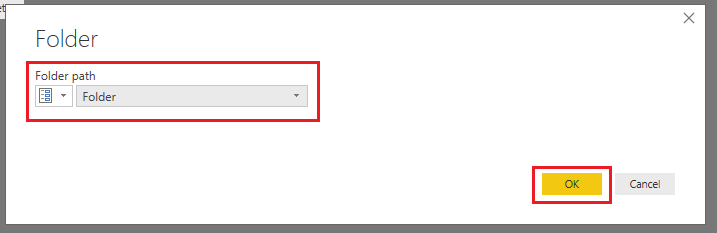
The Get Data window will close, then a new window asking for the folder location will open. This is where the parameter implementation is slick. Click the ABC button to the far right of the Folder Path bar. Change the selection to Parameter and select our newly created parameter labeled Folder. Click OK to load the Folder.
Change to Parameter
Select Folder
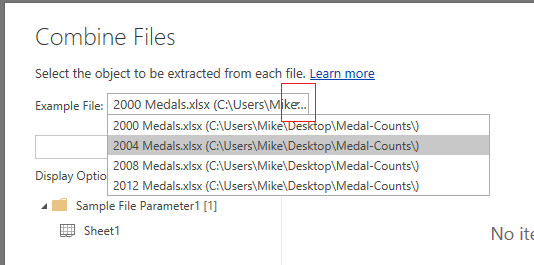
Next the folder prompt opens allowing us to accept or edit the query. Click Combine & Edit to proceed. The Combine Files window will open. Here we can interrogate each file to inspect what is in each file. Clicking the drop-down menu next to Example File: allows us to see the list of all files. Select the 2004 Medals.xlsx file.
Select Drop Down
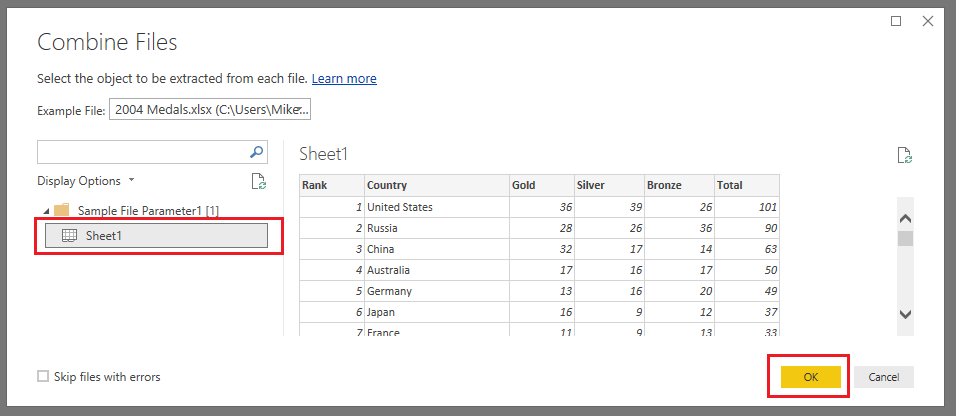
Click the Sheet1 item on the left side of the window. This exposes the data that is contained within this 2004 particular file. Click OK to proceed.
Select Sheet1
Note: For users that have been working with PowerBI for a while, this Combine Files screen flow is a newer feature. I feel that this greatly simplifies the process and makes it easier to detect issues when loading data.
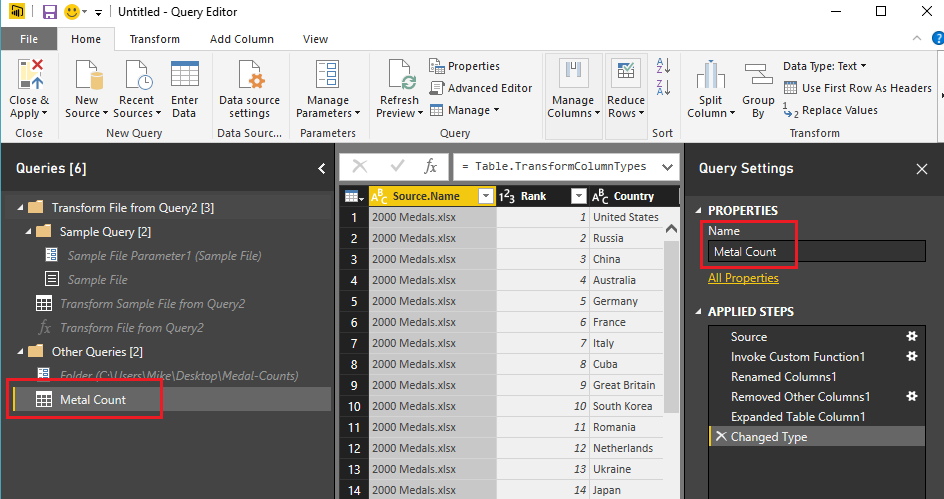
PowerBI now loads the files into the Query Editor. The Query that we want to use is labeled Query2, change the Query2 name to Metal Count.
Metal Count
What you’ll also notice is there is a lot more queries on the left side of the screen under Queries. These queries were auto generated when we navigated through the menu screens. Click Close & Apply to complete the data load.
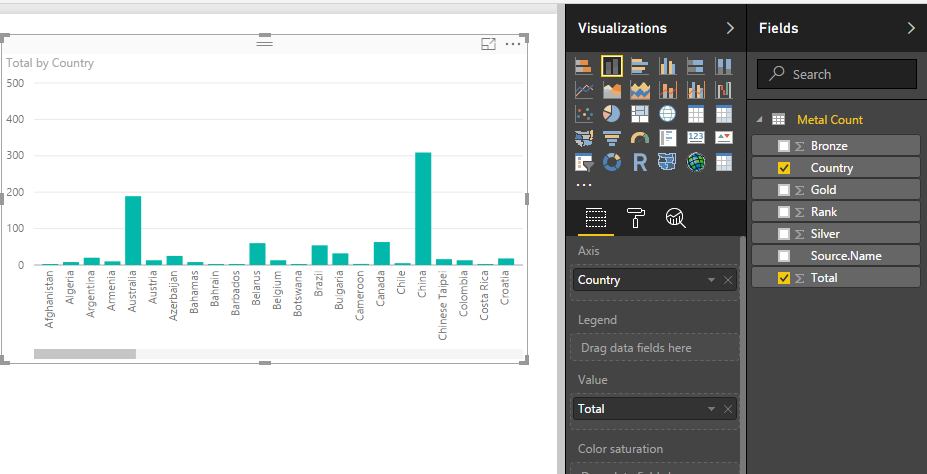
Build the following Stacked Column Chart:
Stacked Column Chart
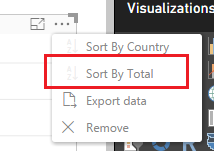
Click the Ellipsis on the upper right hand corner of the chart and select Sort By Total to sort all the items in the bar chart according to how many metals each country won.
Sort by Total
Great we have made a parameter, loaded multiple excel files, and then made a visual of our data. Let’s test it out. Save your work and close the PowerBI desktop. (don’t forget to save your PBIX)
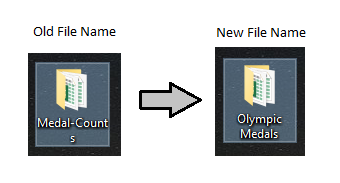
Next we rename the folder where all the excel files are contained. Change the name to Olympic Medals.
Rename File Folder
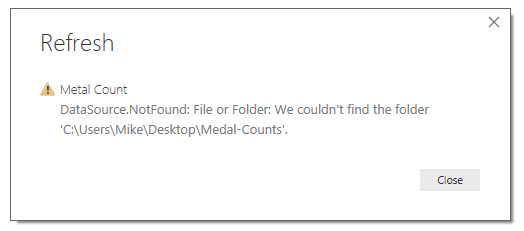
Reopen your PBIX file, on the Home ribbon click the Refresh button. Ooops, since we renamed the folder we now have an error.
Error Screen
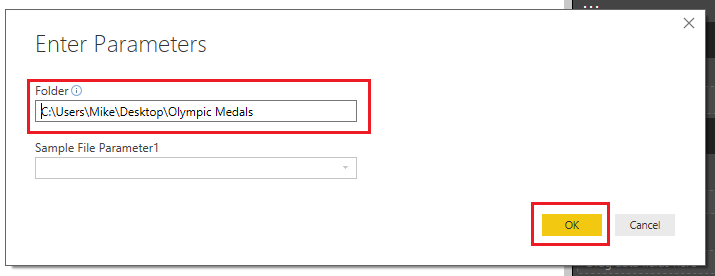
To fix this click the bottom half of the Edit Queries button on the home ribbon, and select Edit Parameters. Then modify the Folder field to include the new name of the other folder Olympic Medals. Click OK to proceed.
Edit Folder Location
A message bar will appear under the Home ribbon. Click Apply Changes to complete the data load. PowerBI will reload all your data using the context of the new folder.
Now this is an elegant solution for sharing PBIX files and their corresponding data files with coworkers. This is just a simple example of how you would use parameters. There are a multitude of other really good use cases for using parameters within your queries. Thanks for reading along, be sure to share if you like this tutorial.
March is an exciting month, and with this release of Power BI we have been given some long asked for features. One such feature is the ability to import a color theme. The color theme defines the starting colors for your visuals. Before the ability to import a theme one would have to first define each color that they want to use in a Power BI report by changing each visual to have the correct color scheme. Color themes are useful when trying to make a dashboard and you want to use colors that resemble a company’s product or logo. Alright, let’s get started and make and add our own color theme to a report.
Begin by opening up Power BI Desktop. Make sure you have the latest version of Power BI Desktop, you can download the latest version here. The import color theme feature is available in the March 2017 release.
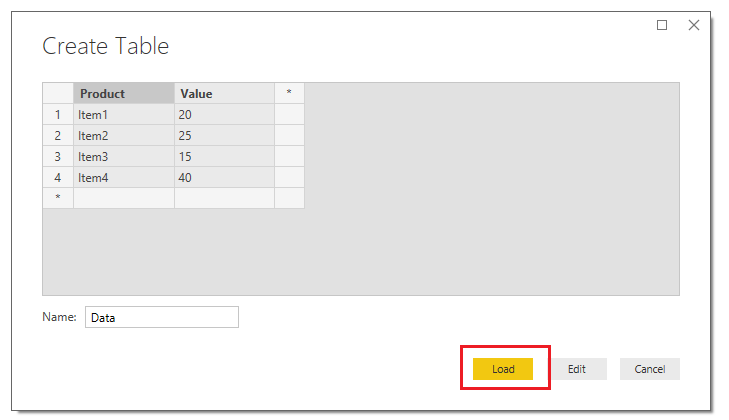
On the Home ribbon click the Enter Data button. Enter the following table of data and name the table Data.
Product
Value
Item1
20
Item2
25
Item3
15
Item4
40
The Create Table should look similar to the following. Click the Load button to proceed.
Load Data Table
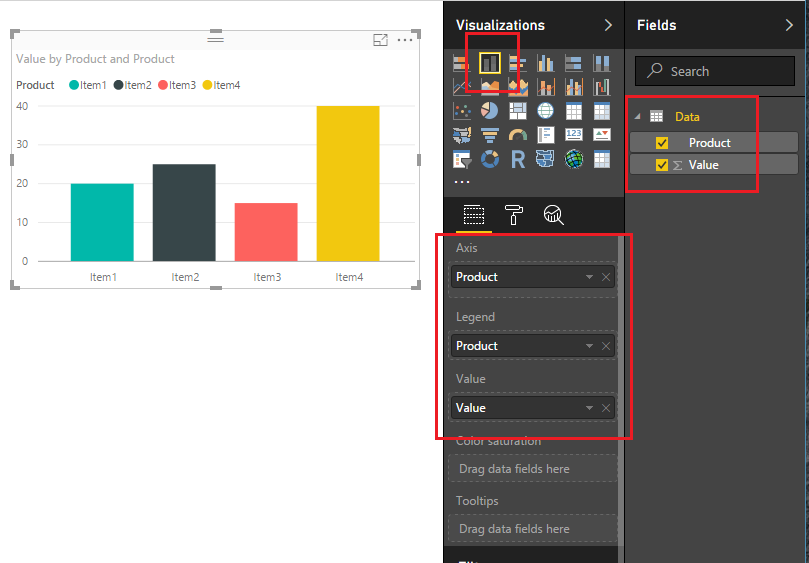
Power BI will load the data to memory and the Fields pane will reveal our newly created columns. Add the Stacked Column Chart on the report page and appropriate fields shown in the image below. You will notice that the default colors are automatically overlaid onto our visual when we add the Product to the Legend visual field.
Add Stacked Column Chart
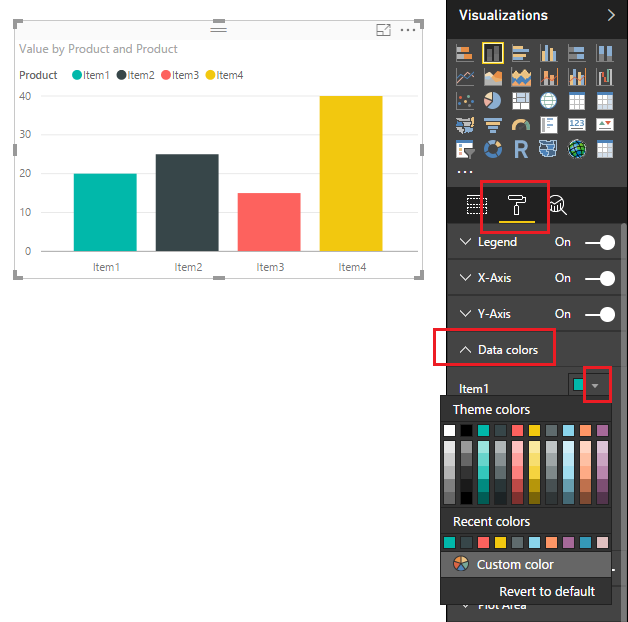
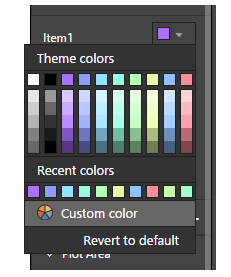
Next, let’s take a peek at the standard colors that are offered by default from Power BI. Click on the Paint Roller found in the Visualizations pane. Then expand the data field labeled Data colors. Under Item1 click the little triangle. This will expose the current color scheme that is loaded.
Default Color Scheme
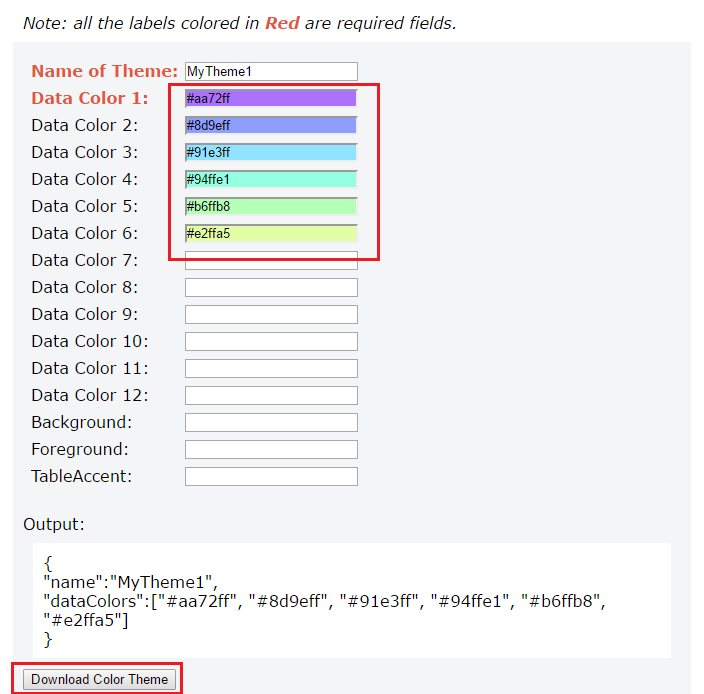
Now we will load the new color theme. But before we can load the color theme we have to generate the color theme first. The color theme has some requirements. First the color theme must be written as a JSON file and must adhere to the JSON format. For developers this will be a very simple google search to accomplish this. However, I know there are some out there that do not enjoy doing development work. So, in a PowerBI.Tips first, I have developed a custom tool to make the color theme generation super simple.
Introducing the PowerBI.Tips Color Theme Generator (CTG) to help Power BI users create quick and easy JSON code files to input into Power BI for the color themes. Not everyone has a coding background, and though there will be tutorials and examples of how to set up the JSON, if you aren’t familiar with the language a small typo could have you spending precious time troubleshooting the issue.
update 3/15/17: The Advanced Theme Generator has been released. Find the tool here.
Click the following link to open up the PowerBI.Tips Color Theme Generator in a different Browser window. Once the browser loads the Color Theme Generator follow the instructions listed at the top of the page to select your colors. The only required fields are the Name, and at least one color. For this tutorial I selected a number of nice pastel colors. Click the Download Color Theme button to download the JSON file that we will use in Power BI.
Note: The Generator was tested on Google Chrome. Also, clicking the Download button will download the JSON file to your browser’s default location. You will need to know this file location to load the file into Power BI Desktop.
PowerBI.Tips Color Theme Generator
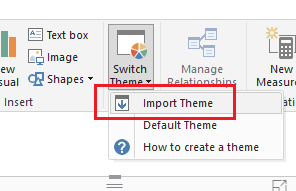
Head back over to Power BI Desktop. On the Home ribbon click the button labeled Switch Theme. Then click Import Theme.
Import Theme Button
Note: If you want to remove your custom theme you will click on the Switch Theme, then click on the Default Theme. The normal power BI colors will be restored.
Navigate to where your browser downloaded the file. Select the file labeled PowerBI-Tips Color Theme. Click Open to load the theme.
Load Color Theme
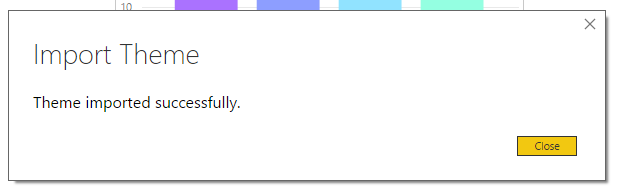
PowerBI will prompt a message letting you know everything loaded correctly. Click Close to see the new theme applied to our visual.
Theme Load Successful
We can now see our custom theme by clicking on the Paint Roller found in the Visualizations pane. Then expand the data field labeled Data colors. Under Item1 click the little triangle.
Tada, now we have a custom color scheme that we create and loaded. Also, now that we the JSON file you can modify the file and keep it for future projects.
Loaded Custom Color Theme
Thanks for following along. If you liked this tutorial please be sure to share. Also if you want to know more about me you can visit my About page and follow me on twitter or Linkedin for updates.
This month it is a major game changer. PowerBI has introduced the ability to change the color theme of your Power BI reports. What does this mean for you? Well, this means hours of time saved. Previously when you needed to style a report you would need to click on every visual and change the colors. This is useful when you have a specific theme or product you want to match colors with. Now all this can be done with a couple clicks for all visuals across the entire report. Wow!!!
Additionally, the ability to generate a theme is awesome but you also will need a tool to help you create a color theme. In response for this need I have created a Color Theme Generator that will aid you in the creation of making color themes. To read the tutorial on color themes visit this link.
To provide the best experiences, we use technologies like cookies to store and/or access device information. Consenting to these technologies will allow us to process data such as browsing behavior or unique IDs on this site. Not consenting or withdrawing consent, may adversely affect certain features and functions.
Functional
Always active
The technical storage or access is strictly necessary for the legitimate purpose of enabling the use of a specific service explicitly requested by the subscriber or user, or for the sole purpose of carrying out the transmission of a communication over an electronic communications network.
Preferences
The technical storage or access is necessary for the legitimate purpose of storing preferences that are not requested by the subscriber or user.
Statistics
The technical storage or access that is used exclusively for statistical purposes.The technical storage or access that is used exclusively for anonymous statistical purposes. Without a subpoena, voluntary compliance on the part of your Internet Service Provider, or additional records from a third party, information stored or retrieved for this purpose alone cannot usually be used to identify you.
Marketing
The technical storage or access is required to create user profiles to send advertising, or to track the user on a website or across several websites for similar marketing purposes.