Month: November 2017

  • Custom Usage Metrics Reporting

    Custom Usage Metrics Reporting

    One of the really cool features contained within the PowerBI.com service is the ability to monitor how often your dashboard or report is being viewed.  You’ll find this feature by opening up either a Dashboard or a Report, then clicking the button called Usage Metrics.  Clicking this button will generate a custom usage report.  For more details on Report Usage Metrics see the following article from Microsoft.

    Note: In order to see the usage metrics report you must be able to edit the report and have a minimum of a Power BI Pro license.  Also, the usage metric report only captures the last 90 days of report usage.

    Usage Metrics on Menu Bar

    The sad thing is that this report is only the usage metrics for the Dashboard or Report that you opened.  This report is also read only and cannot be modified.  However, there is a way to fix this, and see all the usage on all the Dashboards or Reports within a workspace.

    Let us begin.

    You will first need to log into PowerBI.com, once you have logged in navigate to either a Dashboard or Report.  To open a dashboard or report start by opening a workspace in the left navigation bar.  If you are already in a workspace you can open a Report or Dashboard by clicking on the Dashboards or Reports headers in the main selection area of the workspace.
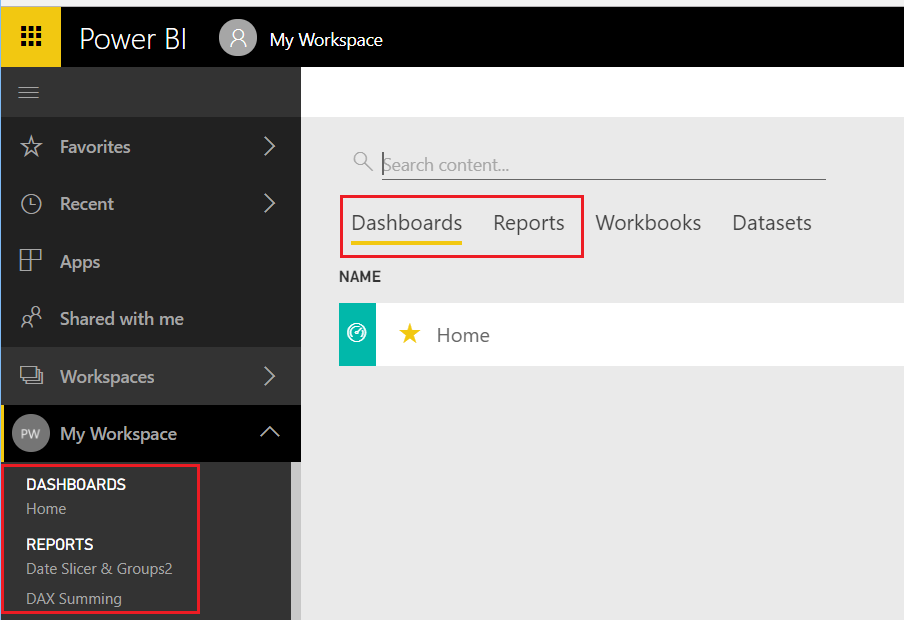
    Navigate to a Dashboard or Report
    Navigate to a Dashboard or Report

    For this tutorial I will use a report but the same steps will work for both the Dashboard and Report usage metric reports.  Open up the report that your interested in viewing the metrics.  I am using my report called Home for this example, this report is used on PowerBI.Tips, and you can view the report here if your interested.  Now that we have opened the report, click on the Usage Metrics link on the top navigation bar.  This will open up a usage metrics report.   This report is read only and does not allow changes.
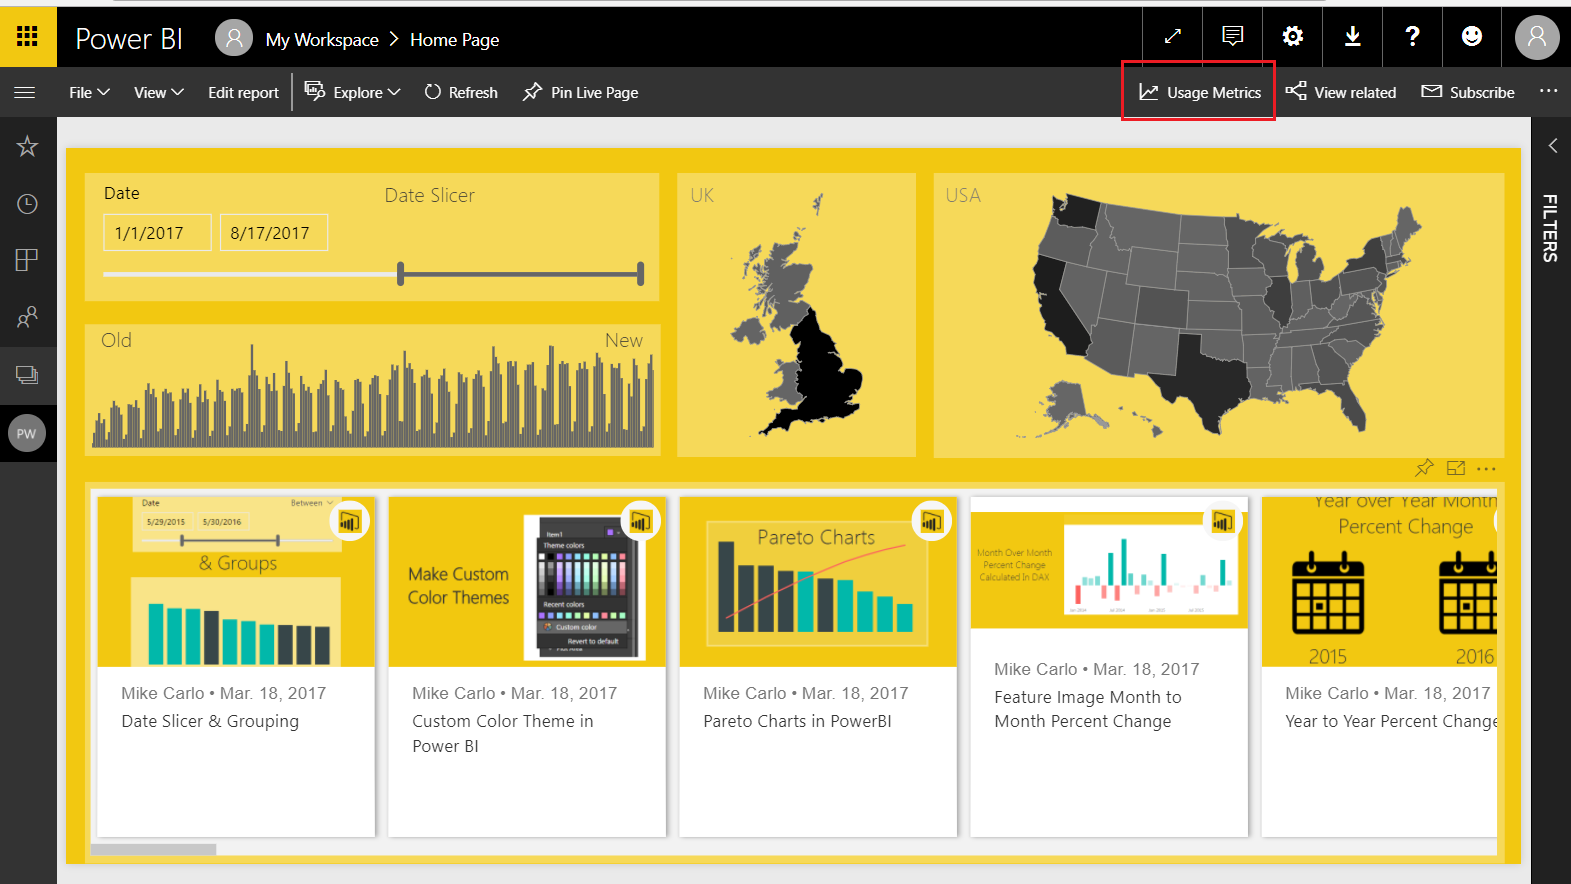
    Link to Report Metrics
    Link to Report Metrics

    Here is where we get sneaky… If you observe the URL for the usage metrics report it looks like the following:

    https://app.powerbi.com/groups/me/reports/c6....26/ReportSection?filter=Reports~2FReportGuid%20eq%20%27....ca%27

    Notice the middle of the report where it states “?filter=Reports” this means the Usage Metrics report has been filtered for only one report in the workspace.  The report filter context is passing the Globally Unique Identifier (GUID) of the selected report down to the Report Metrics.  This is good news because knowing this we can modify the report and remove the filter, thus allowing visibility to all the reports in a workspace.

    First we will need to save a copy of the report so we can make changes.  With the Usage Metrics report open click File then in the drop down click Save As.

    Save Report As
    Save Report As

    This will save a copy of the report into the workspace.  Notice we now see in the Power BI header bar that the report has been named Report Usage Metrics Report – Copy.  Also we can now see an Edit report button.

    Usage Metrics Report - Copy
    Usage Metrics Report – Copy

    Click on Edit report to start changing the report.  As soon as you open the report you can see in the visualizations pane that there is a Report filter applied.  Remove this filter by Clicking the little Grey X for the ReportGUID in the Report level filters section of the visualizations pane.
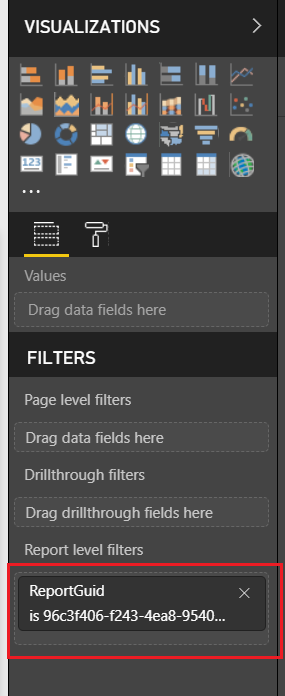
    Report Filters
    Report Filters

    After removing the report filters, we can see all the data from all reports.

    Let the modifications begin.

    On the left of the report we have a report page slicer.  This allows you to see the activity on one page of a report.  Now that we can see all the reports across the workspace filtering only pages of each report doesn’t make sense.  We need to add an additional slicer to select reports we are interested in.
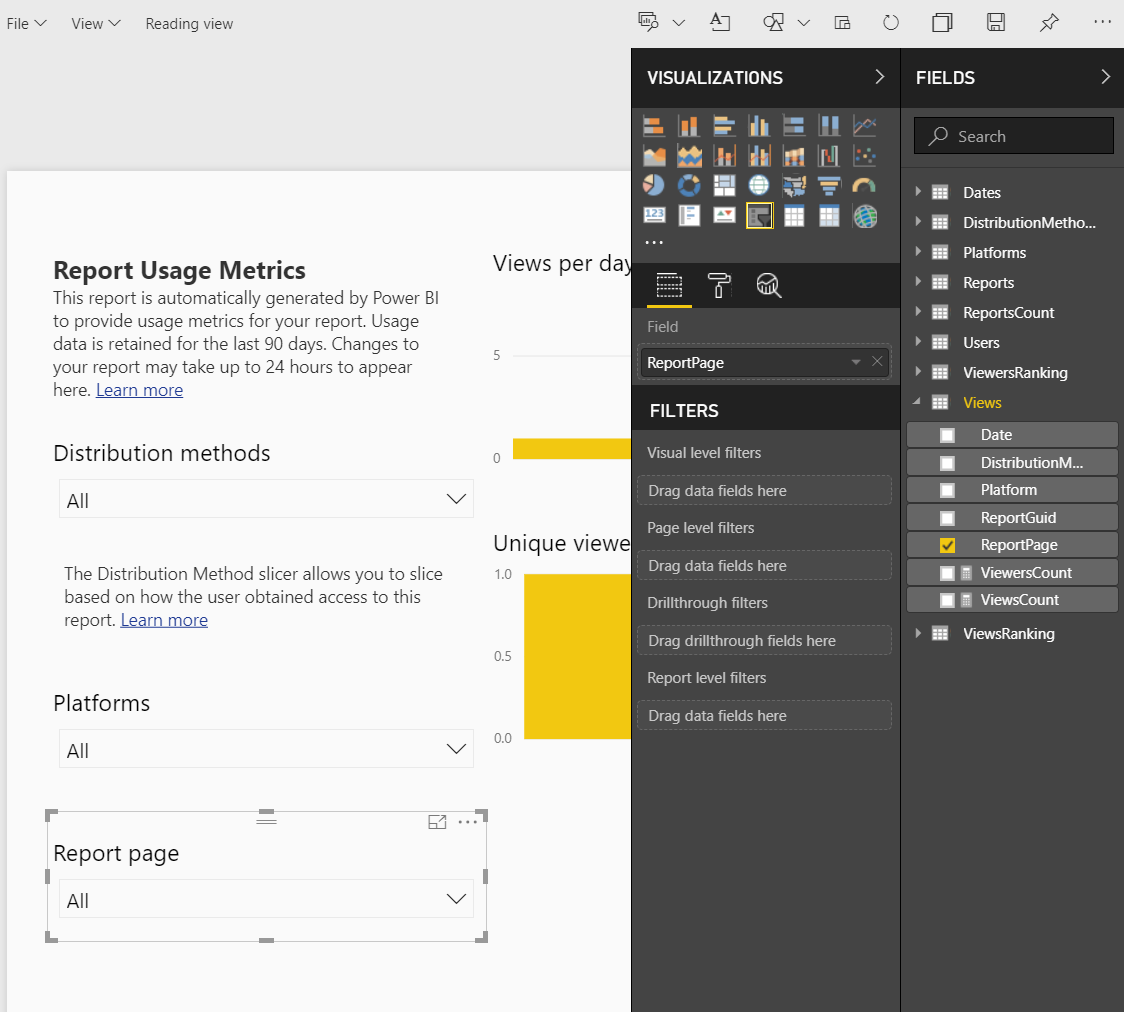
    Report Page Slicer
    Report Page Slicer

    Select the Report Page Slicer the using Ctrl C copy the slicer, then paste it using Ctrl V.  We should now have two slicers on the page.  Select the top slicer named Report page.  Change the field of the top slicer from ReportPage to DisplayName. The DisplayName is found under the Reports table in the Fields pane.
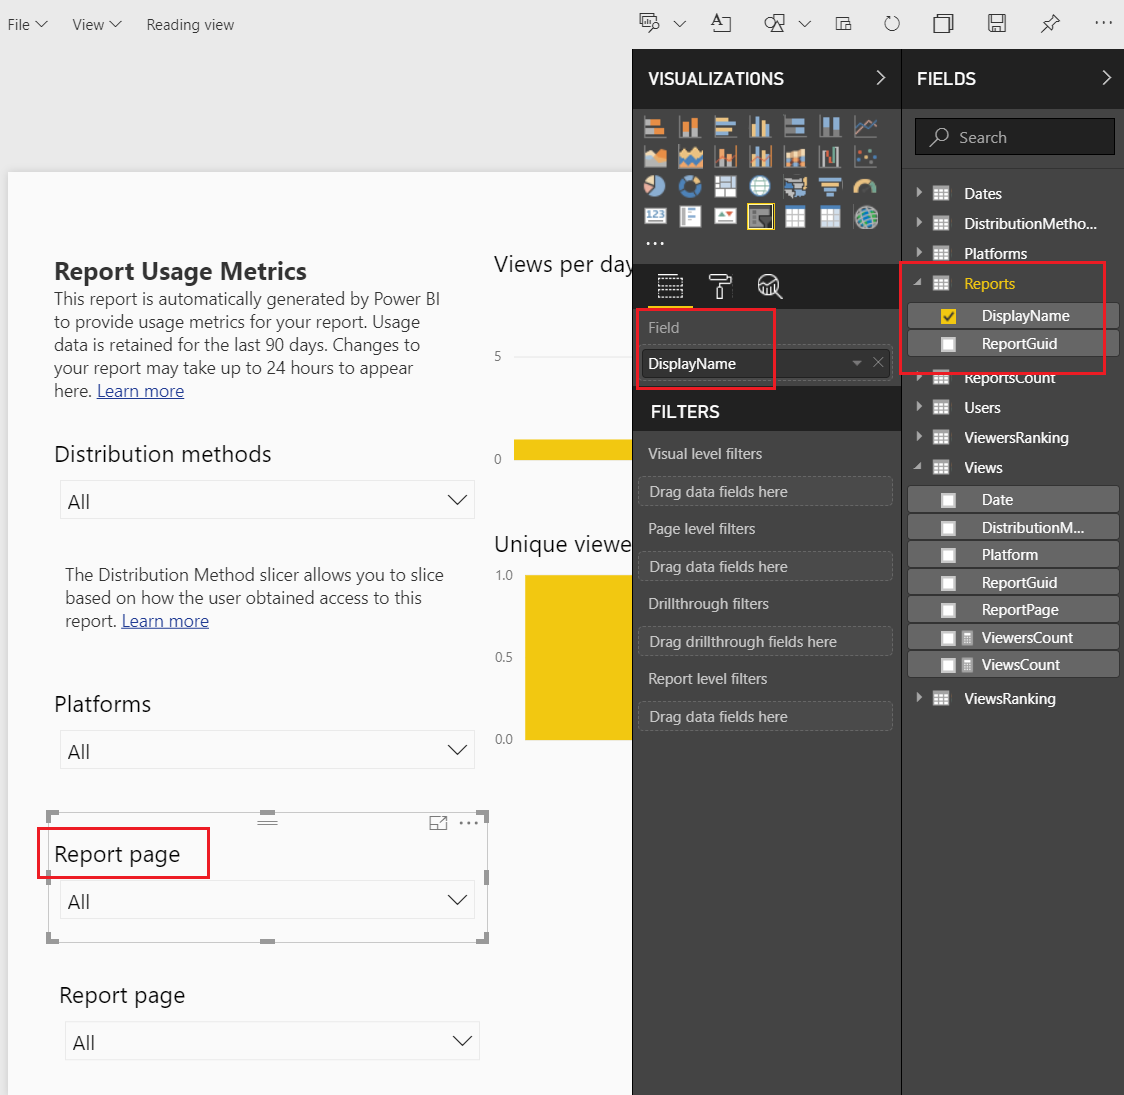
    Link Report Display Name
    Link Report Display Name

    Notice even though we changed the slicer information that the slicer title did not change.  We have to manually change the title description in the display settings.  Click the Paint Roller to open the display settings.  Expand the Title section and change the Title Text to Report Name.
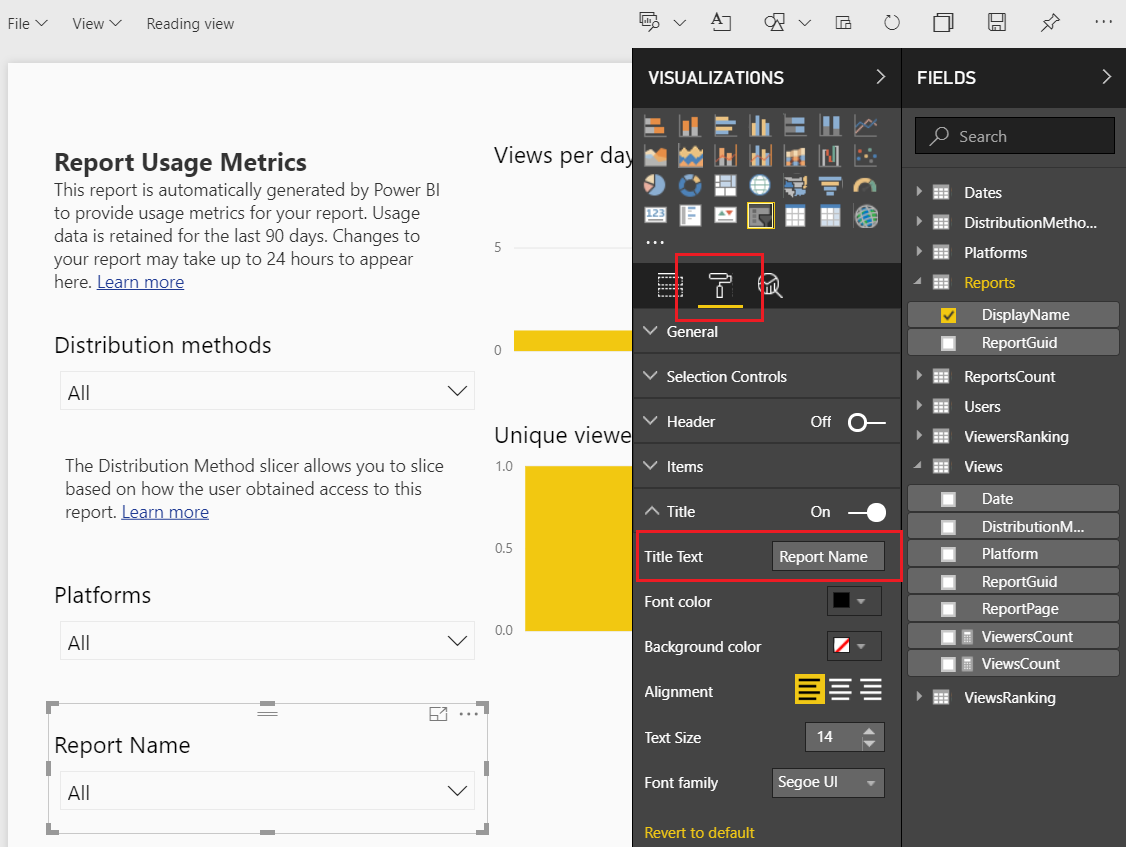
    Change Slicer to Report Name
    Change Slicer to Report Name

    The title of the slicer visuals is now changed. Sweet!

    Let’s move on to modify some of the standard visuals.  Select the report titled Views per day and change it to the following settings:
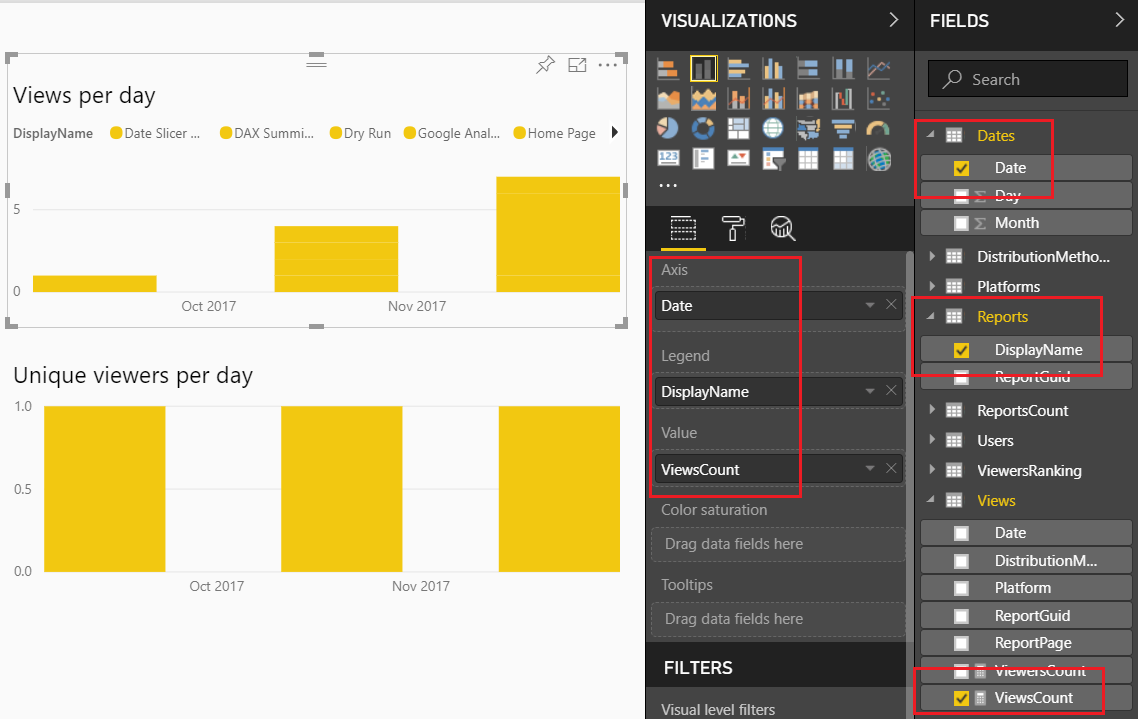
    Views Per Day Change
    Views Per Day Change

    Note: We changed the Axis Date column field.  We removed the date field from the views table and added the date from the Dates table. 

    This allows us to see over time the number of views per report.  Lets clean this up a bit.  Change the settings of this visual by Clicking on the Paint Roller ribbon.  Start by Turning Off the Legend, then open up the Data Colors, and Click the Revert to default to return the visual to it’s normal colors.
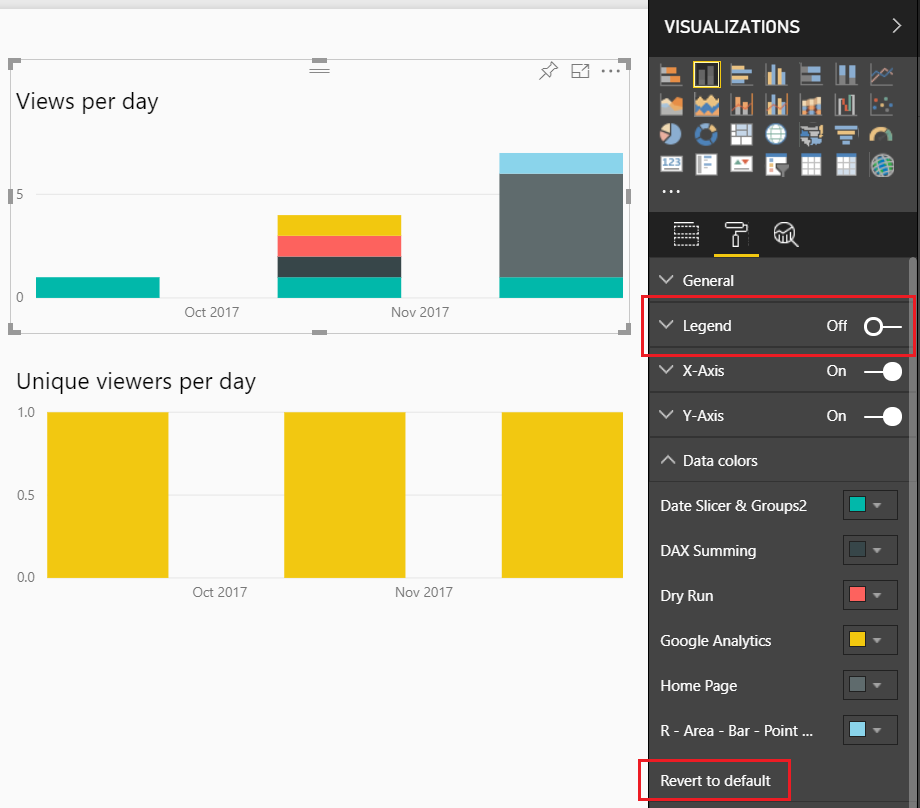
    Change Visual Settings
    Change Visual Settings

    Now, lets modify the Unique viewers per day.
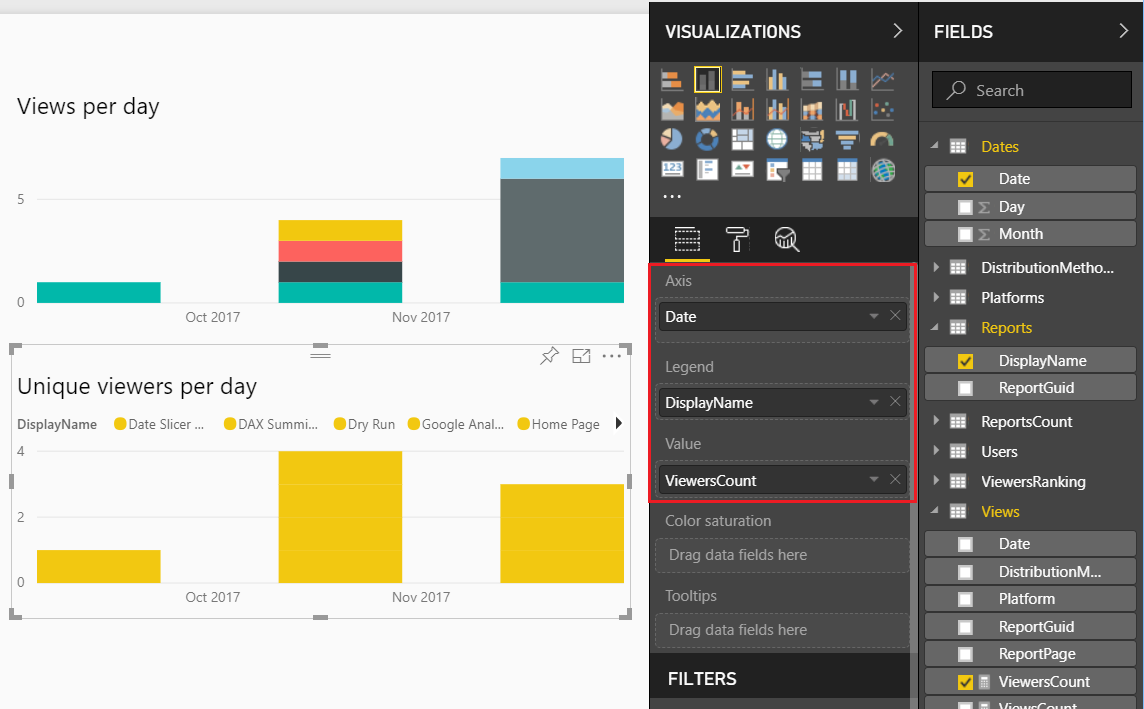
    Change Unique Viewers per Day
    Change Unique Viewers per Day

    Again, the formatting of this visual isn’t great so let’s modify it.  Click on the Paint Roller again and Turning Off the Legend, then open up the Data ColorsClick the Revert to default to return the visual to it’s normal colors.  Finally, change the visual type from Stacked Column Chart to the Ribbon Chart.  Your visual should look like the following:
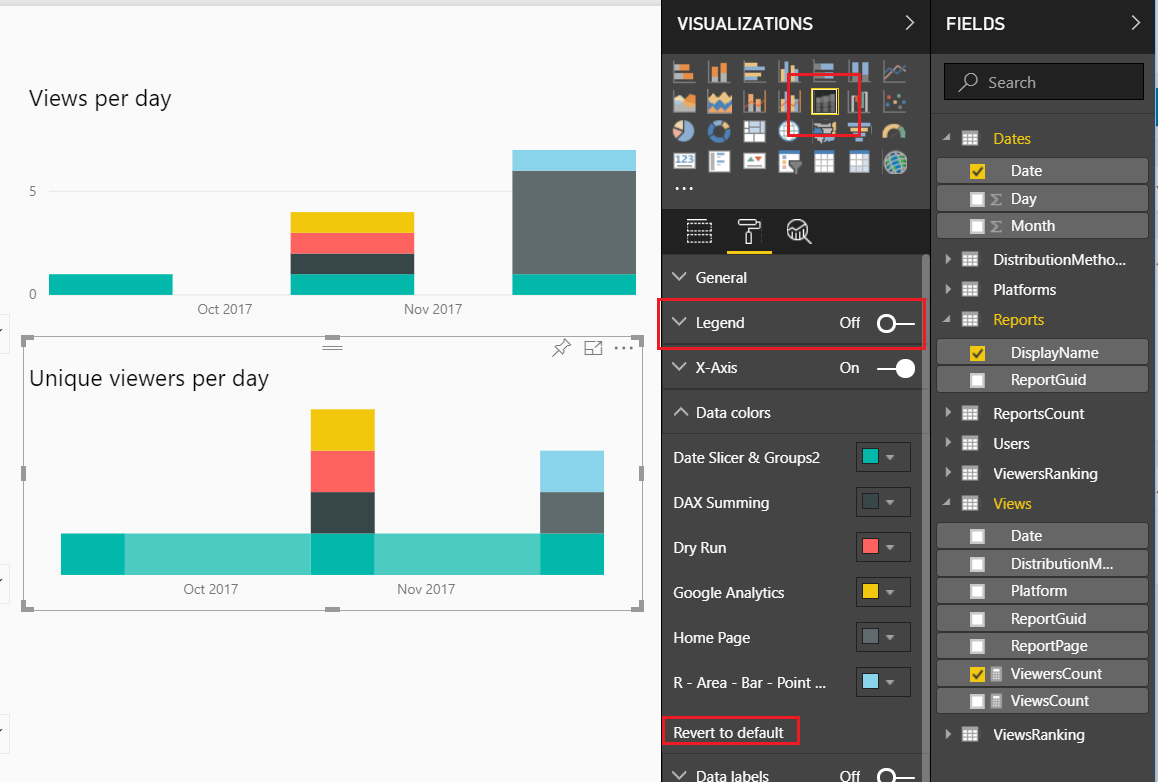
    Change Visual
    Change Visual

    This visual will show you which report has largest viewing audience.

    You might have noticed that in both of these visuals I’ve been removing the legends.  Which means, you don’t know which report is represented by each color.  We will fix that by adding a final visual.  Add the Bar Chart visual from the visualization pane.  Add the following field names to the visual, as shown below:
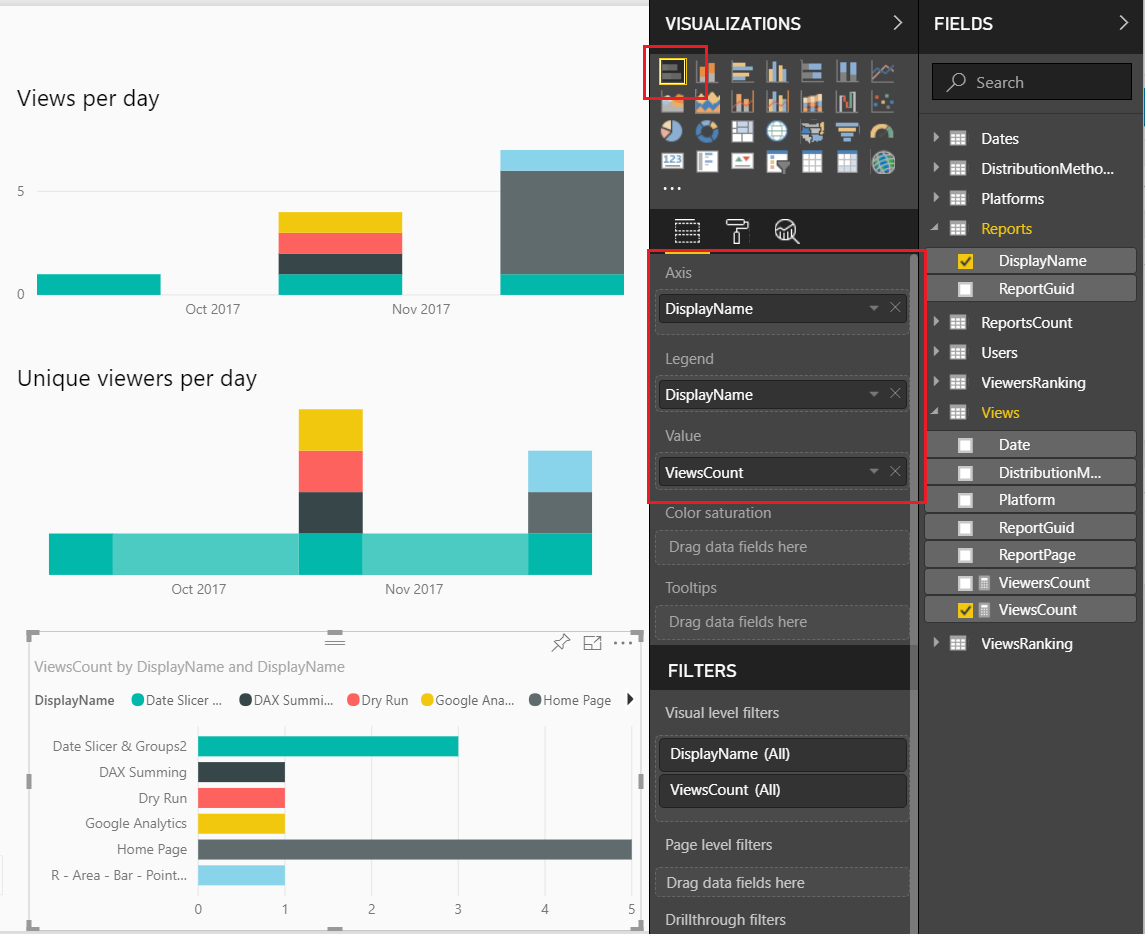
    Add Bar Chart
    Add Bar Chart

    Next, we will format the visual to clean it up.  Make the following changes, Toggle the Legend to OffToggle the X-Axis to Off, Toggle the Data labels to OnToggle the Title to On and change the Title Text to Report Views, finally change the Font color to Black and Text Size to 14.
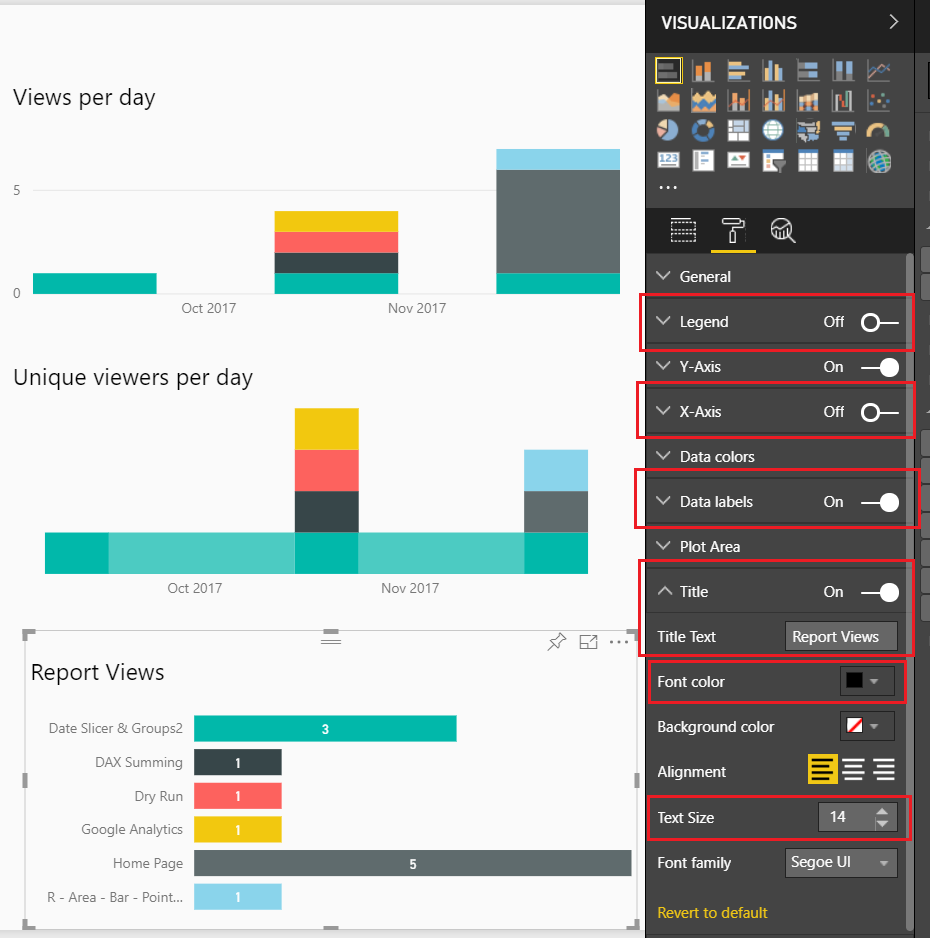
    Formatting the Bar Chart
    Formatting the Bar Chart

    We want to sort the reports not by name but by how often they are viewed.  To do this, Click on the ellipsis and from the drop down Select sort by ViewsCount.

    Now we have a custom Usage Metrics Report.
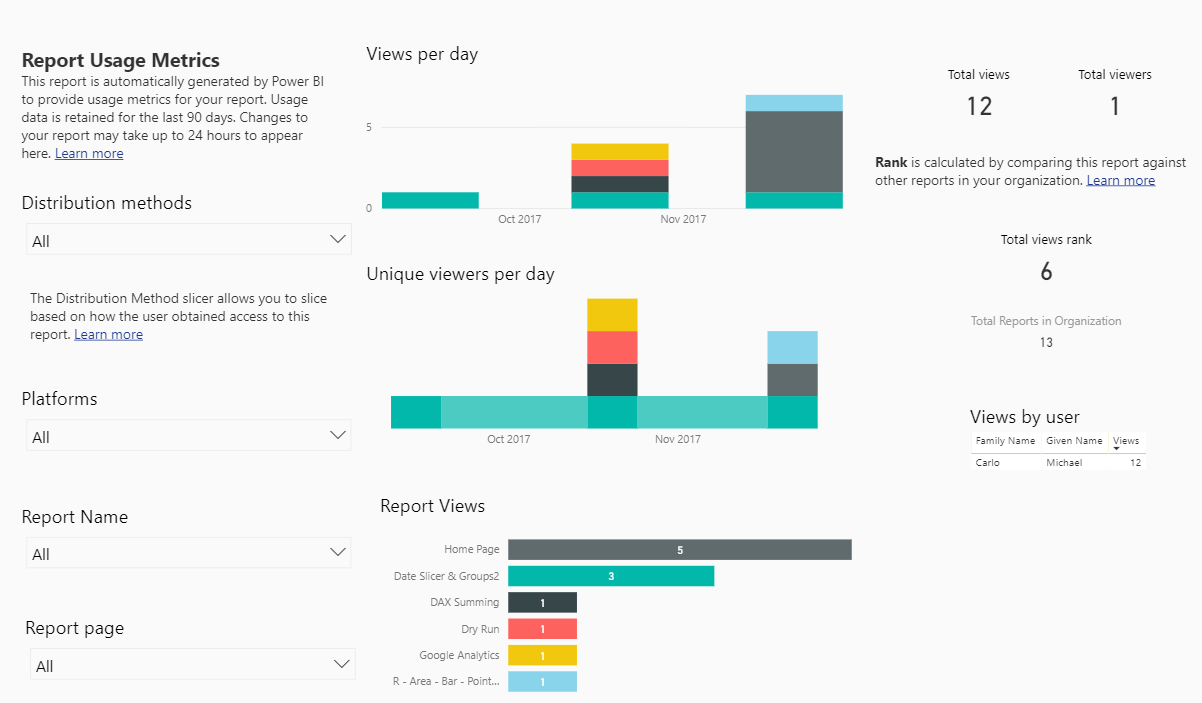
    Final Report
    Final Report

    Be sure to save the file.  Click on File then in the drop down Click the Save button.
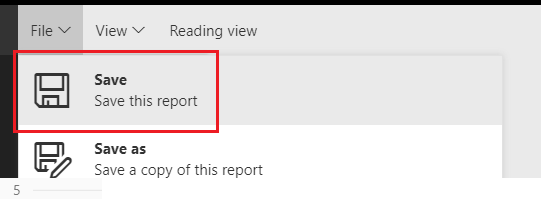
    Save Changed Report
    Save Changed Report

    You will notice that our modified Usage Metrics Report will be saved in the Workspace.

    Thanks for following along.  If you found this tutorial helpful please share it with someone who will find this valuable.

  • Power BI Connections: Import

    Power BI Connections: Import

    Power BI’s default connection type is Import. In fact, if you have never dealt with a data source that handles multiple loading methods, you may never know that there are different loading methods because Power BI automatically connects via import. However, if you’ve ever worked with sourcing information from databases or models, then you have seen the option to select Import vs. Direct Query or Live Connection.

    Note: This is a continuation of the Power BI Connections series.  If you would like to read the overview of all the Power BI Connection types you can do so here.

    Below is a quick chart to outline some of the considerations to help you decide whether import is right for you.

    Connection Type Outline
    Connection Type Outline

    Import is the only connection type that brings to bear the full capabilities of the Power BI Desktop. As you move from Import to Direct Query to Live Connection, you trade off ease of use for solutions that will scale.

    Import will pull in the data from the data sources that you have connected to and store & compress the data within the PBIX file. The eventual publishing of the PBIX file will push the data to Azure services supported in the Power BI Backend. For more information on data movement and storage see the Power BI Security Whitepaper.

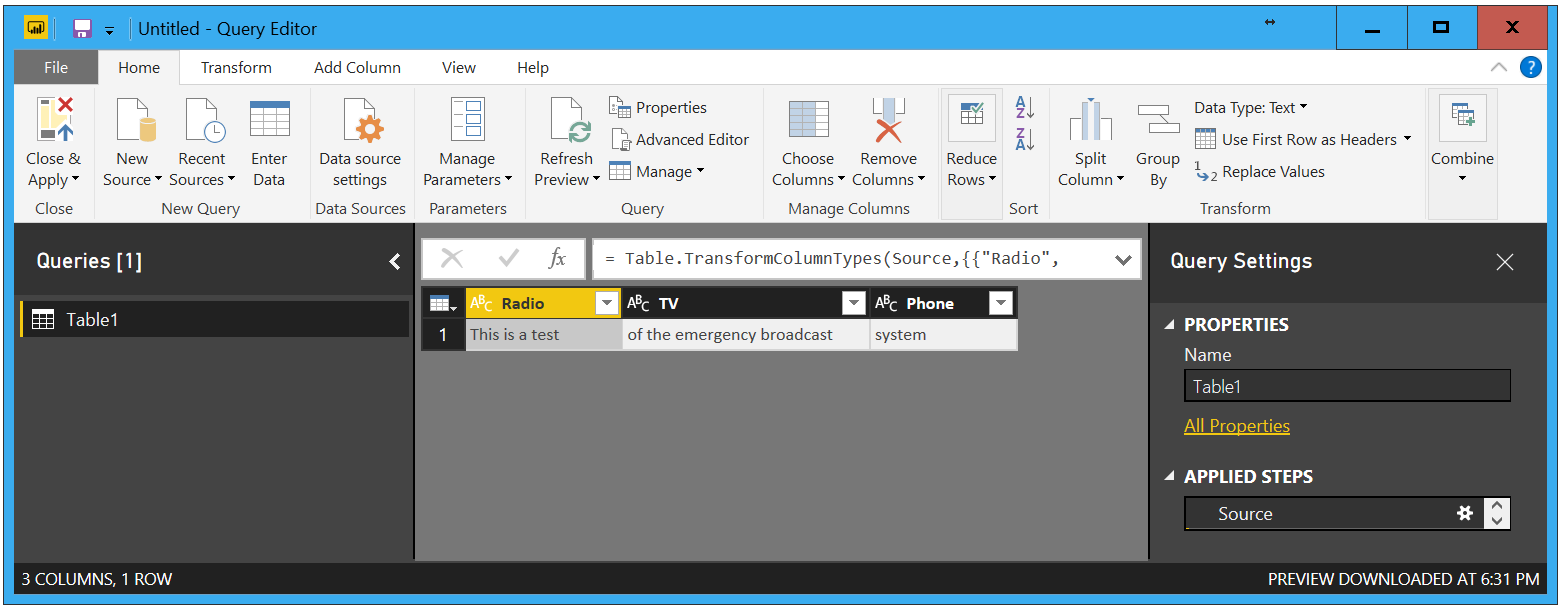
    When using import, the full Edit Queries suite is available to mash up any data source, transform data-sets and manipulate the data in any way you see fit.

    Query Editor
    Query Editor

    Once you click Close & Apply, the data is loaded into the “front end” of Power BI into the Vertipaq engine.

    Note: The Vertipaq engine is used in both Excel and SQL Server Analysis Services Tabular models. In simple terms, it is the backbone that compresses all your data to make it perform extremely fast when visualizing, and slicing & dicing. For more detailed information on the engine see an excerpt from Marco Russo & Alberto Ferrari’s book “The Definitive Guide to DAX: Business intelligence with Microsoft Excel, SQL Server Analysis Services, and Power BI” found here.

    At this point it is ready for you to extend by building out the relationships between your objects in the model section. After the model is set up you will now be able to add any additional calculations in the DAX (Data Analysis Expressions) formula language. There are two types expressions that you can create, measures and calculated columns. To create these, you can go to modeling, and select the option. When you do this, the formula bar will display. You can also right click on any column or field and select “New measure” or “New column” from those drop down lists.

    New DAX Measure or Column
    New DAX Measure or Column

    Other than the formula bar with intelli-sense, there are several built in tools that can help you build those calculations.

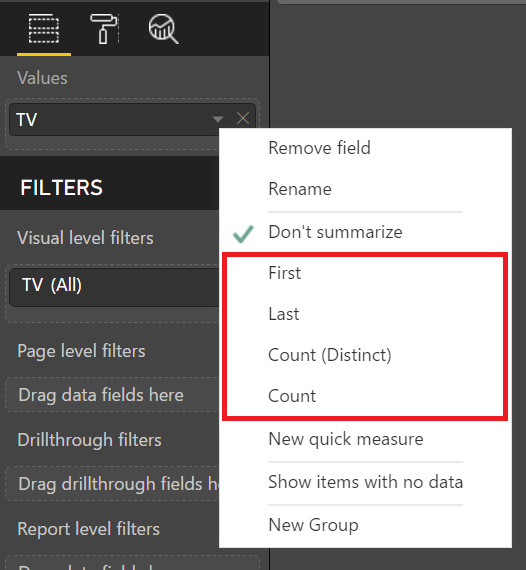
    The first method is to Right Click on the desired field and select an implicit calculation from the drop down:

    Using Implicit Calculations
    Using Implicit Calculations

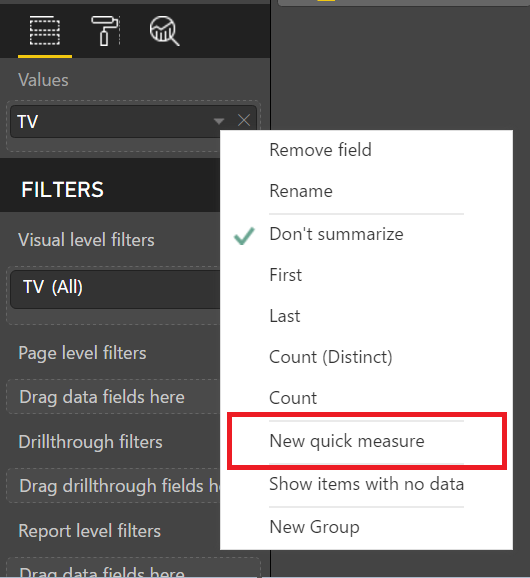
    The second is Quick Measures.  This can be accessed by using right click as described above.

    Using Quick Measures
    Using Quick Measures

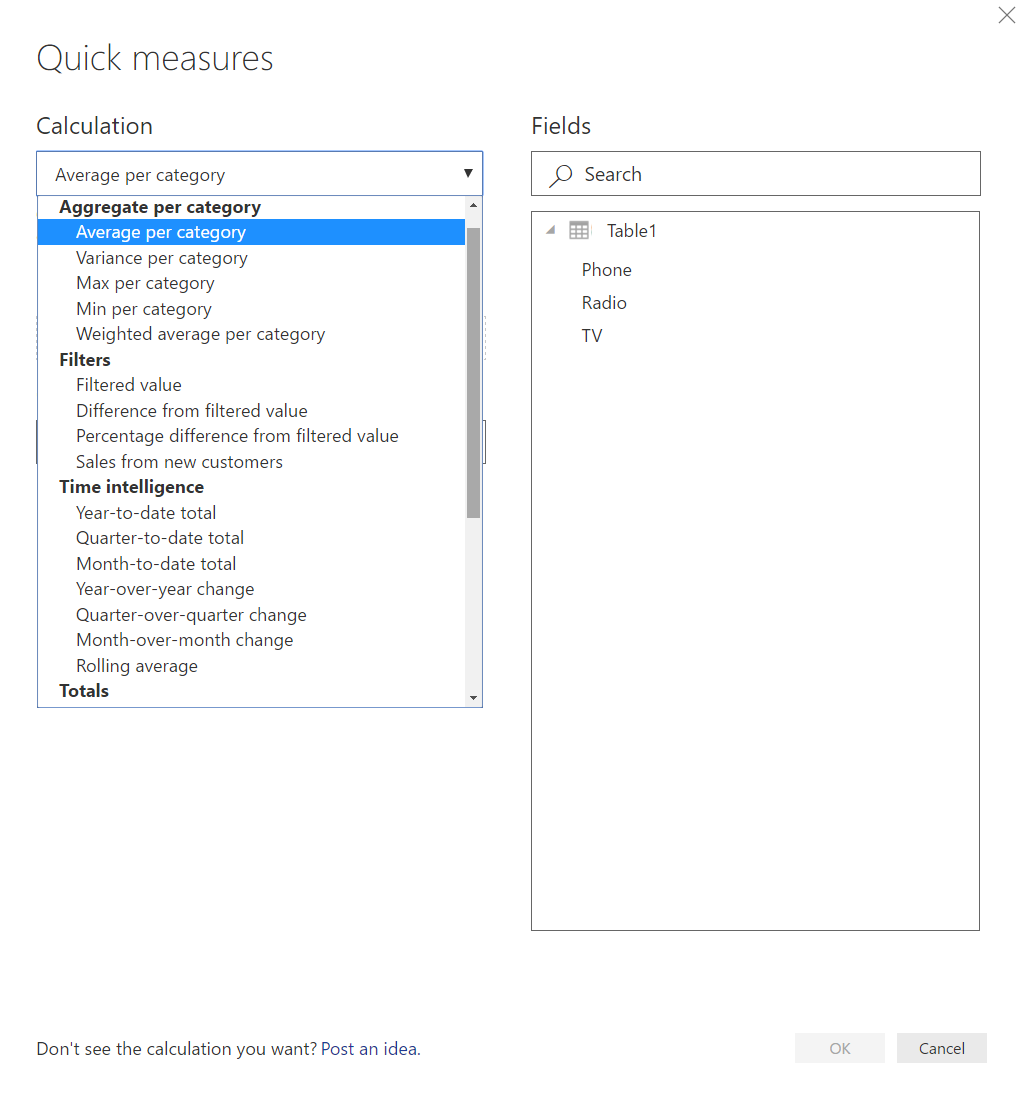
    Here is an example of the Quick Measure dialog box:

    Quick Measure Dialog Box
    Quick Measure Dialog Box

    Quick Measures allows you to choose from a wide variety of calculations to generate a measure. Once the measure is created, you can interrogate the measure and see the code that was generated.  Click on the measure (denoted by a little calculator next to the text) created by the Quick Measure dialog box to see the DAX code.

    Here is an example of what that looks like:

    Sample of Quick Measure
    Sample of Quick Measure

    This is a great method to get your feet wet while you’re learning DAX.

    Note: there are a lot of safety features added to these Quick Measures, such as, an “if” statement wrapped in a “isfiltered”.  You might have to remove these bits of code in order to play with the measure.

    When you have completed your report and publish the report & corresponding dataset to the Power BI Service, you will need to schedule a refresh.  This will be required for any report which relies on the Import Connection. There are numerous use cases that surround whether or not you need a gateway, but a simple rule applies. If the data comes from an on-premises source, you will need one, for cloud sources you usually do not, but you can find in depth refresh documentation here.

    The Import connection has the least amount of restrictions between the three methods, Import, Direct Query, and Live Connection. However, there are a few Import restrictions you should be aware of.

    First, depending on your data source and the size of the data set, the processing of the model could take a bit of time.

    Second, since all the data is being loaded into a table, there is a limitation on how big the file can get for successful publishing to the Power BI Service. That limit is 1 GB for free users & Power BI pro users, 2 GB for Report Server Reports and for Premium Users the size is only bound by the amount of memory you have purchased.

    Note:  The PBIX file can get as large as you want, however, it won’t let you publish.

    Using Import is good when:

    1. You can schedule your data to refresh
    2. Data only needs to be refreshed periodically
      1. Can be refreshed up to 8 scheduled refreshes in a day (restriction from Power BI Service)
    3. The amount of data your importing is relatively small (doesn’t need to scale)
    4. You need to mash up multiple sources such as Azure SQL database and google analytics data sources

    In summary, the Import method is the most flexible, provides all the tools to connect, mashup, extend and visualize your datasets within the Power BI Desktop. It is likely the most used connection type and is the default for all connections. The data you connect to is drawn in, and a copy created and used in both the Desktop and the Service. Scheduled refresh is a requirement for almost all scenarios, and it is likely a gateway is required as well if your data is not located in the cloud.

  • Fixing the Truncating Bar Chart

    Fixing the Truncating Bar Chart

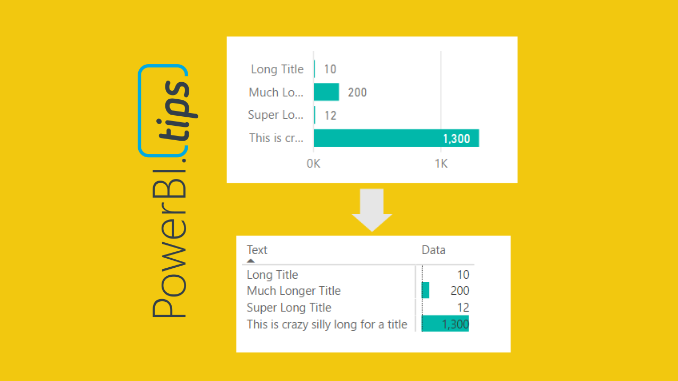
    The more you work with Power BI Desktop it is more than likely you will find some tool limitations that impact your overall design pursuits.  As I have worked with data visualization software, I find there is always a balance between what I want to make and what is possible.  The more you become familiar with your visualization tool, the better you think of report designs that are both beautiful and feasible.  One such design style that I use is to limit the use of slicers on the report page as much as possible.  My solution for removing slicers is adding a stacked bar chart or a stacked column chart.  The chart can be used as a slicer because you can click on the data bars and filter the page of data.  One of the visualization limitations I’ve had to work around was the ability to make a stacked bar chart with long y-axis titles. In order to overcome this limitation we need to fire up our creativity to figure out another way to more accurately control the y-axis labels and the associated bar chart.

    There are two main issues we will need to solve:

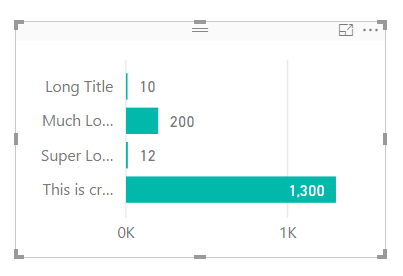
    First issue, when you have text along the y-axis in the stacked bar chart, the text becomes truncated. See below.

    Stacked Bar Chart
    Stacked Bar Chart

    Note: All the text next to each bar is truncated if the text is to long.  This can be fixed by extending the visual to a ridiculous length, as illustrated by the following picture.  While this solves the text issue, this totally defeats the purpose of this visual, provide a “slicer” that can be used to filter the report page with minimal space consumption.

    Super Long Stacked Bar Chart
    Super Long Stacked Bar Chart

    Second issue, when there are super small values next to large values, it is almost nearly impossible to click on the bar to enable the filtering.  In the example image above, it’s easy to click on the value of 1,300 but almost impossible to click on the value of 10.  Womp, Womp, and clicking on the bar text value does not enable filtering, insert ridiculous horn sound, or other familiar but annoying horn sound (as recommended by one of our readers Terence).

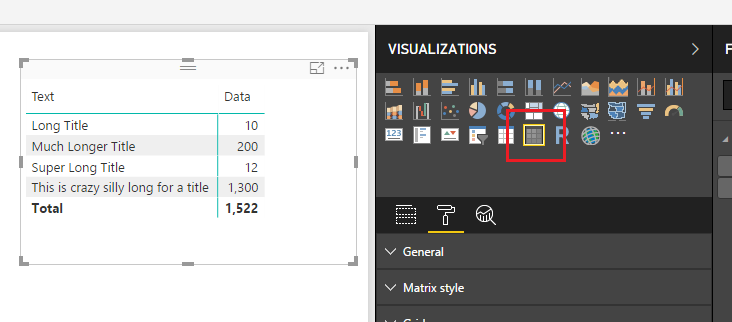
    After some playing around with various visuals here is what I came up with.  First, you must change the visual from a stacked bar chart to the matrix visual.  On the Visualizations pane click on the Matrix visual.

    Matrix Visual
    Matrix Visual

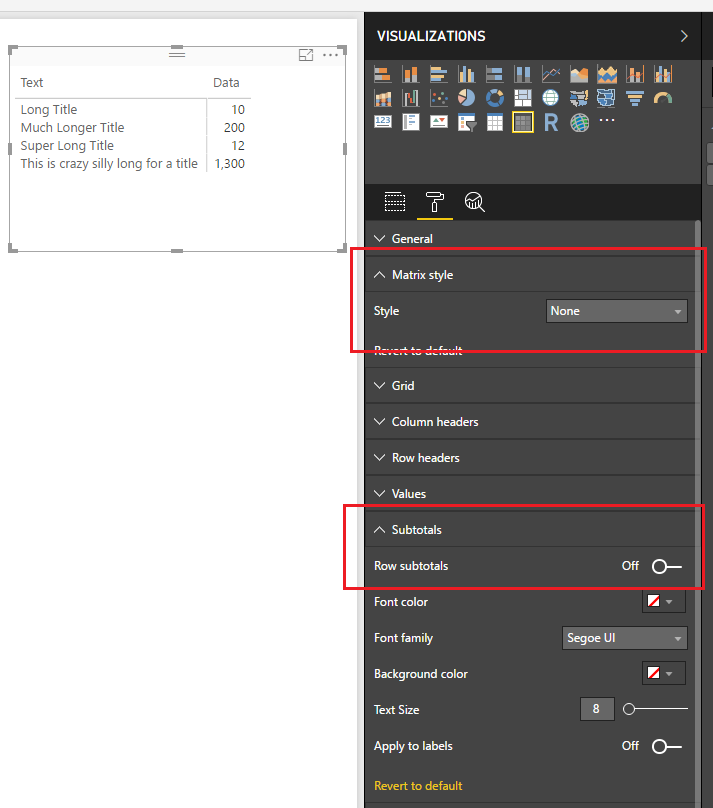
    This will change the visual to a matrix.  It’s a little busy so we will clean it up a bit.  On the Visualizations pane change the Matrix style to None, then open up the Subtotals section and set Row subtotals to Off.  Your visual should now look similar to the following:

    Change Matrix Style
    Change Matrix Style

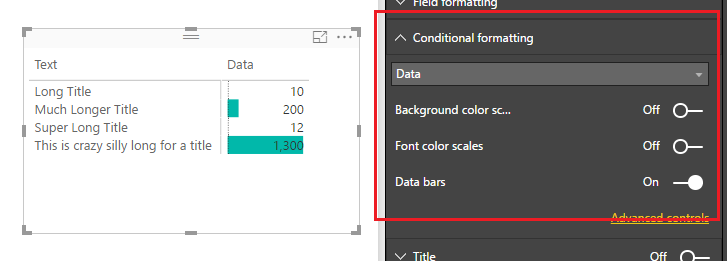
    Next we will add the “bars” to the visual.  Open the Conditional formatting section and turn Data bars to On.

    Turn on Data Bars
    Turn on Data Bars

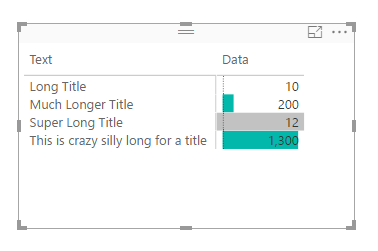
    Short and sweet.  Now we can properly resize the “text labels” of the y-axis and when we try to select small values such as 10, we are presented with a little grey selector bar, enabling us to select very small values.

    Grey Selector Highlighting Bar
    Grey Selector Highlighting Bar

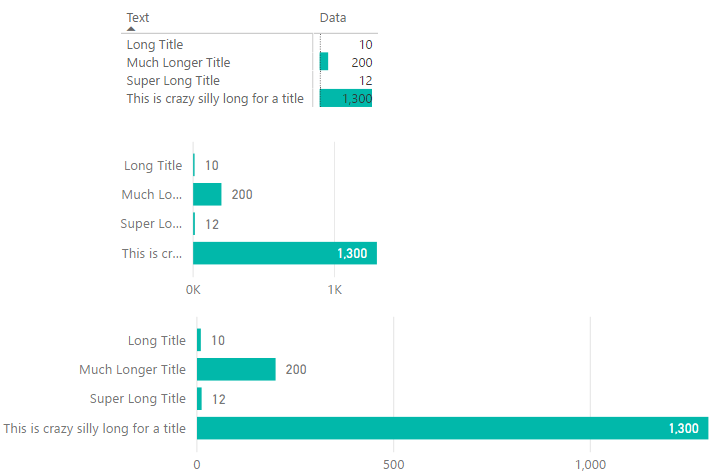
    When you compare all three items side by side you can see that the most condensed version is the Matrix visual with conditional formatting bars.  This provides you much more control when dealing with data that contains long text labels.

    Comparison of Bar Charts
    Comparison of Bar Charts

    Note: There are many ways you can format your matrix to get the desired look. This tutorial is simply covering one type of look.  Additionally, you could hide the text and grid completely by making the grid and column title colors of those match the color of your background, or use could choose one of the many of the grid type options to fit your style needs. 

    Thanks for following along, as always if you found this helpful please share it with someone who might find this helpful.

  • Creating A DAX Calendar

    Creating A DAX Calendar

    There are many cases when you will need to create a date table within Power BI desktop.  This could be as simple as creating a master date table or more complex such as creating a monthly or weekly index number tied to a date.  To create a date table there are two methods for creating a date table.  Method one, create the table directly in the Power BI Desktop, or method two load the date table from the data source.

    For this tutorial we will walk through a couple different examples that are specifically addressing creating a date calendar via DAX expressions.

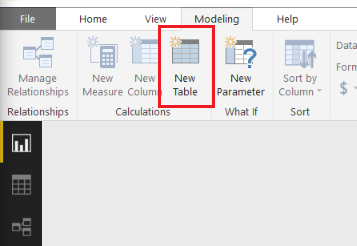
    Let’s begin by making a basic table.  Open Power BI Desktop, on the Modeling ribbon click New Table.

    New Table
    New Table

    In the formula bar enter the following DAX expression:

    Dates  = 
      GENERATE ( 
        CALENDAR ( DATE ( 2017, 1, 1 ), DATE ( 2017, 12, 31 ) ), 
        VAR currentDay = [Date]
        VAR day = DAY( currentDay )
        VAR month =  MONTH ( currentDay ) 
        VAR year =  YEAR ( currentDay )
      RETURN   ROW ( 
        "day", day, 
        "month", month, 
        "year", year )
      )

    This generates a simple date table.  Let’s walk through what is happening here.

    1. The CALENDAR DAX function generates a table with a list of dates from Jan 1 to Dec 31 of 2017.
    2. We define variables (denoted by VAR) to capture details from the column named [Date] that is created by the CALENDAR function.
    3. The Return function generates one row at a time.  The row iterates through each [Date] item in the list which was created by the CALENDAR function.  Variables are re-calculated for every row execution.

    Note: When creating DAX tables as we are doing so in this example, the DAX table only refreshes when the report refreshes.  Thus, if you want the date list to increase over time, or your using a NOW() in the DAX table you will need to be sure to schedule refreshes for the Power BI report in the PowerBI.com service.

    By contrast we can also generate the same data table by calculating our data column by column.  Again, on the Modeling ribbon click the New Table icon and add the following DAX:

    Dates 2 = ADDCOLUMNS(
      CALENDAR( DATE( 2017, 1, 1) , DATE(2017, 12, 31) ), 
      "day", DAY([Date]), 
      "month", MONTH([Date]), 
      "year", YEAR([Date])
      )

    While this is great, we have a date table now, but what we lack is flexibility and automatic time intelligence.  One option to change this table to auto detect dates within your data model is to replace the CALENDAR DAX statement with CALENDARAUTO().

    To use CALENDARAUTO we need to supply a table with a column of dates.  We will quickly create a dummy data table with a couple of dates, so we can use CALENDARAUTIO.

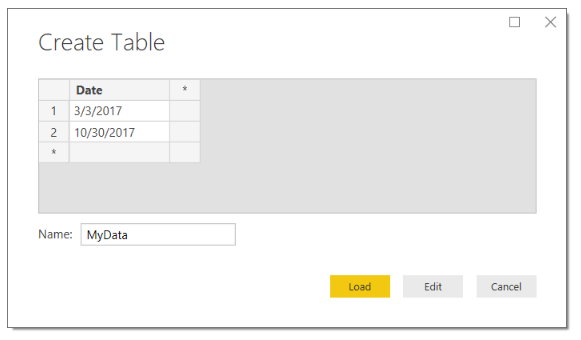
    Click Enter Data on the Home ribbon.  Enter the following information into the Create Table screen.  Click Load to add this data to the data model.

    Enter Date Table
    Enter Date Table

    Now that we have loaded a table into the model with two dates, we can add our new date table.  On the Modeling ribbon click the New Table icon and add the following DAX:

    Dates 3 =
      GENERATE (
        CALENDARAUTO(),
        VAR currentDay = [Date]
        VAR day = DAY( currentDay )
        VAR month =  MONTH ( currentDay )
        VAR year =  YEAR ( currentDay )
      RETURN  ROW ( 
        "day", day,
        "month", month,
        "year", year )
      )

    Note: In the MyData table we added two dates, 3/3/2017 and 10/30/2017.   When we look at the included dates in the new Date 3 table we have every date listed from January 1 to December 31st.  This is because the DAX function CALENDARAUTO will return the entire year of calendar dates even if it only finds one date within a given year period of time.  

    Let’s say we want to build a date calendar that will automatically grow and change over time.  We want to identify today’s date and then create a list of dates for the previous year.

    Moving back to generating a date table by rows we can now use the DAX NOW function.  On the Modeling ribbon click the New Table icon and add the following DAX:

    Dates 4  =
      GENERATE (
        CALENDAR( DATE( YEAR( NOW() ) - 1, MONTH( NOW() ), DAY( NOW()) ), NOW()),
        VAR currentDay = [Date]
        VAR day = DAY( currentDay )
        VAR month = MONTH ( currentDay )
        VAR year = YEAR ( currentDay )
      RETURN ROW (
        "day", day,
        "month", month,
        "year", year )
     )

    Note: In this DAX table we used the NOW() function which returns a date and time.  The same can be done when using the TODAY() function which only returns the date and not the time.

    This now generates is a date table that starts one year ago and populates all the dates until today.  For example, if today is 10-29-2017, then the date list would start at 10-29-2016 and end on 10-29-2017.  Pretty cool…

    Let us move further down the rabbit hole.  We can also start adding calculations that helps us move through date time calculations.  For example, you may want to calculate this month’s total sales and possibly last month’s sales.  By adding columns with an index, you can quickly shift time periods.  Doing so makes time calculations much easier.

    On the Modeling ribbon click the New Table icon and add the following DAX:

    Dates 5 =
      GENERATE (
        CALENDAR( DATE( YEAR( TODAY() ) - 2, MONTH( TODAY() ), DAY( TODAY()) ), TODAY()),
        VAR startOfWeek = 1 // Where 1 is Sunday and 7 is Saturday, thus a 3 would be Tuesday    
        VAR currentDay = [Date]
        VAR days = DAY( currentDay )
        VAR months = MONTH ( currentDay )
        VAR years = YEAR ( currentDay )
        VAR nowYear = YEAR( TODAY() )
        VAR nowMonth = MONTH( TODAY() )
        VAR dayIndex = DATEDIFF( currentDay, TODAY(), DAY) * -1
        VAR todayNum = WEEKDAY( TODAY() )
        VAR weekIndex = INT( ROUNDDOWN( ( dayIndex + -1 * IF( todayNum + startOfWeek <= 6, todayNum + startOfWeek, todayNum + startOfWeek - 7 )) / 7, 0 ) )
      RETURN ROW (
        "day", days,
        "month", months,
        "year", years,
        "day index", dayIndex,
        "week index", weekIndex,
        "month index", INT( (years - nowYear ) * 12 + months - nowMonth ),
        "year index", INT( years - nowYear )
      )
    )

    Note: The DAX equation above will work in your report without any changes.  However, I made a variable called startOfWeek.  This variable allows you to define the start day of the week.  For example, if you data starts a new week on Sunday, then the startOfWeek number will be a 1.  If your data start of week begins on Wednesday then the start of week number would be a 4.  This allows you to auto detect the day of the week and then automatically arranges all your weekly index numbers in the correct format.  Try playing around with this variable to see how DAX table changes.

    So why work so hard on the date table?  Well by having a robust date table you can simplify many of your measures that you need to build for your report.  Consider the following example:

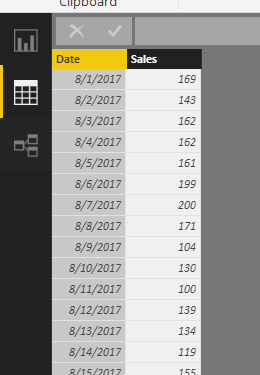
    You have a Sales table with a date and sales column.

    Sample Sales Data
    Sample Sales Data

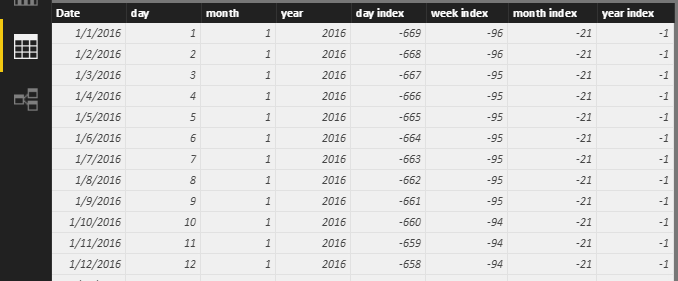
    And you have our fancy Dates 5 Table we created earlier:

    Date 5 Calendar
    Date 5 Calendar

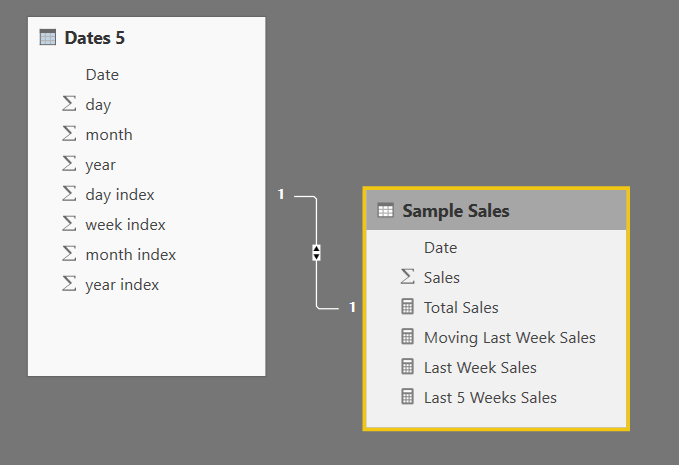
    The Date 5 table is linked to the Sample Sales table:

    Date and Sales Tables Linked
    Date and Sales Tables Linked

    You can now build the following DAX measures inside the Sample Sales table:

    Total Sales = SUM( 'Sample Sales'[Sales] )

    and

    Last Week Sales = CALCULATE( [Total Sales],  ALL('Dates 5'),  'Dates 5'[week index] = -1 )

    If you want to calculate something crazy like the last 5 weeks of sales you can calculate the following:

    Last 5 Weeks Sales = CALCULATE( [Total Sales], ALL( 'Dates 5' ),  AND( 'Dates 5'[week index]  <= -1,  'Dates 5'[week index] >= -5 ) )

    The nice thing about these measures is that every time the data set refreshes the dates will automatically recalculate the last week and last five weeks.

    If you want to be able to handle the additional filter context of the visual, you can pick up the visual filter context using variables (VAR).  Then you can RETURN a calculate function that will shift all your time ranges for you.

    Moving Last Week Sales = 
    VAR filterTime = SELECTEDVALUE('Dates 5'[week index], BLANK())
    RETURN CALCULATE( [Total Sales],  ALL( 'Dates 5'[Date] ), 'Dates 5'[week index] = filterTime - 1 )

    Same goes for a moving sum of the last five weeks of sales.

    Moving Last 5 Weeks Sales = 
    VAR filterTime = SELECTEDVALUE('Dates 5'[week index], BLANK())
    RETURN CALCULATE([Total Sales], ALL('Dates 5'[Date]), AND( 'Dates 5'[week index] <= filterTime -1, 'Dates 5'[week index] >= filterTime -5 ) )

    Well that is about it.  Thanks for following along.

    I am so thankful you have taken the time to read my tutorial.  My hope is that by using these free tutorials you can become a rock-star at work.  In order to keep these tutorials free please consider purchasing the Power BI Desktop file for this tutorial.  Come on it’s only a dollar, I mean you spent than that on your coffee this morning.

    You can pay with your PayPal account or via credit card

    [products limit = “1” columns=”4″ id=”12754″ ]