
There are many cases when you will need to create a date table within Power BI desktop. This could be as simple as creating a master date table or more complex such as creating a monthly or weekly index number tied to a date. To create a date table there are two methods for creating a date table. Method one, create the table directly in the Power BI Desktop, or method two load the date table from the data source.
For this tutorial we will walk through a couple different examples that are specifically addressing creating a date calendar via DAX expressions.
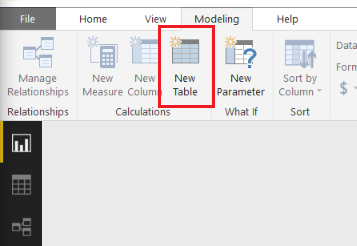
Let’s begin by making a basic table. Open Power BI Desktop, on the Modeling ribbon click New Table.
In the formula bar enter the following DAX expression:
Dates  =
  GENERATE (
    CALENDAR ( DATE ( 2017, 1, 1 ), DATE ( 2017, 12, 31 ) ),
    VAR currentDay = [Date]
    VAR day = DAY( currentDay )
    VAR month =  MONTH ( currentDay )
    VAR year =  YEAR ( currentDay )
  RETURN   ROW (
    "day", day,
    "month", month,
    "year", year )
  )
This generates a simple date table. Let’s walk through what is happening here.
- The CALENDAR DAX function generates a table with a list of dates from Jan 1 to Dec 31 of 2017.
- We define variables (denoted by VAR) to capture details from the column named [Date] that is created by the CALENDAR function.
- The Return function generates one row at a time. The row iterates through each [Date] item in the list which was created by the CALENDAR function. Variables are re-calculated for every row execution.
Note: When creating DAX tables as we are doing so in this example, the DAX table only refreshes when the report refreshes. Thus, if you want the date list to increase over time, or your using a NOW() in the DAX table you will need to be sure to schedule refreshes for the Power BI report in the PowerBI.com service.
By contrast we can also generate the same data table by calculating our data column by column. Again, on the Modeling ribbon click the New Table icon and add the following DAX:
Dates 2 = ADDCOLUMNS(
  CALENDAR( DATE( 2017, 1, 1) , DATE(2017, 12, 31) ),
  "day", DAY([Date]),
  "month", MONTH([Date]),
  "year", YEAR([Date])
  )
While this is great, we have a date table now, but what we lack is flexibility and automatic time intelligence. One option to change this table to auto detect dates within your data model is to replace the CALENDAR DAX statement with CALENDARAUTO().
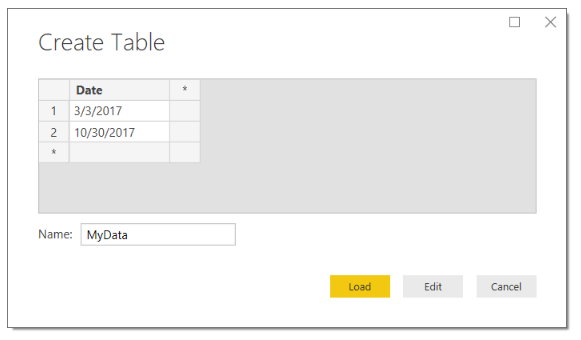
To use CALENDARAUTO we need to supply a table with a column of dates. We will quickly create a dummy data table with a couple of dates, so we can use CALENDARAUTIO.
Click Enter Data on the Home ribbon. Enter the following information into the Create Table screen. Click Load to add this data to the data model.
Now that we have loaded a table into the model with two dates, we can add our new date table. On the Modeling ribbon click the New Table icon and add the following DAX:
Dates 3 =
  GENERATE (
    CALENDARAUTO(),
    VAR currentDay = [Date]
    VAR day = DAY( currentDay )
    VAR month =  MONTH ( currentDay )
    VAR year =  YEAR ( currentDay )
  RETURN  ROW (
    "day", day,
    "month", month,
    "year", year )
  )
Note: In the MyData table we added two dates, 3/3/2017 and 10/30/2017. When we look at the included dates in the new Date 3 table we have every date listed from January 1 to December 31st. This is because the DAX function CALENDARAUTO will return the entire year of calendar dates even if it only finds one date within a given year period of time.
Let’s say we want to build a date calendar that will automatically grow and change over time. We want to identify today’s date and then create a list of dates for the previous year.
Moving back to generating a date table by rows we can now use the DAX NOW function. On the Modeling ribbon click the New Table icon and add the following DAX:
Dates 4  =
  GENERATE (
    CALENDAR( DATE( YEAR( NOW() ) - 1, MONTH( NOW() ), DAY( NOW()) ), NOW()),
    VAR currentDay = [Date]
    VAR day = DAY( currentDay )
    VAR month = MONTH ( currentDay )
    VAR year = YEAR ( currentDay )
  RETURN ROW (
    "day", day,
    "month", month,
    "year", year )
 )
Note: In this DAX table we used the NOW() function which returns a date and time. The same can be done when using the TODAY() function which only returns the date and not the time.
This now generates is a date table that starts one year ago and populates all the dates until today. For example, if today is 10-29-2017, then the date list would start at 10-29-2016 and end on 10-29-2017. Pretty cool…
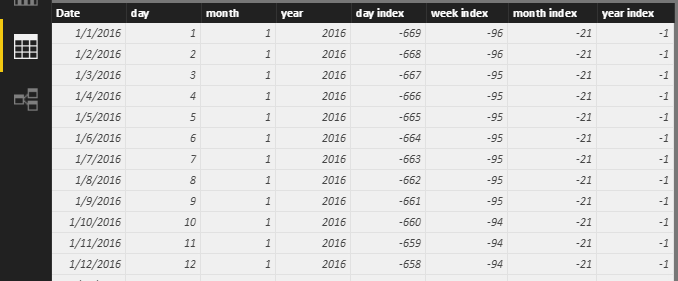
Let us move further down the rabbit hole. We can also start adding calculations that helps us move through date time calculations. For example, you may want to calculate this month’s total sales and possibly last month’s sales. By adding columns with an index, you can quickly shift time periods. Doing so makes time calculations much easier.
On the Modeling ribbon click the New Table icon and add the following DAX:
Dates 5 =
  GENERATE (
    CALENDAR( DATE( YEAR( TODAY() ) - 2, MONTH( TODAY() ), DAY( TODAY()) ), TODAY()),
    VAR startOfWeek = 1 // Where 1 is Sunday and 7 is Saturday, thus a 3 would be Tuesday
    VAR currentDay = [Date]
    VAR days = DAY( currentDay )
    VAR months = MONTH ( currentDay )
    VAR years = YEAR ( currentDay )
    VAR nowYear = YEAR( TODAY() )
    VAR nowMonth = MONTH( TODAY() )
    VAR dayIndex = DATEDIFF( currentDay, TODAY(), DAY) * -1
    VAR todayNum = WEEKDAY( TODAY() )
    VAR weekIndex = INT( ROUNDDOWN( ( dayIndex + -1 * IF( todayNum + startOfWeek <= 6, todayNum + startOfWeek, todayNum + startOfWeek - 7 )) / 7, 0 ) )
  RETURN ROW (
    "day", days,
    "month", months,
    "year", years,
    "day index", dayIndex,
    "week index", weekIndex,
    "month index", INT( (years - nowYear ) * 12 + months - nowMonth ),
    "year index", INT( years - nowYear )
  )
)
Note: The DAX equation above will work in your report without any changes. However, I made a variable called startOfWeek. This variable allows you to define the start day of the week. For example, if you data starts a new week on Sunday, then the startOfWeek number will be a 1. If your data start of week begins on Wednesday then the start of week number would be a 4. This allows you to auto detect the day of the week and then automatically arranges all your weekly index numbers in the correct format. Try playing around with this variable to see how DAX table changes.
So why work so hard on the date table? Well by having a robust date table you can simplify many of your measures that you need to build for your report. Consider the following example:
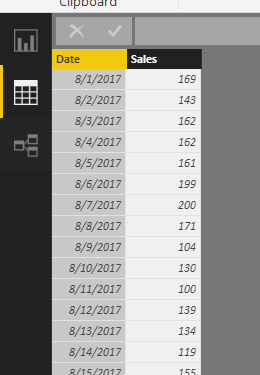
You have a Sales table with a date and sales column.
And you have our fancy Dates 5 Table we created earlier:
The Date 5 table is linked to the Sample Sales table:
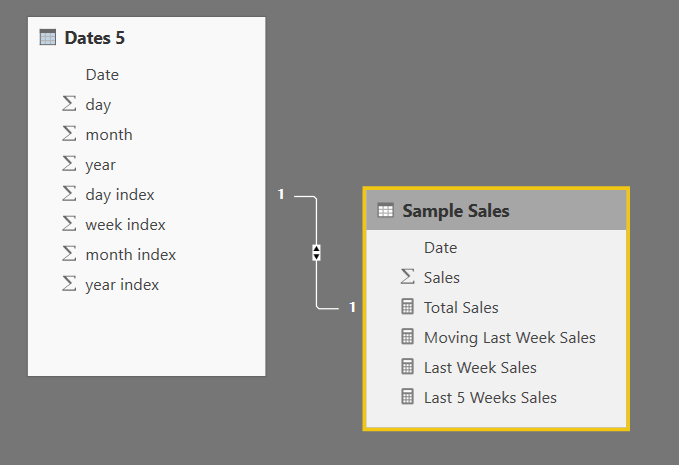
You can now build the following DAX measures inside the Sample Sales table:
Total Sales = SUM( 'Sample Sales'[Sales] )
and
Last Week Sales = CALCULATE( [Total Sales], ALL('Dates 5'), 'Dates 5'[week index] = -1 )
If you want to calculate something crazy like the last 5 weeks of sales you can calculate the following:
Last 5 Weeks Sales = CALCULATE( [Total Sales], ALL( 'Dates 5' ), AND( 'Dates 5'[week index] <= -1, 'Dates 5'[week index] >= -5 ) )
The nice thing about these measures is that every time the data set refreshes the dates will automatically recalculate the last week and last five weeks.
If you want to be able to handle the additional filter context of the visual, you can pick up the visual filter context using variables (VAR). Then you can RETURN a calculate function that will shift all your time ranges for you.
Moving Last Week Sales =
VAR filterTime = SELECTEDVALUE('Dates 5'[week index], BLANK())
RETURN CALCULATE( [Total Sales],  ALL( 'Dates 5'[Date] ), 'Dates 5'[week index] = filterTime - 1 )
Same goes for a moving sum of the last five weeks of sales.
Moving Last 5 Weeks Sales =
VAR filterTime = SELECTEDVALUE('Dates 5'[week index], BLANK())
RETURN CALCULATE([Total Sales], ALL('Dates 5'[Date]), AND( 'Dates 5'[week index] <= filterTime -1, 'Dates 5'[week index] >= filterTime -5 ) )
Well that is about it. Thanks for following along.
I am so thankful you have taken the time to read my tutorial. My hope is that by using these free tutorials you can become a rock-star at work. In order to keep these tutorials free please consider purchasing the Power BI Desktop file for this tutorial. Come on it’s only a dollar, I mean you spent than that on your coffee this morning.
You can pay with your PayPal account or via credit card
[products limit = “1” columns=”4″ id=”12754″ ]