This post will answer how to sort a measure that returns text values to a custom order, without affecting other columns. It will utilize the DAX functions of REPT() and UNICHAR(8203) – a Zero width space.
The requirements
I’ve been working at a florist! In this example, I have been in charge of looking after four plants, named A, B, C and D. The florist owner is a big Power BI fan, and asked me to measure how much water I have been giving them a day to put in a report. They need at least 20ml to survive, but over 50ml will stop them growing as well.
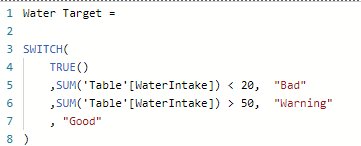
Create a table with the flowing: The flowers get under 20 ml, label as Bad. When the flowers get 20 – 50 ml, label as Good. Finally, if the flowers receive over 50 ml, label as Warning. I’ve been asked to show them in order of Bad, Warning then Good. This is vital so the plants needing attention are at the top of the table.
Creating the table
Here is the measure I create:
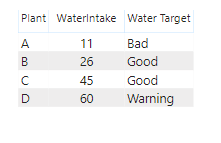
Adding this to a table:
Now comes the question, how can I order this to put Bad and Warning together? If I order by Water Target measure, this will be alphabetical. Sorting by WaterIntake can not give me the correct order either. One option would be to make a conditional column and use the “Sort by Column”. However, this may be a complicated calculation, especially on more complex measures. In addition it will sort every visual by this column, when I only want to sort in this one table.
Creating the custom sort
My solution? Make use of the UNICHAR() function. For those unaware of this function, UNICHAR() can return characters based on their UNICODE number. This can include more text characters not included on the standard keyboard.
A character that can help is UNICHAR(8203). This is a “Zero width space”. This is a space that has not width, so it is essentially invisible and will not be visible in the measure. The Zero width space is still recognized as a character by DAX. Spaces come before any letter in the alphabet. Two spaces comes before one, and so on.
The second function I will utilize is REPT(). REPT() or replicate, simply repeats text multiple times. It takes two arguments, the text and the times to repeat.
For example: REPT( "Hi", 3 ) will return the text "HiHiHi"
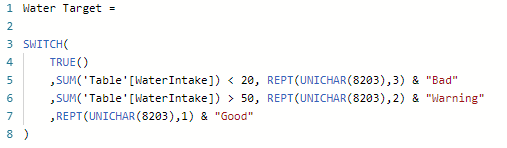
To change the sort order, I will repeat the Zero width space in front of the text. The text I want to appear first will have the space repeated the most amount of times. This will put it first in an alphabetical list. I will use the & symbol to concatenate the Zero width spaces and the text.
Now, “Bad” has the Zero width space repeated three times in front of it. This now puts it first in an alphabetical list. Warning has the Zero width space repeated twice, putting it second. “Good” has it once putting it third.
Applying the sort
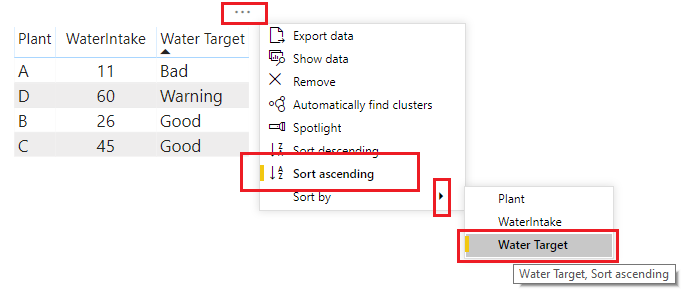
Now I can arrange my table by Water Target (alphabetical), in an ascending order:
And success! I’ve added a custom sort to my text measure, without making any other measures or columns.
If you like the content from PowerBI.Tips please follow us on all the social outlets to stay up to date on all the latest features and free tutorials. Subscribe to our YouTube Channel. Or follow us on the social channels, Twitter and LinkedIn where we will post all the announcements for new tutorials and content.
Introducing our PowerBI.tips SWAG store. Check out all the fun PowerBI.tips clothing and products:
The release of grouping visuals was an extremely welcomed
feature. As one who builds lots of reports grouping elements together is
essential to stay organized and to increase report building speed. Since I’ve
been using this great new, I found an interesting design element to style
groupings for reporting impact. The grouped visuals feature enables a new
property, background color. This can be
applied for the entire group of visuals.
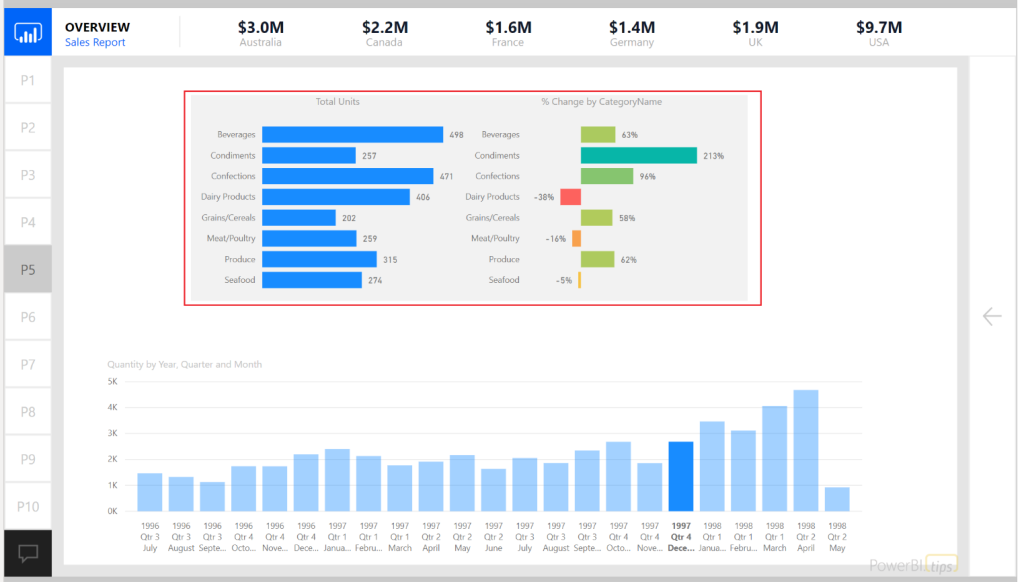
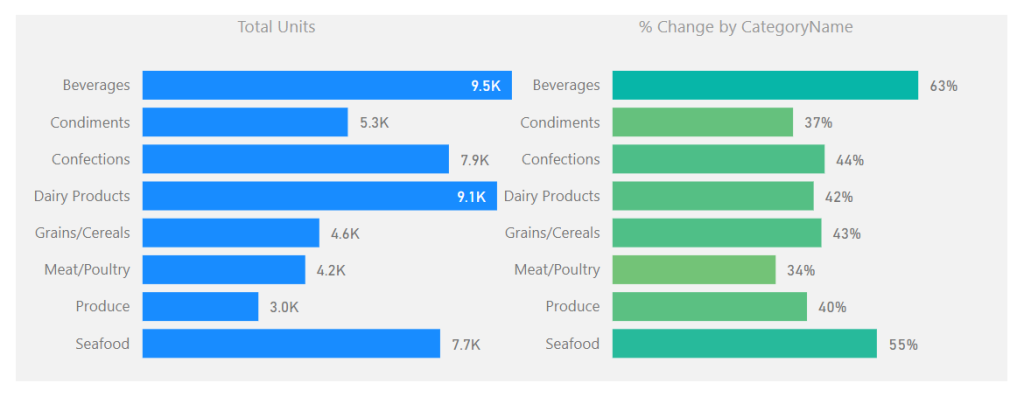
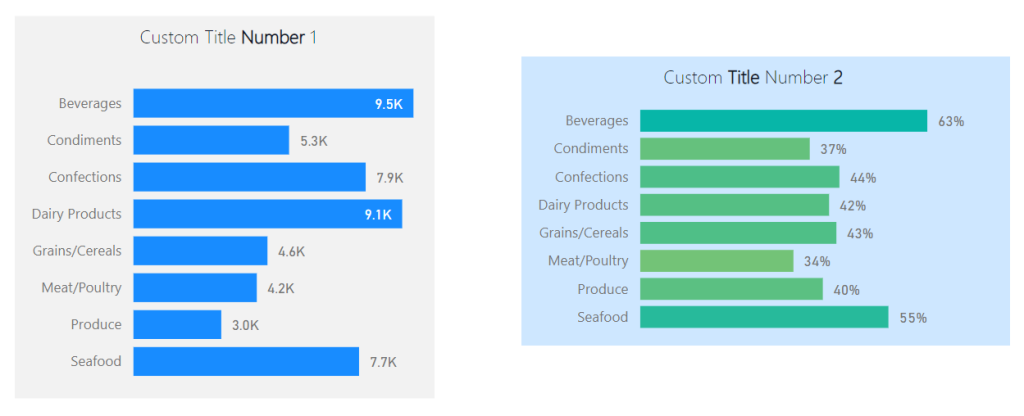
See the following example of setting a background around two
visuals.
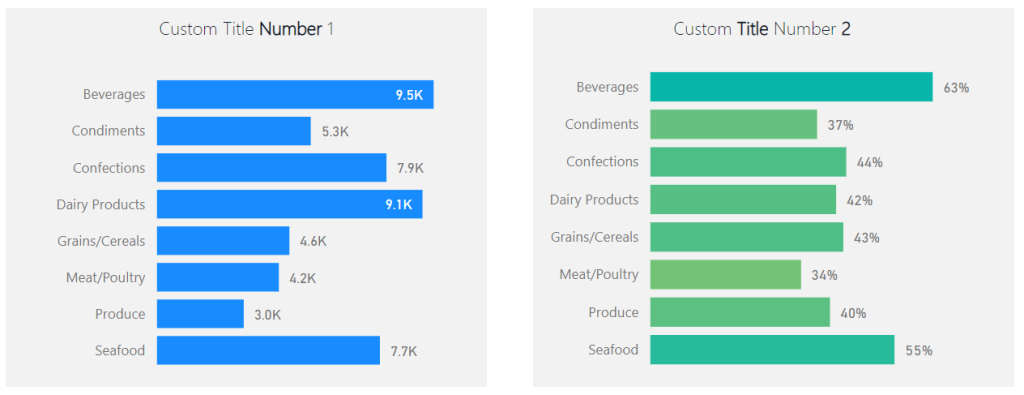
In this example the intent is to show the user that these
two visuals are related. The graph on the left shows the number of units sold
for a selected time period. The bar chart on the right shows the relative sales
over time represented as a percent change. This illustrates the principle of
position and direction. The number of units sold is what happened right now. It
is my place in time with respect to sales. However, this does not show any
context to performance. The percent change provides the directional context. Since the position and direction are an
important insight as a paired visual, we use the grouping to visually bind the
two.
For those who have done some research around design
principals inevitably you will stumble across the Gestalt
Principals of design. Grouping
visuals with a common background falls into the Law of Common Region or Law of
Proximity.
Alright let’s walk through how to use grouping with
backgrounds colors.
Once you have created the visuals which will be grouped together;
select each visual by holding CTRL and Selecting each
visual.
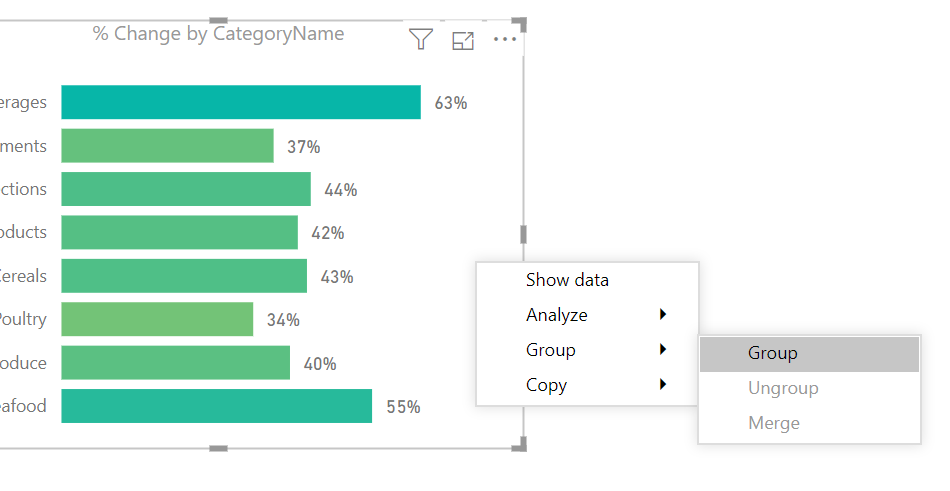
Right Click on one of the visuals and select the menu
item labeled Group, in the flyout menu select the option called Group.
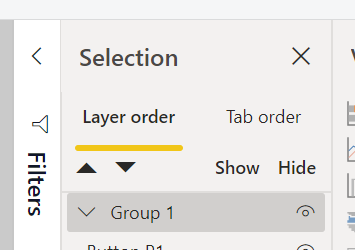
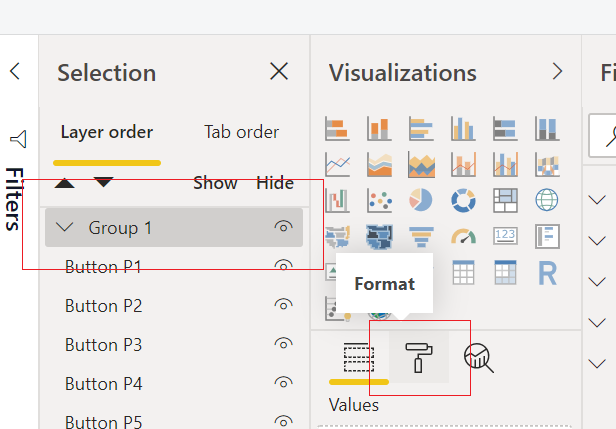
A grouped element will be created in the Selection Pane.
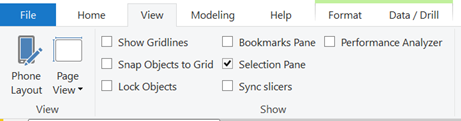
Note: If you don’t see the Selection Pane, you will need
to turn this on. The setting to turn the
Selection Pane is found in the View ribbon with the check box for Selection
Pane. See below for reference.
With the newly created group being selected, Click on
the Paint Roller (Format) icon in the Visualizations Pane.
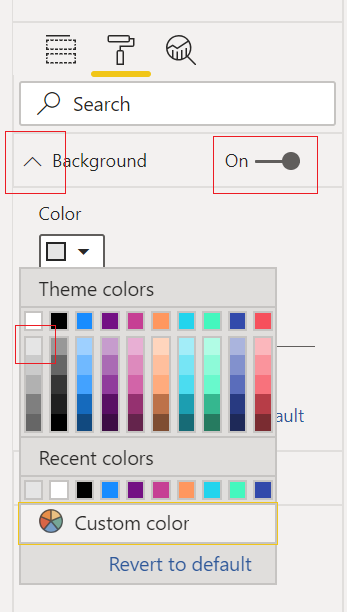
Expand the property section called Background.
Toggle the background to be On and select a Color from the
drop-down menu. For this example, I
selected the very first shade of grey in the first column of colors.
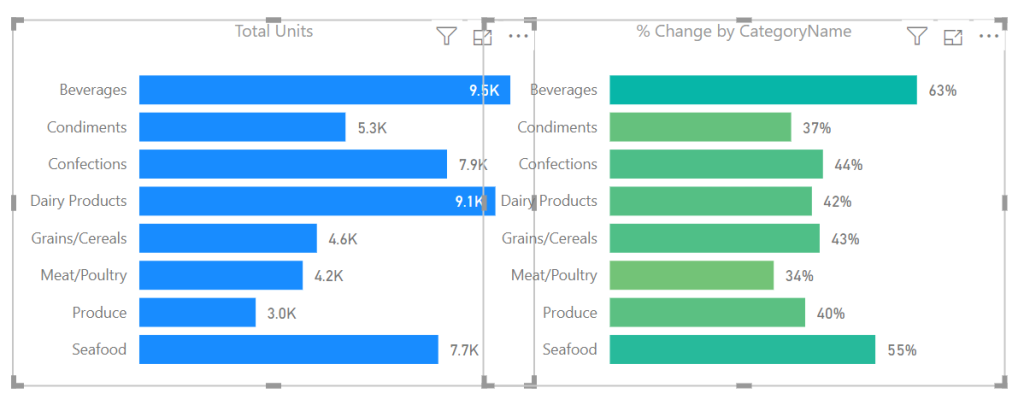
The final product will be a grouped arrangement of visuals
with a shaded background.
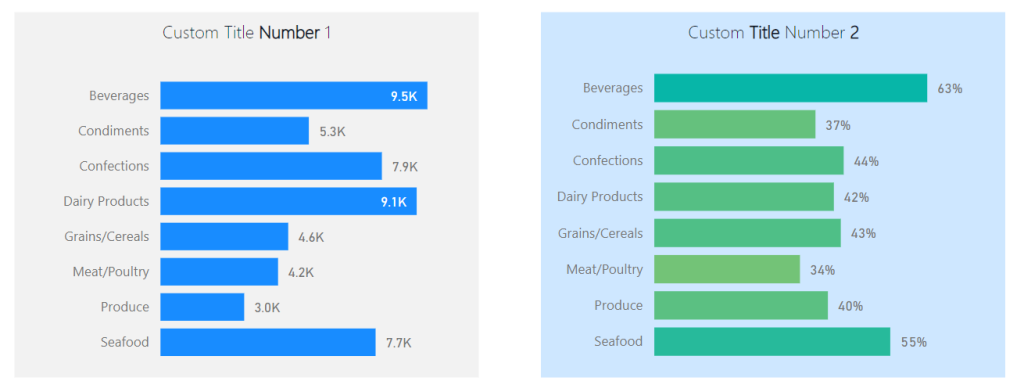
To extend this idea further we can take the same approach
when working with Text boxes and Visuals.
Often, I find I need more style for applying a Text box or header to a
visual. In these cases, I will use two
visual elements to create one visual.
See this example of two visuals with custom titles created with a
textbox.
Note: Backgrounds are colored differently to illustrate
that each background for the grouped visuals is different.
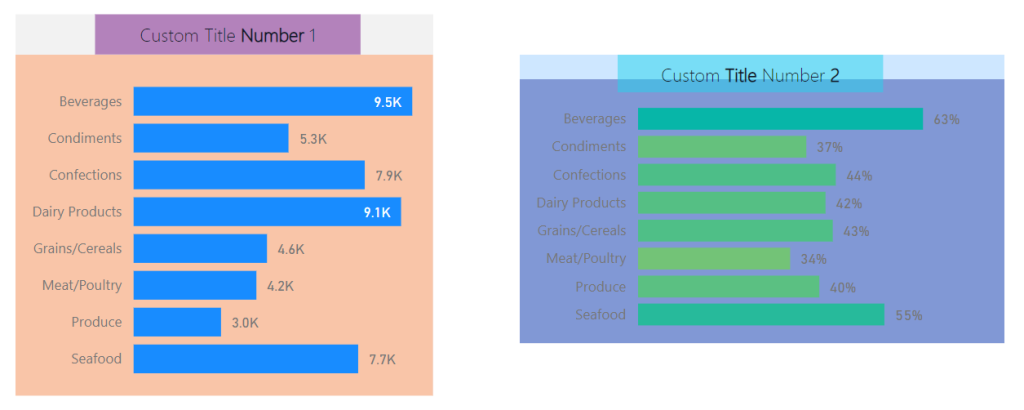
While this meets the need the boxes are not identical in
size. This violates yet another Gestalt
Principle, symmetry. The bounding
regions of the elements inside the grouping define the outer perimeter of the
background shading. Knowing this we can
modify the visuals within the groups to provide a symmetrical background shape.
Here are the same before and after images with each visual
object colored to see the adjustments in size for each visual type. This creates the proper background
sizes.
Before:
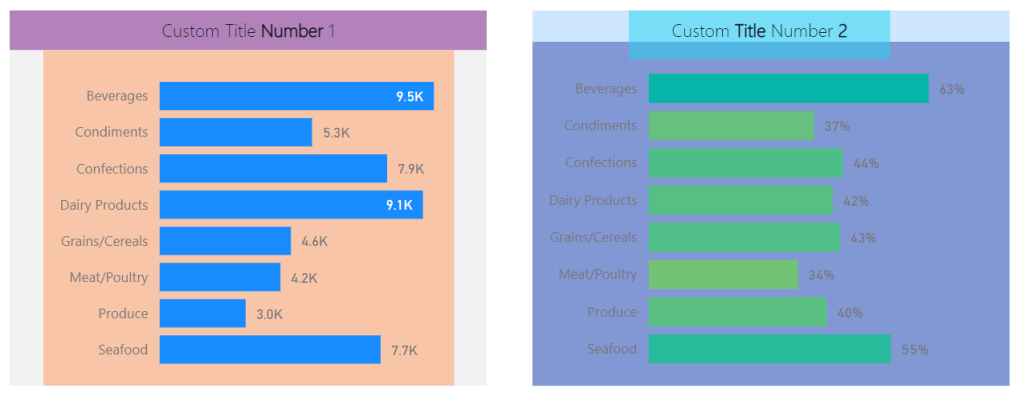
After:
The visual on the left required an increase of the text box
at the top to get the desired width of the background shape. By contrast the visual on the right required
an extension of the bar chart in length to acquire the desired length of the
background. The result provides a
symmetric view of both visual groups.
If you like the content from PowerBI.Tips please follow us on all the social outlets. Stay up to date on all the latest features and free tutorials. Subscribe to our YouTube Channel. Or follow us on the social channels, Twitter and LinkedIn where we will post all the announcements for new tutorials and content.
Introducing our PowerBI.tips SWAG store. Check out all the fun PowerBI.tips clothing and products:
I recently encountered a
really frustrating experience related to a set of reports seeming to not update
after some data source changes. I’d done this change before, and had another
co-worker take on the task of updating some of the other reports in the same fashion.
After a bit he reached out and explained that a few of the reports wouldn’t
update while the others had… This was odd since we were making the same type of
change. Queue hours of testing, changing, fixing one report without any idea
how I did it, and then hitting a brick wall with the remaining two.
The Setup: The data sources for the
original reports were Excel spreadsheets stored in a SharePoint Online folder. The
PBIX file connected to Excel files in SharePoint online using a Web connection.
Once the reports were created, we stored the PBIX files in a separate
SharePoint Online folder. Next, we opened the Power BI Service and connected to
the reports directly from Power BI to a SharePoint team site, if you aren’t
familiar with that process you can read about it in depth in an article that
Mike Carlo wrote -> here. (The TLDR
-> Get data -> Files -> SharePoint Folder -> navigate to folder ->
Click on PBIX -> Connect)
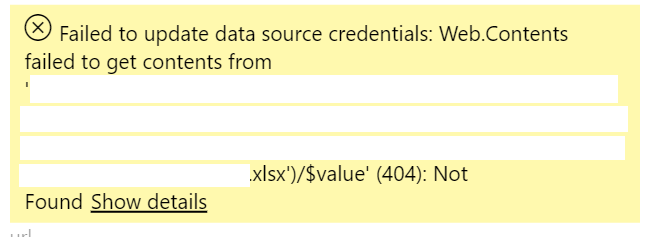
By connecting to the PBIX files from the PBI Service the dataset, report and dashboard for the report are loaded and sync’d. Where this comes in very handy indeed, is linking the SharePoint folder to your windows explorer and accessing the file, making changes, and saving the PBIX in that “local” location no longer requires you to re-publish the report from the PBIX and the changes make their way to the Service without any further work. I had made several changes to the reports from an asthetics perspective, and maybe added a new measure here and there, but hadn’t done anything drastic until just recently when we updated the sources. Due to some changes on the backend processes that were generating the Excel files, it became apparent that it would be easier for the Dev team if we used CSV files instead of xlsx. The team went through and changed the reports and 3 of the 5 reports we were working on broke in the Service giving this error.
“Failed to update data source credentials: Web.Contents failed to get contents from” after updating data source
At first, I thought it was the use of parameters in the report, but after determining that wasn’t the issue, it actually helped me figure out that the report in the Service wasn’t updating because the parameters were still showing the “xlsx” file type from the files that I had already removed from the SharePoint location. After repeated attempts to change the datasources manually in the original file, delete and replace, and every other combination of things to try a refresh, I was stumped. What was more confusing, is that connecting to the file again from the PBI Service created another dataset & report of the exact same name!
In my mind, that wasn’t
supposed to happen, and I was getting more frustrated because things were not
behaving as I would expect. My initial assumption here was that the PBI Service
would look at the new PBIX of the same name and recognize the changes and
replace the existing dataset and report, the same way that it does if I
manually push a PBIX via the “Publish” action. But using this direct connect
method, refreshing the dataset did nothing…(cue the “grrrr”).
The solution:
Thanks to the fantastic Power BI team, they were able to determine my issue and share with me the root cause of some of the datasets not updating. The issue is that when you connect to the PBIX files in this manner, the PBI Service looks at the root id of the PBIX file in the OneDrive location and that file id cannot be deleted and replaced with another one. If you do that, you get the above error on the dataset source because it cannot find the file id. If you remove the file out of SharePoint then when you insert it back into the folder the ID will be different. This is what breaks the dataset in Power BI, and also the reason it allows what appears to be the same named dataset and report. However there is good news, because you are in SharePoint you will be able to go back in version history of the folder and pull the previous versions of the reports and resolve the issue in the datasets. I did end up having to replace one of the reports, but lucky for us it was only a single user for the customer report and re-sending a shared link was a really low impact compared to what it could have been.
Here are the following
guidelines I can offer up after going through this.
Do:
Sync the SharePoint folder to your local storage
Open the report directly from the synced folder and update it in location
Leave the originals file in the folder and replace it with the new one
Do try to resurrect your previous version of the report PBIX in the folder (if you are hitting this issue now)
Don’t:
Move the file to your local machine, then back to the SharePoint folder
Remove the file from the folder (You can do this if you move it to a SharePoint folder, update and move it back, but if the dataset refreshes during that time in the Service it will break and you will need to fix the credentials when you have put the file back.
I hope you found this post
worthwhile, error messages are hard to track down to the root causes and due to
the nature of this being a tricky one for me to solve I thought I would share
the experience and hopefully help others avoid it or solve the errors that
match above.
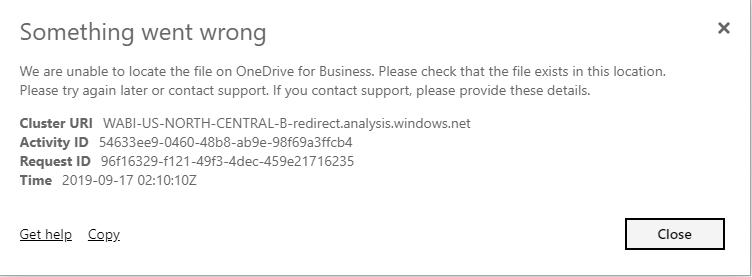
When testing out this issue again, I did
uncover this error message which is much more specific. It came up after I made
the breaking change, but prior to an automated refresh.
“We are unable to locate the file on OneDrive for Business. Please check that the file exists in this location.”
If you like the content from PowerBI.Tips, please follow us on all the social outlets to stay up to date on all the latest features and free tutorials. Subscribe to our YouTube Channel, and follow us on Twitter where we will post all the announcements for new tutorials and content. Alternatively, you can catch us on LinkedIn (Seth) LinkedIn (Mike) where we will post all the announcements for new tutorials and content.
As always, you’ll find the coolest PowerBI.tips SWAG in our store. Check out all the fun PowerBI.tips clothing and products:
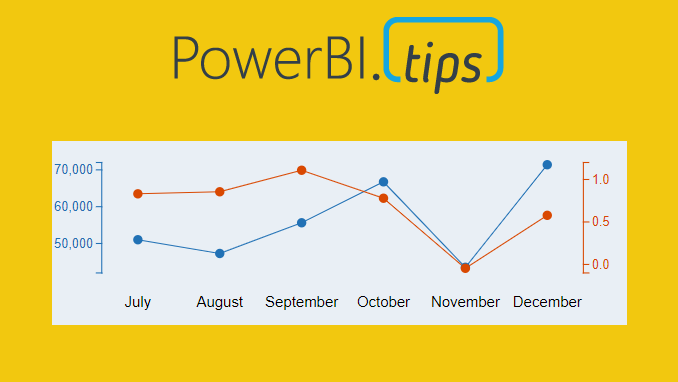
Ever need two different scales on the Y-Axis of a line chart? If so, then this tutorial is for you. While creating a dual y-axis line chart is pretty common in excel, it is not as easy in power BI. The only standard chart that comes with Power BI Desktop that enables dual y-axis is the Column and line combo chart types.
For this particular visual I needed to show correlation between two time series with different Y-axis scales. The Y-axis on the left of the chart had data elements in the thousands, but the right side needed percentages. The tutorial below illustrates how to accomplish by building a custom visual using the Charts.PowerBI.Tips tool.
Video Tutorial
note: there are a bunch of really good custom visuals that can be downloaded from the Microsoft App Source store. However, this article will not review all third party visuals that are able to produce a dual Y-axis line chart.
Source files
All files used to create this visual are located here on GitHub.
Layout file
The file used in this tutorial was a derivation of the Sunset layout from PowerBI.Tips. If you like this file, you can download it here:
If you like the content from PowerBI.Tips please follow us on all the social outlets. Stay up to date on all the latest features and free tutorials. Subscribe to our YouTube Channel. Or follow us on the social channels, Twitter and LinkedIn where we will post all the announcements for new tutorials and content.
Introducing our PowerBI.tips SWAG store. Check out all the fun PowerBI.tips clothing and products:
There are different ways you can connect to a multitude of different data sources. I’ve written about the different connection types before and you can find those articles here if you are unfamiliar with what I’m talking about.
When you import data and publish a Power BI report to the Power BI Service you need to schedule a dataset refresh in order for the report data to be updated. This can be done manually by refreshing the PBIX and re-publishing the file, but for any production report that you want to set a schedule for, you need to ensure that you set up things to automatically update without further intervention.
The first thing you need to check is whether or not you need
a gateway. For any data source that is located within your company servers, on
a local machine, or within certain types of cloud infrastructures are
considered “on-premises”. When a data source is on-premises you require a
gateway in order to refresh the data. If your data is in a cloud source such as
OneDrive or SharePoint Online, then you will not need a gateway to refresh.
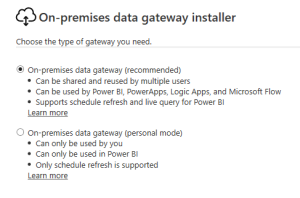
Once you determine whether or not you require a gateway, you need to understand that there are two different types. The first is called a personal gateway, this gateway will allow you to use the majority of Power BI data sources with no configuration. After you install this gateway and publish your report using a data source that is supported by that gateway you can set up a dataset refresh in the Power BI Service without any additional setup. The second type of gateway used to be called the “Enterprise Gateway”, but now it is just the gateway that is not (personal mode).
This gateway is designed for use in your enterprise wide
reports. It has a lot more data sources that it supports for refresh (That list
can be found here)
It also requires some additional setup, configuration and management from an
Administrator. Let’s walk through how you set one of these up so that you
understand how to do it, or how you can request to have it done for your
organization. It is highly recommended that you install the “Enterprise
Gateway” on a server that will never shut down or be on a scheduled maintenance
cycle. You can download this gateway to your local computer, but if the
computer is off, so is your gateway, and the reports will not refresh.
Installing the gateway:
Installation is very similar to the personal gateway, except you have options to add the gateway to a cluster or incorporate a recovery key. ALWAYS set a recovery key and SAVE IT! This key will allow you to move the gateway at a later date if you need to without impacting any of your reports. This key is GOLD, treat it like it and you will save yourself a bunch of headaches in the future. Outside of that, the install of the gateway should be really straightforward, if you do run into issues there is a comprehensive guide to troubleshooting the problems that you can find here. I recommend using an administrative account to set up the gateway because the ownership of the gateway in the Service will begin with this user. If you have one account that manages all the Enterprise Gateways, then you’ll save yourself a ton of pain down the road from an administration standpoint in discover-ability. If you aren’t the admin, be sure to either have an admin set up an account for you or let them know that you have an Enterprise gateway set up using your account and have them securely store the gateway recovery key. Alternatively, if an admin account is not used, be sure to add an IT admin as a gateway administrator in the next step as you configure the gateway.
Configuring the gateway:
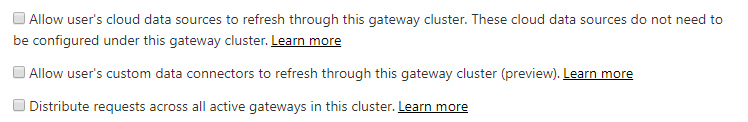
After the installation of a gateway you need to log in to the Power BI Service (app.powerbi.com) with the user that you configured the gateway with. Go to Settings > Manage gateways and you will see several different configuration options that will affect how end users can see and interact with data sources on this gateway. The main call-out I have in these options is the first one. More often then not, you will want to make sure that you allow users to “mix” cloud and on premises data sources.
gateway options
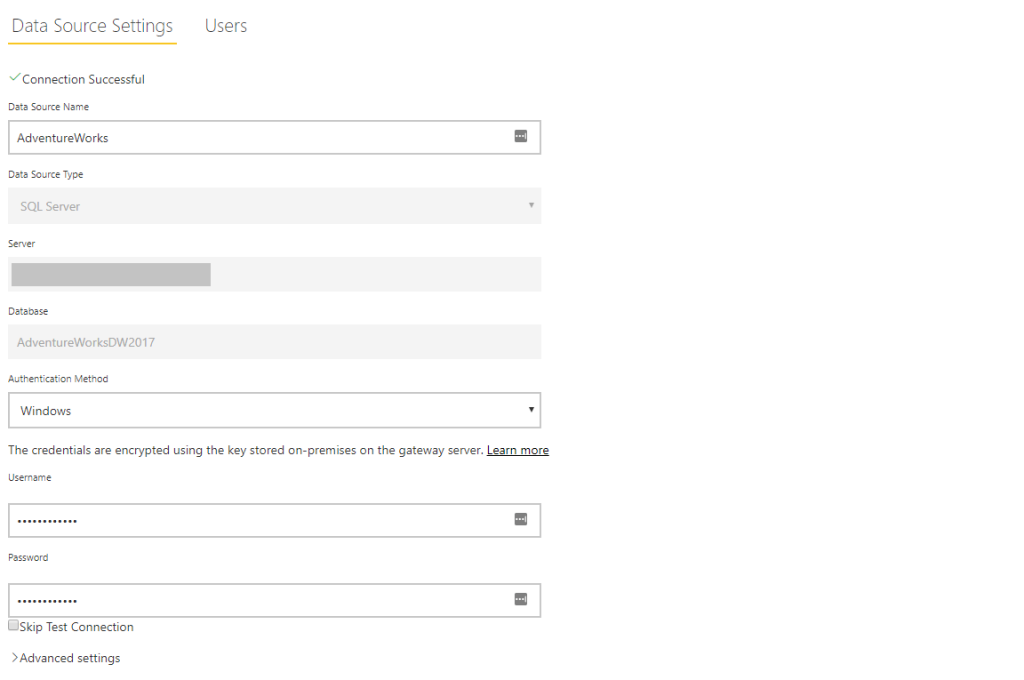
If Gateway Administrators want other people to be able to access and create new data sources on the gateway for others to use it requires that every on-premises data source be setup and configured (Unlike the personal gateway). This means that the data source can use a single user/permission set for a data source and the report and end users will inherit the read permissions of that user. (A caveat to that would be the application of row level security, or a live connection, but that is beyond this overview).
data source
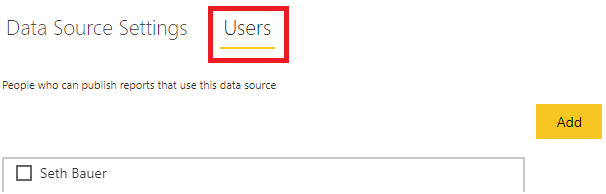
After the data source has been configured, the administrator needs to add any users to the data source so that they can deploy reports using the gateway. This is an ideal use case for using Active Directory security groups, this allows administrators to apply a single group and add and remove users from that group verses managing all the data sources in Power BI. If a user is not added to the data source on the gateway, the report publisher will not be able to setup a refresh using that gateway.
data source users
Scheduling a Report dataset to refresh:
Now that you have completed the set-up of the gateway and added your users (including yourselves) to the gateway, you can publish a Power BI Desktop report and schedule a refresh.
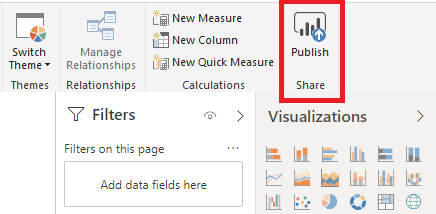
First, publish the report from the Power BI Desktop to the workspace that you want the report to live in.
publish
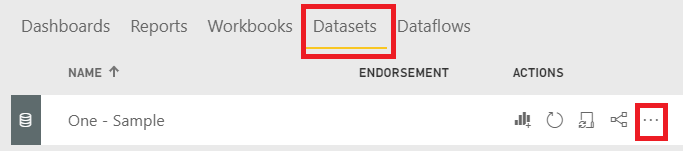
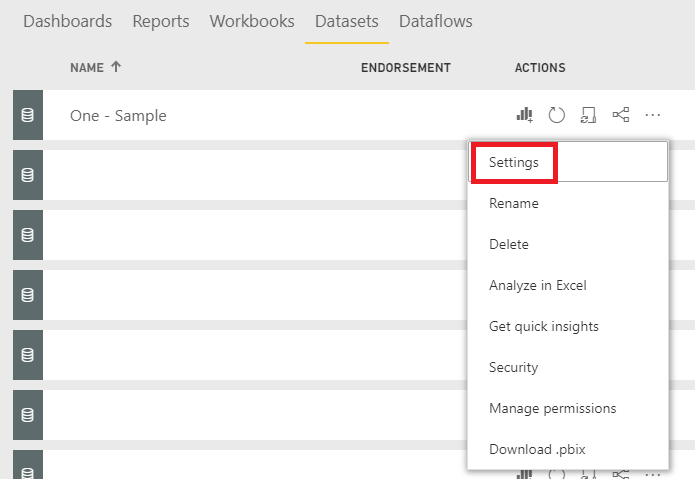
Next navigate to the workspace and select datasets, follow the dataset ribbon to the right and click on the ellipses:
dataset locationdataset settings
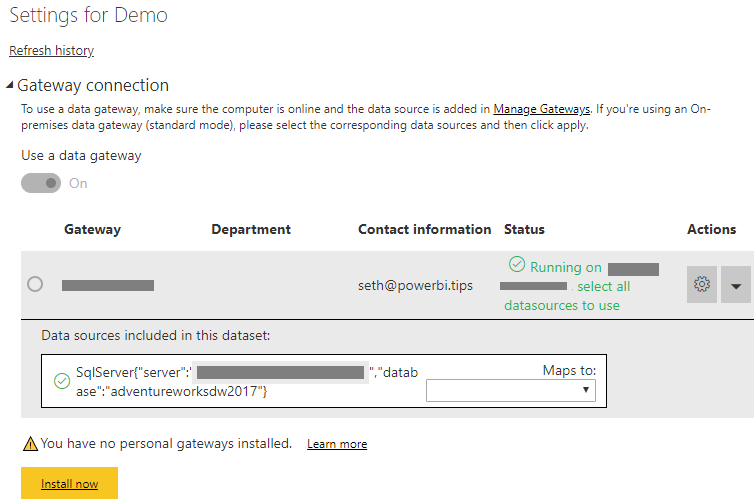
Navigate to Datasets and expand the Gateway connection section. Enable the use of the gateway if it is not enabled already. All your source will be listed here, and if you have any data source connections strings that do not match exactly in your PBIX file it will become apparent very quickly that you have a broken dataset. All data sources in the gateway need to match exactly to what is in your PBIX file.
enable gateway
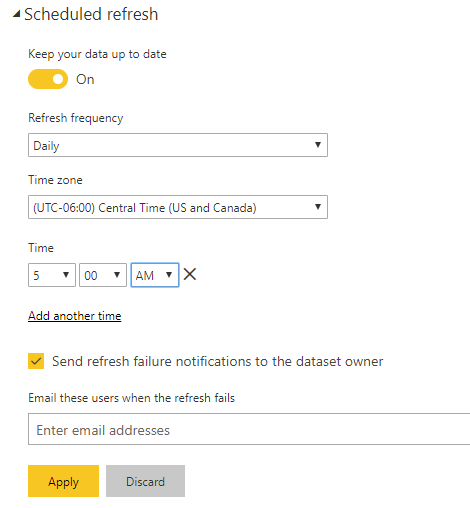
Once the gateway is enabled and all your data sources are working, you can schedule a refresh.
schedule refresh
One thing in particular to note here, when you
deploy your report from your local time to the Power BI Service all times are
stored in UTC times. So, if you are doing time specific calculations you may
need to take some time zone things into consideration. Reza Rad has a good
article outlining some methods to sort this problem out, you can find that here.
A
recent update to the dataset refresh now also allows us to add in email enabled
groups or other specific users to the refresh failure section. This is
extremely helpful in ensuring a wider audience of users can be notified any
refresh fails.
I hope you found this overview helpful, stay tuned for more blogs that walk through specific data source connection and refresh setups that will help ease the process of connecting to, and refreshing all your various data sources in Power BI.
If you like the content from PowerBI.Tips, please follow us on all the social outlets to stay up to date on all the latest features and free tutorials. Subscribe to our YouTube Channel, and follow us on Twitter where we will post all the announcements for new tutorials and content. Alternatively, you can catch us on LinkedIn (Seth) LinkedIn (Mike) where we will post all the announcements for new tutorials and content.
As always, you’ll find the coolest PowerBI.tips SWAG in our store. Check out all the fun PowerBI.tips clothing and products:
Manage Consent
To provide the best experiences, we use technologies like cookies to store and/or access device information. Consenting to these technologies will allow us to process data such as browsing behavior or unique IDs on this site. Not consenting or withdrawing consent, may adversely affect certain features and functions.
Functional
Always active
The technical storage or access is strictly necessary for the legitimate purpose of enabling the use of a specific service explicitly requested by the subscriber or user, or for the sole purpose of carrying out the transmission of a communication over an electronic communications network.
Preferences
The technical storage or access is necessary for the legitimate purpose of storing preferences that are not requested by the subscriber or user.
Statistics
The technical storage or access that is used exclusively for statistical purposes.The technical storage or access that is used exclusively for anonymous statistical purposes. Without a subpoena, voluntary compliance on the part of your Internet Service Provider, or additional records from a third party, information stored or retrieved for this purpose alone cannot usually be used to identify you.
Marketing
The technical storage or access is required to create user profiles to send advertising, or to track the user on a website or across several websites for similar marketing purposes.