Search results for: “Power bi connection”

  • Power BI Connections: Live Connection

    Power BI Connections: Live Connection

    Of all the connection types, I’ve always gravitated towards this one. I imagine it is because I come from the database developer side of things. I’m a big fan of doing things one time, and having one version that controls many reports is extremely appealing. In fact, this topic was my first blog on Power BI so long ago (here for those feeling nostalgic). The live connection is the most powerful of all the connections that Power BI has to offer in my opinion.

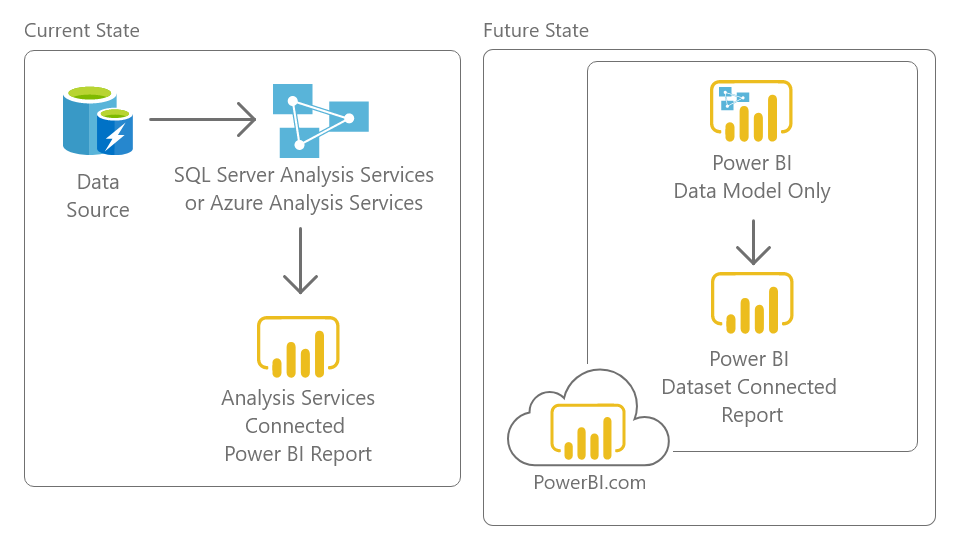
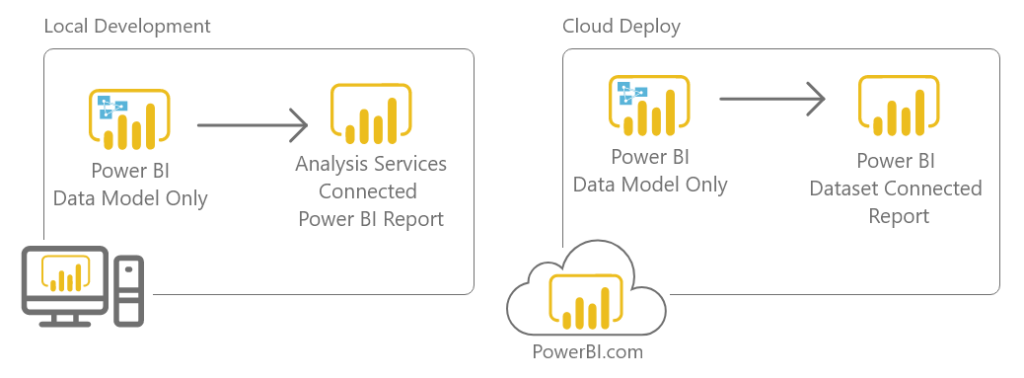
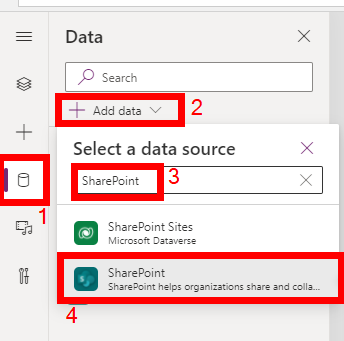
    Before we dive into the deep stuff, are you aware that you can use this connection type without your own instance of Analysis Services? Let me explain.  Anyone who uses the “Power BI Service” connector that was first made available in April 2017 and released to GA in August 2017 is using a live connection to an Analysis Services Instance hosted in in your Power BI tenant. In fact, each time you build a Power BI report in the Desktop, you are building a Tabular model that is then created in the cloud upon publish! This live connection method allows you to gain a bit more control.  You can deploy a single dataset to the Service and re-use it to build multiple reports!  Having your own instance of Analysis Services on premises or Azure lets you maximize your development and deployment efforts and truly create a sustainable reporting solution.

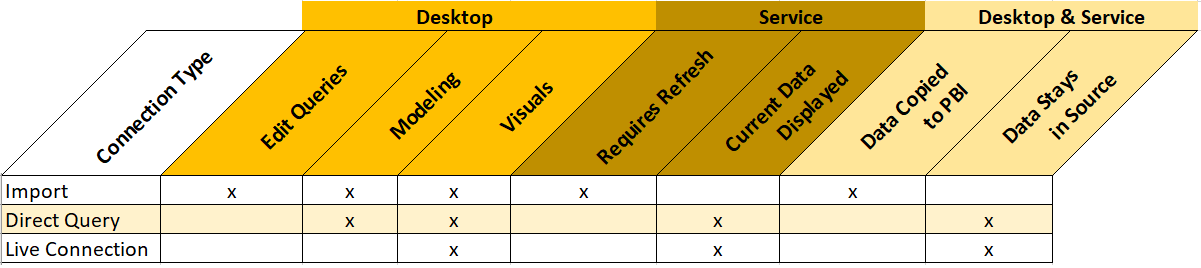
    The evolution of a Power BI solution “should” typically land in a space where a centralized or several centralized models are being used as the backbone for the vast majority of Power BI reports. This centralized approach is imperative in order for large scale BI initiatives to be successful. SQL Server Analysis Services Tabular is the typical implementation that I see most often employed due to the relational nature, compression, in memory storage and speed. That being said, lets dive into the details of what a centralized model gives us, and the pros & cons of the Power BI Live Connection.

    Cons:

    • Most limiting of all in terms of disabling Power BI features.

    Desktop Live Connection
    Desktop Live Connection

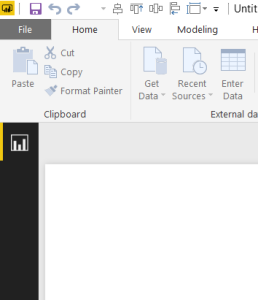
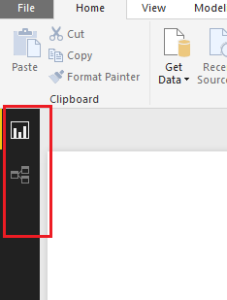
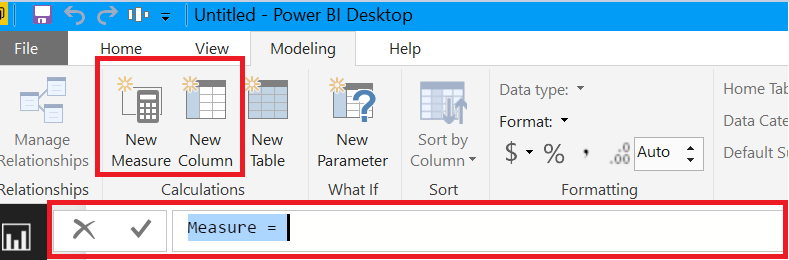
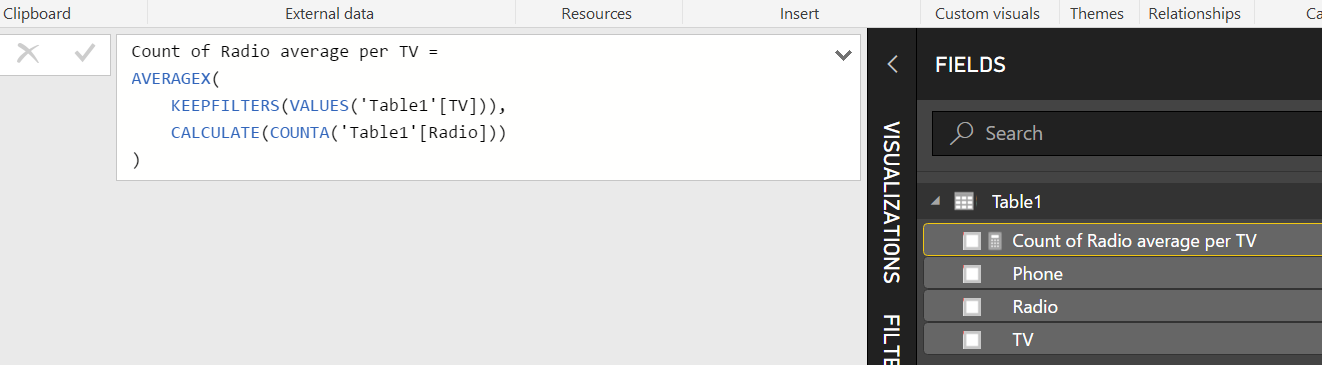
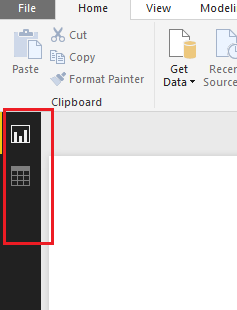
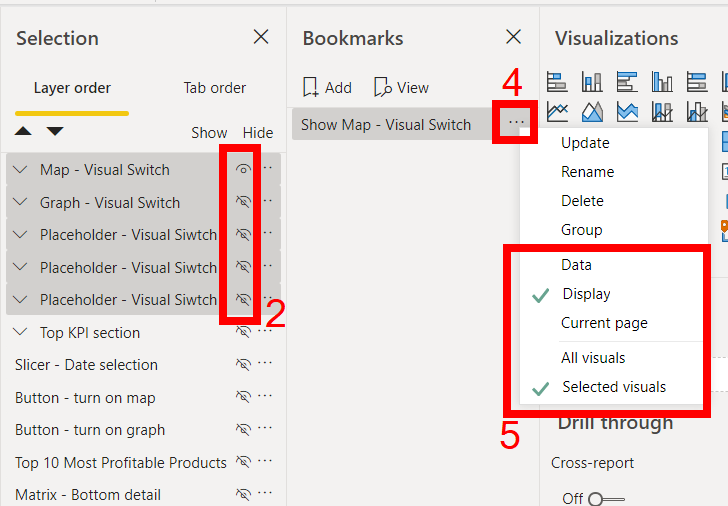
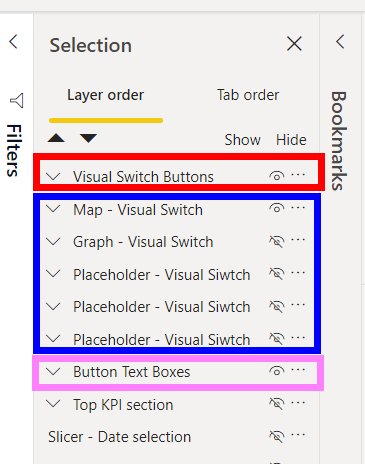
    Notice: the Data and Relationships icons are not visible after making a Live Connection.

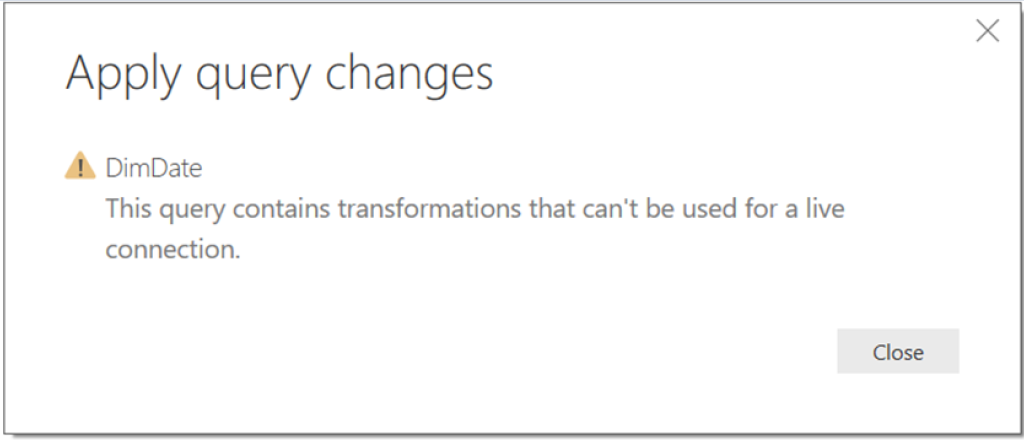
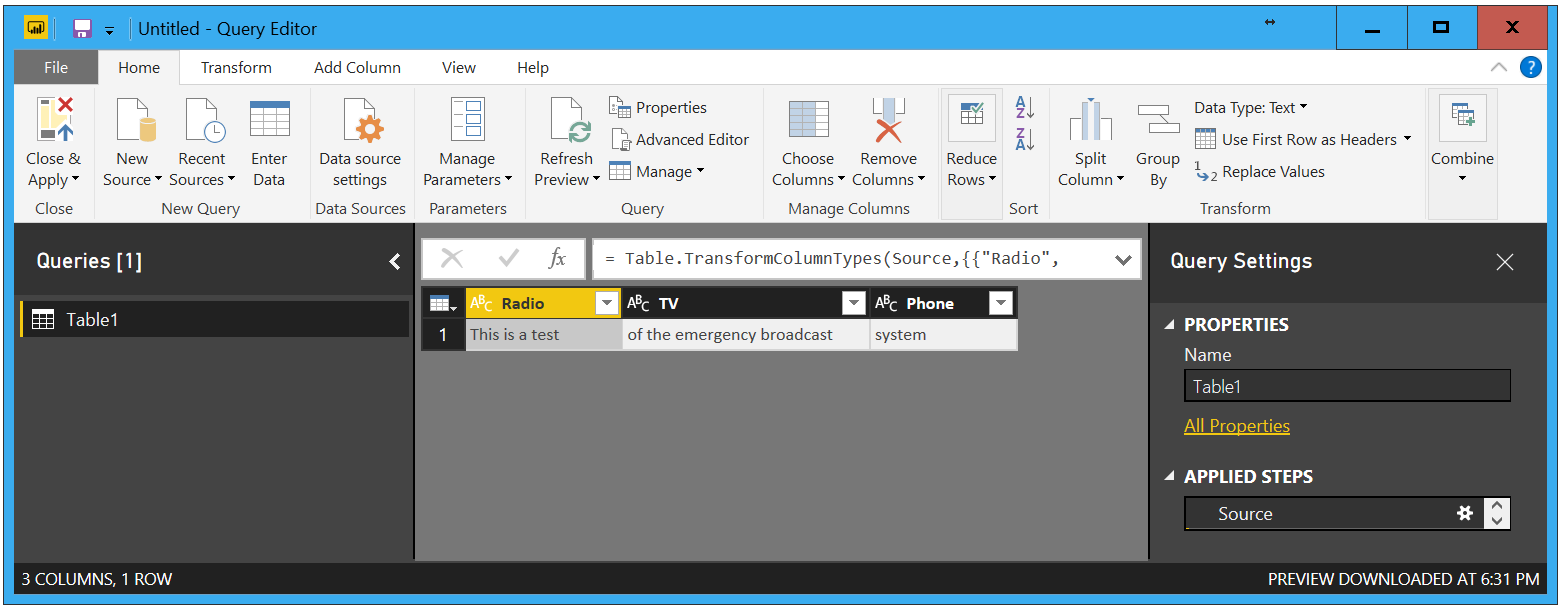
    This is without a doubt the most intimidating to the end user that isn’t familiar with the live connection. As with Direct Query, there are features and capabilities in the Power BI Desktop that are just flat out turned off or completely gone. ETL / M / Query Editor? Gone. Data pane, DAX tables, Calculated columns? Gone. Power BI has become only the front end of the process. The expectation is that you are doing all the data mashup / ETL and modeling behind the scenes and as such, these features are all removed.

    However, a really great addition in the May 2017 Desktop release was the addition of allowing measures to be created on top of the live connection. This means that if you have a couple measures you need to add to a single report, you can easily add those in the Power BI Desktop without the need to have them added to the model.

    • Cost

    Without a doubt one of the most appealing aspects of Power BI is the price. It is amazing the amount of power and value you get for $10/month. (Desktop is free, but let’s just call it $10 because you need a Pro license to share). When you scale up and start to use enterprise level tools you need to look at the costs that those include. This post won’t go into details because there is a myriad of options out there and the number of options increase exponentially when you start comparing Azure to on-premises. Suffice to say, you’re looking at a much heftier investment regardless.

    • Different Tools

    Another drawback to this connection is that we are now pulled out of the Desktop as a standalone solution and thrown into development areas. At bare minimum we’ll most likely be using Visual Studio, Team Foundation Server for version control, possibly SSIS, SQL Databases and SSAS. Throw in Azure and you might be using Azure SQL Data Warehouse with Azure Data Factory and Azure Analysis Services…

    Pros:

    • Change Control

    This feature that can be implemented by Team Foundation Services allows for a developer to manage their code. In the context of the model, this means that I can check in/check out and historically track all the changes to the model. Which in turn allows me to roll back to a previous version, control who has access to the model and secure the access to the model to a known group.

    • Central model that supports many reports

    Hands down the benefit to the model / live connection is that I can build a central model that supports a vast number of reports. This streamlines development, lowers the time to implement changes across all reports from IT and centralizes calculations so that all parties are using the same metrics.

    • No memory or size constraints in Power BI

    Another great feature is that a dedicated server / Azure implementation has the capability to scale up to whatever RAM is necessary to support the model. The limitations of the Desktop are gone, and Power BI capable of handling insanely high volumes of data. This is because the heavy lifting is happening behind the scenes. A prime example of this the new MSFT demonstration that uses 10 billion rows of data related to NY taxis. (Did you catch that? That is a “B” for “BILLION”) I saw it for the first time at PASS Summit 2017, but you can see a quick demo of that below, or here in the first portion of this scale up & diagnostic video.

    Now, the underlying hardware in Azure must be immense for this to contain the 9TB of data, but I still think it is amazing that Power BI can provide the same drag and drop experience with quick interaction on a dataset that large. Simply amazing.

    • More Secure & Better security

    Along with the security of being permissioned to access the model there is an extremely valid argument related to security that just make a SSAS model better. The argument is that while the functionality exists in the Power BI Desktop to enable row level security, the vast majority of the time, the report author shouldn’t control access to certain sensitive information. Having that live in a file accessible by others to be modified isn’t something that passes muster in most orgs. With a model that has limited access, change control and tracking, and process for deployment the idea that a DAX function controlling a security access level to information becomes more palatable.

    • Partitions

    This feature enters stage left and it is just “Awesome”. Partitions in a model allow you to process, or NOT process, certain parts of the model independently from one another. This gives an immense amount of flexibility in a large-scale solution and make the overall processing more efficient. Using partitions allows you to only process the information that changes and thus reduce the number of resources, reduce processing, and create an efficient model.

    All in all, a lot of this article was about model options behind the scenes, but effectively this is the core of the Live Connection. It is all the underlying Enterprise level tools that are required to effectively use the live connection against a SSAS instance. In some respects, I hope that this gives you some understanding of the complexity and toolsets that are actively being used when you are using Power BI in general. All these technologies are coupled together and streamlined to a clean user-friendly tool that provides its users with immense power and flexibility. I hope you enjoyed this series and that it brought some clarity around the different connection types within Power BI.

    Thanks for reading! Be sure to follow me on Twitter and LinkedIn to keep up to date with Power BI related content.

    TwitterLinkedin

  • Power BI Connections: Direct Query

    Power BI Connections: Direct Query

    Now that we’ve solidly gotten through the basics in terms of what connection types are in the opening blog, found here, and detailed out what is included in the default connection type of Import found here, let’s get on with some of the more interesting connections.

    Connection Type Outline
    Connection Type Outline

    Direct Query is the first connection type that we will discuss that extends, but at the same time limits functionality in the tool itself. In terms of data access this connection type allows us to access our data in the source system. The supported data sources for direct query can be found here. This is distinctly different than what we observed in the import method.  When using Import, the data is a snapshot and refreshed on a periodic basis, but with Direct Query it is live. “Live” means that with Direct Query the data stays in the source system and Power BI sends queries to the source system to return only the data it needs in order to display the visualizations properly. There are some pros and cons in using this connection so it is important to understand when you might use it, and when you should probably avoid this connection.

    Cons:

    • When Direct Query is used you can no longer do many of the data mashup actions in the “Edit Queries” section of Power BI. It is assumed that you will have already done this in the backend. You can do simple actions such as removing columns, but don’t expect to be able to manipulate the data much. The Query Editor will allow you to make transformations, but when you try to load to the model you will most likely get an error that looks something like this
    Direct Query Error
    Direct Query Error 
    • The data tab is also disabled in the model layer and thus you need to make sure that all the formatting and data transformations are completed in the source.
    Data Tab no longer present
    Data Tab No Longer Present
    • You can do some minor adjustments to format, but this could be a heavy restriction if you don’t have access to the data source.
    • There are performance impacts to the report that need to be taken into consideration. How large is the audience that will be interacting with the report? How busy is the source system, are there other processes that could be impacted?
    • Troubleshooting skills in source system language
    • Multiple applications required to adjust data ingestion and formatting

    Pros:

    • The Direct Query connection does not store any data. It constantly sends queries to the source to display the visuals with the appropriate filter contexts selected.
    • In the November 2017 release there is a new capability in Power BI allows you to reduce the traffic and enhance this connection method exponentially. The feature is called Query reduction, and allows you to enable an “apply” button on a slicer or filter. The benefit with this option is that you can set all your selections of a filter prior to Power BI executing the query. Before this feature was available, every selection you made would fire off a query to the source database. To enable this feature, go to File -> Options and Settings -> Options -> Query Reduction you will find these options to help with Direct Query Performance.
    Query Reduction Options
    Query Reduction Options

    Note: This enhancement greatly increases the performance of a Power BI report against the data source, but be aware that there could be poor query performance, or aspects of the solution that would require troubleshooting in the data source depending on what queries are being passed. This would require understanding of how to performance tune the source.

    • Deployment of the Direct Query connection requires the use of the gateway previously called the Enterprise Gateway. Note that the Enterprise Gateway is different than the personal Gateway.
    • No data is ingested into the model using Direct Query thus, there is no need to schedule a refresh. Once the dataset is connected to the Gateway, the data source feeds information to the report as the user interacts with the report.
    • It will always show the latest information when you are interacting with the report.

    Direct Query is a powerful connection type in that it produces the most up to date data. However, as we have seen, it does come with some considerations that need to be taken into account. The Pros and Cons of the connection mostly revolve around whether or not the end user can understand and deal with potential performance issues, updating data retrieval processes, and understand the downstream implications of a wider audience. Typically, Direct Query is used in extremely large datasets, or in reports that require the most up to date information. It will most likely always perform slower than an import connection and requires an understanding of tuning and troubleshooting of the data source to alleviate any performance issues.

  • Power BI Connections: Import

    Power BI Connections: Import

    Power BI’s default connection type is Import. In fact, if you have never dealt with a data source that handles multiple loading methods, you may never know that there are different loading methods because Power BI automatically connects via import. However, if you’ve ever worked with sourcing information from databases or models, then you have seen the option to select Import vs. Direct Query or Live Connection.

    Note: This is a continuation of the Power BI Connections series.  If you would like to read the overview of all the Power BI Connection types you can do so here.

    Below is a quick chart to outline some of the considerations to help you decide whether import is right for you.

    Connection Type Outline
    Connection Type Outline

    Import is the only connection type that brings to bear the full capabilities of the Power BI Desktop. As you move from Import to Direct Query to Live Connection, you trade off ease of use for solutions that will scale.

    Import will pull in the data from the data sources that you have connected to and store & compress the data within the PBIX file. The eventual publishing of the PBIX file will push the data to Azure services supported in the Power BI Backend. For more information on data movement and storage see the Power BI Security Whitepaper.

    When using import, the full Edit Queries suite is available to mash up any data source, transform data-sets and manipulate the data in any way you see fit.

    Query Editor
    Query Editor

    Once you click Close & Apply, the data is loaded into the “front end” of Power BI into the Vertipaq engine.

    Note: The Vertipaq engine is used in both Excel and SQL Server Analysis Services Tabular models. In simple terms, it is the backbone that compresses all your data to make it perform extremely fast when visualizing, and slicing & dicing. For more detailed information on the engine see an excerpt from Marco Russo & Alberto Ferrari’s book “The Definitive Guide to DAX: Business intelligence with Microsoft Excel, SQL Server Analysis Services, and Power BI” found here.

    At this point it is ready for you to extend by building out the relationships between your objects in the model section. After the model is set up you will now be able to add any additional calculations in the DAX (Data Analysis Expressions) formula language. There are two types expressions that you can create, measures and calculated columns. To create these, you can go to modeling, and select the option. When you do this, the formula bar will display. You can also right click on any column or field and select “New measure” or “New column” from those drop down lists.

    New DAX Measure or Column
    New DAX Measure or Column

    Other than the formula bar with intelli-sense, there are several built in tools that can help you build those calculations.

    The first method is to Right Click on the desired field and select an implicit calculation from the drop down:

    Using Implicit Calculations
    Using Implicit Calculations

    The second is Quick Measures.  This can be accessed by using right click as described above.

    Using Quick Measures
    Using Quick Measures

    Here is an example of the Quick Measure dialog box:

    Quick Measure Dialog Box
    Quick Measure Dialog Box

    Quick Measures allows you to choose from a wide variety of calculations to generate a measure. Once the measure is created, you can interrogate the measure and see the code that was generated.  Click on the measure (denoted by a little calculator next to the text) created by the Quick Measure dialog box to see the DAX code.

    Here is an example of what that looks like:

    Sample of Quick Measure
    Sample of Quick Measure

    This is a great method to get your feet wet while you’re learning DAX.

    Note: there are a lot of safety features added to these Quick Measures, such as, an “if” statement wrapped in a “isfiltered”.  You might have to remove these bits of code in order to play with the measure.

    When you have completed your report and publish the report & corresponding dataset to the Power BI Service, you will need to schedule a refresh.  This will be required for any report which relies on the Import Connection. There are numerous use cases that surround whether or not you need a gateway, but a simple rule applies. If the data comes from an on-premises source, you will need one, for cloud sources you usually do not, but you can find in depth refresh documentation here.

    The Import connection has the least amount of restrictions between the three methods, Import, Direct Query, and Live Connection. However, there are a few Import restrictions you should be aware of.

    First, depending on your data source and the size of the data set, the processing of the model could take a bit of time.

    Second, since all the data is being loaded into a table, there is a limitation on how big the file can get for successful publishing to the Power BI Service. That limit is 1 GB for free users & Power BI pro users, 2 GB for Report Server Reports and for Premium Users the size is only bound by the amount of memory you have purchased.

    Note:  The PBIX file can get as large as you want, however, it won’t let you publish.

    Using Import is good when:

    1. You can schedule your data to refresh
    2. Data only needs to be refreshed periodically
      1. Can be refreshed up to 8 scheduled refreshes in a day (restriction from Power BI Service)
    3. The amount of data your importing is relatively small (doesn’t need to scale)
    4. You need to mash up multiple sources such as Azure SQL database and google analytics data sources

    In summary, the Import method is the most flexible, provides all the tools to connect, mashup, extend and visualize your datasets within the Power BI Desktop. It is likely the most used connection type and is the default for all connections. The data you connect to is drawn in, and a copy created and used in both the Desktop and the Service. Scheduled refresh is a requirement for almost all scenarios, and it is likely a gateway is required as well if your data is not located in the cloud.

  • Power BI Connection Types

    Power BI Connection Types

    Get Data – Power BI Connection Types: An Introduction

    Hi, I’m Seth, I am very excited to be a contributing on PowerBI.tips.  Mike has done an incredible job curating fantastic content for the PowerBI Community.  In this first blog I will introduce you to the different types of connections that you can make using the Power BI Desktop. We will identify the various types of connections.  In future posts we will dive into specific examples of usage and tips in tricks.

    When I say “Types”, I don’t mean connecting to databases, Excel, SharePoint, etc. Those are just different data sources. I’m referring how Power BI ingests or interacts with data sources that you want to connect to. Believe it or not, Power BI doesn’t always have to pull all your data into the Power BI Desktop file. Depending on what sources of data you are connecting to, you could not even realize that there are more options, or be uncertain of what they do. In fact, depending on what type of connection you choose you are also altering how the Power BI Desktop functionality works! Now that I have your attention, let’s jump into the good stuff.

    First things first. The only time you will be faced with an option to choose a type of connection, are when you connect to a data source that support multiple connection types. If all you connect to is Excel, you would never see an option in the dialogues because it only supports one type of connection.

    There are really 3 main types of connections. The first is the most widely used, and is the default when connecting to most data sources. It is Import. This connection will ingest or pull the data from the data source and become part of the PBI Desktop file.  An example of where you would select import Is in the SQL Server dialog box.

    SQL Server Import
    SQL Server Import

    You can import data from a SQL Server by clicking Get Data on the Home ribbon.

    Get Date SQL Server
    Get Date SQL Server

    The import connection type allows you to use the full capabilities of the Power BI Desktop and you can manipulate it however you see fit. A way to validate this is by looking at the left-hand navigation and you will see three selections.  The top selection which resembles a bar chart is the Report Page.  This is where you would place all your visuals and develop your report pages.  The second item from the top, which looks like a table is just that, the Data view in a table form.  This lets you see all the data contained with a loaded data table.  Finally, at the very bottom, the relationships selection.  This is where you will see multiple tables and the connections between the tables.  The relationships section feels like working SQL or in Microsoft Access.

    Import Options
    Import Options

    The 2nd connection type is Direct Query.  Notice in direct query mode the third item, relationships has been removed.  The direct query connection type is only available when you connect to certain data sources. The list of the data sources that are accessed using direct query can be found here.  This connection is unique in that the data does not get loaded into the PBI Desktop.  What happens, is that Power BI can communicate in the language of the data source and request information as you interact with your Power BI Visuals. The useful thing about this connection is that the data never leaves the data sources, it is only queried.  Direct Query does limit what you can do from a data manipulation perspective.  Power BI assumes you are already doing all the necessary data manipulations in your source. As a result, you don’t even have the option to mashup data and that selection is removed in the left-hand nav.

    Direct Query
    Direct Query Options

    The 3rd type is Live Connection. There are only 3 data sources that support the live connection method at this time.  All of them are a type of (SSAS) SQL Server Analysis Services. Those types are Multidimensional, Azure Tabular and Tabular on premises. The live connection type is the most unique in that it recognizes the full model or cube that you’ve created.  Power BI Desktop turns off all data prep features.  Thus, the user is given a bare minimum in formatting and report side calculations.  All the heavy lifting is done on the server that supports the model and Power BI is only used as a reporting tool. This connection is used mainly by IT and enterprise implementations. If one looks at the left-hand navigation, you quickly realize that it is the most restrictive in terms of what can be done in the Desktop itself.

    There is a fourth Live Connection that defaults to the connection type, and this occurs when you use the Power BI Service as a data source. This connection is using a SSAS connection, only the end users don’t need to set anything up other than having dataset to connect to in the Service.

    Live Connection Options
    Live Connection Options

    Finally, there are two types of connections that dive a bit deeper than what comes with the Desktop out of the box. Those are Custom Data Connectors and API/Streaming. For the time being, we’ll leave these as just high-level points for now, and dive deeper into them in the specific articles in the future.

    I hope you’ve found this initial primer useful. As this series continues we’ll dive into some of the reasons for using each of these types of connections, why you would want to, and the positives and negatives in choosing which one, provided you have a choice.

  • Copy Power BI Desktop Server:Port Connection String to Clipboard

    Copy Power BI Desktop Server:Port Connection String to Clipboard

    Howdy, folks!

    A few months ago, I was writing and running various PowerShell scripts to manipulate the connected data models in my Power BI Desktop files. During model development, I was constantly having to open DAX Studio to copy the Server:Port connection string, and thinking, “there’s got to be a faster way to do this.”

    So, I developed and released a simple External Tool for Power BI Desktop, which copies the Server:Port connection string for the currently-connected data model directly to the clipboard.

    I’m a strong believer in modular design, so when I build something, I try to make it do one thing, and do it well. I believe this External Tool for Power BI Desktop is a great example of that philosophy in action.

    This external tool is now in the Business Ops tool from PowerBI.tips.

    Enjoy!

    James

    If you like the content from PowerBI.Tips please follow us on all the social outlets. Stay up to date on all the latest features and free tutorials.  Subscribe to our YouTube Channel.  Or follow us on the social channels, Twitter and LinkedIn where we will post all the announcements for new tutorials and content.

    Introducing our PowerBI.tips SWAG store. Check out all the fun PowerBI.tips clothing and products:

    Check out the new Merch!

    Hasta La Vista Data
    Go Ahead Make My Data
    PBIX Hat


  • Hot Swap Power BI Report Connections

    Hot Swap Power BI Report Connections

    Let’s say you have a Power BI file connected to an Analysis Services machine. Then you want to change the data source to PowerBI.com using a Live Connection. Well, you are out of luck. Until NOW!!

    This post describes how to remove a connection from a report using a PowerShell Script. This means any source you can just delete the data source and then re-point your report.

    Note: that this script is not officially supported by Microsoft. This code is provided as is without any guarantees. The code will alter the internal files, so please keep a backup if you are unsure of anything.

    Use Cases

    Image the following diagram. Here we have a Power BI Report Connected to an analysis services model. Now, you wish to re-point the model to a Power BI dataset.

    Note: we assume the analysis services model and the Power BI dataset model have the same definition. Meaning all the columns and measures are the same.

    The below script removes connections Power BI Report.

    Download Script

    Download the Power Shell Script here

    Note: Running it on a file without a live connection will not have an effect on the file.

    Running the code

    Download the PowerShell file and save it to your local machine.

    Right click and select the option Run with PowerShell in the menu.

    A menu will open up. Select the power bi file that you wish to remove the connection from.

    Click the button OPEN to allow the script to modify your file.

    The script will leave all visualizations and report features intact. But, all connections will be removed. When you open the report again in power bi desktop, all visuals will appear broken:

    This is because you have removed all data from the report. Select a new data source to connect the report to. If the new source matches the names of the columns and measures used in the visuals, they will all repopulate.

    How the Code Works

    Internally, PBIX files contain a selection of metadata and media files. The files are zipped and packaged into a pbix file.

    The PowerShell script will alter these internal files, removing the Connections file which holds the information to the live connection.

    It then removes a security file, SecurityBindings, that is necessary to remove in order to not corrupt the file. SecurityBindings will be repopulated the next time you edit and save the file.

    Script

    #This script was designed by Steve Campbell and provided by PowerBI.tips
    #BE WARNED this will alter Power BI files so please make sure you know what you are doing, and always back up your files!
    #This is not supported by Microsoft and changes to future file structures could cause this code to break
    
    #--------------- Released 5/28/2020 ---------------
    #--- By Steve Campbell provided by PowerBI.tips ---
    
    
    #Choose pbix funtion
    Function Get-FileName($initialDirectory)
    {
        [System.Reflection.Assembly]::LoadWithPartialName("System.windows.forms") | Out-Null
        
        $OpenFileDialog = New-Object System.Windows.Forms.OpenFileDialog
        $OpenFileDialog.initialDirectory = $initialDirectory
        $OpenFileDialog.filter = "PBIX (*.pbix)| *.pbix"
        $OpenFileDialog.ShowDialog() | Out-Null
        $OpenFileDialog.filename
    }
    #Error check function
    function IsFileLocked([string]$filePath){
        Rename-Item $filePath $filePath -ErrorVariable errs -ErrorAction SilentlyContinue
        return ($errs.Count -ne 0)
    }
    
    
    #Choose file
    try {$pathn = Get-FileName}
    catch { "Incompatible File" }
    
    
    #Check for errors
    If([string]::IsNullOrEmpty($pathn )){            
        exit } 
    
    elseif ( IsFileLocked($pathn) ){
        exit } 
    
    #Run Script
    else{    
       
        #Unzip pbix
        [Reflection.Assembly]::LoadWithPartialName('System.IO.Compression')
        $zipfile = $pathn.Substring(0,$pathn.Length-4) + "zip"
        Rename-Item -Path $pathn -NewName  $zipfile
    
        #Delete files
        $files   = 'Connections', 'SecurityBindings'
        $stream = New-Object IO.FileStream($zipfile, [IO.FileMode]::Open)
        $mode   = [IO.Compression.ZipArchiveMode]::Update
        $zip    = New-Object IO.Compression.ZipArchive($stream, $mode)
        ($zip.Entries | ? { $files -contains $_.Name }) | % { $_.Delete() }
    
        #Close zip
        $zip.Dispose()
        $stream.Close()
        $stream.Dispose()
    
        #Repackage and open
        Rename-Item -Path $zipfile -NewName $pathn 
        Invoke-Item $pathn 
    }

    Editing the Code

    The code runs on PowerShell. PowerShell is a cross-platform task automation and configuration management framework, consisting of a command-line shell and scripting language.

    If you want to view or edit the code, first open PowerShell ISE. We recommended to run as administrator. Afterwards, you can paste the code below into the editor.

    Other Considerations

    The script can be useful when using two power bi files for development and deployment to the PowerBI.com service. In this use case you will have one Power BI that is the bifurcated model and one report that has just report pages. To speed up development you can Open both the Model file and the Report file. The Report file can point to a LocalHost version of the running Analysis Services.

    Here is an example of what this architecture would look like.

    Script Usage License

    Permission is hereby granted, free of charge, to any person obtaining a copy of this software and associated documentation files (the “Software”), to deal in the Software without restriction, including without limitation the rights to use, copy, modify, merge, publish, distribute, sublicense, and/or sell copies of the Software, and to permit persons to whom the Software is furnished to do so, subject to the following conditions:

    The above copyright notice and this permission notice shall be included in all copies or substantial portions of the Software.

    THE SOFTWARE IS PROVIDED “AS IS”, WITHOUT WARRANTY OF ANY KIND, EXPRESS OR IMPLIED, INCLUDING BUT NOT LIMITED TO THE WARRANTIES OF MERCHANTABILITY, FITNESS FOR A PARTICULAR PURPOSE AND NONINFRINGEMENT. IN NO EVENT SHALL THE AUTHORS OR COPYRIGHT HOLDERS BE LIABLE FOR ANY CLAIM, DAMAGES OR OTHER LIABILITY, WHETHER IN AN ACTION OF CONTRACT, TORT OR OTHERWISE, ARISING FROM, OUT OF OR IN CONNECTION WITH THE SOFTWARE OR THE USE OR OTHER DEALINGS IN THE SOFTWARE.

    If you like the content from PowerBI.Tips please follow us on all the social outlets. Stay up to date on all the latest features and free tutorials.  Subscribe to our YouTube Channel.  Or follow us on the social channels, Twitter and LinkedIn where we will post all the announcements for new tutorials and content.

    Introducing our PowerBI.tips SWAG store. Check out all the fun PowerBI.tips clothing and products:

    Check out the new Merch!

    Hasta La Vista Data
    Go Ahead Make My Data
    PBIX Hat


  • Creative Thinking in Fabric & Power BI

    Creative Thinking in Fabric & Power BI

    In podcast #286 we take the time to review an older video of John Cleese giving a talk about the Creative Process in Management. We thought this would be an outstanding conversation to draw parallels to the Business Intelligence world. There are so many different areas we can apply creative thinking in implementing Fabric & Power BI solutions.

    You can check out that video by John Cleese here -> https://youtu.be/Pb5oIIPO62g?si=66KNV2I8p5ZlESzz

    Episode 286 – Creativity in Power BI

    Talking Points:

    • What is Creativity, and what strategies can we use to be more creative?
    • Discussion centered around the concept of being creative in handling data, building reports and fostering a data culture.
    • Emphasize that creativity is not a talent but a mode of operation and discussed its relevance in the field of Business Intelligence.

    Key Topics:

    Where does creativity lie:

    • Discussed the distinction between open and closed states.
    • Strategies to foster creativity and measure its benefits.
    • Dedicated time for creative thinking, challenging the conventional to-do list approach.
    • Creating an oasis of quiet for pondering and problem-solving.
    • Embracing humor as a catalyst for transitioning from closed to open thinking.

    Overcoming Barriers:

    • Identifying common obstacles to creativity within organizations dealing with technology and data.
    • Evaluating the balance between analytical rigor and creative exploration in Power BI.

    Applications and Tips:

    • Exploring creativity in the adoption of BI practices, report building, and its application in day-to-day operations.
    • Building reports with an open mindset.
    • Allowing time for pondering before making decisions.
    • Encouraging positive collaboration within a community.
    • Applying the “art of the possible” by exploring new ideas.

    Meeting Creativity:

    • Examining the impact and value of injecting creativity into BI processes for organizational growth.
    • Introducing humor in meetings to foster creativity.
    • Building on ideas without fear of right or wrong.
    • Utilizing random connections for innovative solutions.
    • Creating a positive environment by avoiding negativity.

    Report Building Process:

    • Front-loading creativity in requirements gathering.
    • Incorporating creative thinking in model design and building calculations for visuals.

    This podcast episode is a treasure trove of insights for BI professionals looking to infuse creativity into their work, ultimately contributing to more innovative and effective business intelligence solutions. You can listen to the full conversation on the Explicit Measures podcast here:

    As a special add-on for your enjoyment Tommy came up with a whole slew of jokes in the same vein that John Cleese told in the presentation. Feel free to use them in your next creative meeting!

    Jokes Created by Tommy Puglia:

    How many data scientists does it take to change a light bulb?
    Three. One to replace the bulb, and two to model whether it was the most cost-effective light bulb choice.

    How many machine learning experts does it take to change a light bulb?
    Just one, but it will take thousands of tries to learn how to do it properly.

    How many business analysts does it take to screw in a light bulb?
    Two. One to assure everyone that everything is going according to the plan while the other screws the bulb into the water faucet.

    How many BI consultants does it take to screw in a light bulb?
    Only one, but they’ll first conduct a cost-benefit analysis to determine if the light bulb change will add value.

    How many marketing analysts does it take to change a light bulb?
    One, but they’ll also rebrand the room to make it look brighter.

    How many sales analysts does it take to change a light bulb?
    Just one, but they’ll convince you to upgrade to a smart bulb with a subscription plan.

    How many data warehouse architects does it take to change a light bulb?
    Two: one to change the bulb and another to ensure it integrates seamlessly with the existing lighting infrastructure.

    How many AI developers does it take to change a light bulb?
    They won’t. They’ll train a neural network to predict when the bulb will burn out and preemptively send a drone to replace it.

    How many cloud storage experts does it take to change a light bulb?
    None. They’ll just store light in the cloud and access it as needed.

    How many Business Analysts does it take to screw in a light bulb?
    Just one, but they will first interview everyone in the room to define the requirements for the ‘ideal light’ experience.

    How many Data Analysts does it take to change a light bulb?
    Two. One to replace the bulb, and the other to tell everyone how much brighter it could be with just a few more data points.

    How many stakeholders does it take to change a light bulb?
    Four. One to ask for a greener bulb, one to demand a cost-effective solution, one to insist on a smart bulb, and one to question why the bulb needs changing at all.

    How many report requesters does it take to change a light bulb?
    None. They’ll just ask for a daily report on the status of the light bulb but never actually replace it.

    How many Data Analysts does it take to screw in a light bulb?
    One, but by the time they’ve finished analyzing the best method, the technology for light bulbs has already changed.

    How many stakeholders does it take to change a light bulb?
    Five. One to change it and four to form a committee that debates whether it was better the old way.

    How many report requesters does it take to change a light bulb?
    None. They just keep requesting status updates on the darkness.

    How many BI Consultants does it take to screw in a light bulb?
    Two. One to assure the client that they’re leveraging cutting-edge lightbulb technology, and the other to outsource the actual screwing in to an intern.

    How many BI Consultants does it take to change a light bulb at a large corporation?
    An entire team, but the project will take three years and by the end, they’ll switch to a completely different kind of bulb.

  • Does a Power BI developer need Python?

    Does a Power BI developer need Python?

    In this episode of the Explicit Measures Podcast, we discuss the values of adding Python knowledge. It is well known that more organizations are moving to cloud platforms. Because of this, we should ask the following questions:

    • What will be the needed skills for Power BI professionals?
    • Is this for the Business or for a Data Engineer?

    We invite you to jump in and listen to the podcast as we discuss these topics. Enjoy!

    YouTube Explicit Measures Podcast

    Listen on the go

    Don’t want to watch the video, no problem we are on all major podcast platforms.
    Spotify
    Apple Podcasts
    iHeart Radio

    Ask Chat GPT

    As in all our episodes we like to end with what does chat GPT say. Thus, our question for this episode is

    Should I learn Python for Power BI development?

    Chat GPT response

    The response was quite interesting, discussing the various factors as to why Python is valuable. Overall, we gave chat GPT a better than average score of about 6.5 out of 7.

    Learning Python can be beneficial for Power BI development. Python is a versatile programming language that is widely used in data analysis, data manipulation, and data visualization tasks. Power BI has its own built-in capabilities for data processing and visualization. Python can extend its functionality and provide additional flexibility.

    Here are a few reasons why learning Python for Power BI development can be advantageous:

    Data Manipulation

    Python has a rich ecosystem of libraries such as Pandas, NumPy, and scikit-learn. These libraries are excellent for data manipulation, cleaning, and transformation. Use Python to preprocess and shape your data before loading it into Power BI.

    Advanced Analytics

    Python offers a range of libraries for advanced analytics and machine learning, such as TensorFlow, Keras, and PyTorch. Integrating Python code into Power BI, you can leverage these libraries to perform complex calculations. Additional features could include predictive modeling, or create custom machine learning models to enhance your data analysis capabilities.

    Custom Visualizations

    Power BI provides a variety of built-in visualizations. But, if you have specific visualization requirements or want to create custom charts. Python can be a powerful tool for visual development. Libraries like Matplotlib and Seaborn offer extensive options for data visualization. Enabling you to generate interactive and customized charts and graphs to present your insights effectively.

    Automation and Integration

    Python can help automate repetitive tasks and streamline your Power BI workflows. You can write Python scripts to extract data from different sources, transform it, and load it into Power BI automatically. Python’s integration capabilities enables connections with other tools and platforms, such as web APIs, databases, or cloud services. Python expands the scope of your data analysis.

    Community Support

    Python has a large and active community, with abundant resources, tutorials, and forums available. Learning Python can provide you with access to a wealth of knowledge and expertise. A Large community makes it easier to find solutions to specific challenges.

    In conclusion, while it is not necessary to learn Python for Power BI development. It can certainly enhance your capabilities and offer more flexibility in data manipulation, advanced analytics, custom visualizations, and automation. Consider your specific requirements and goals for a project. Your project requirements may determine whether investing time in learning Python would be beneficial.

    Chat GPT – May 12 Version

    Not bad Chat GPT. I would disagree with a couple points made on how easy it is to integrate python into Power BI. Two options I am aware of today using Python in Power Query.

    Option 1 – Using Python in Power Query

    Using Python in Power Query from Microsoft Learn

    Option 2 – Using Python for Visuals

    Using Python to develop a Visual

    I feel that more of python is used in cloud services. This was a major point brought by Seth in the podcast. Very valid point.

    Overall, we hope you enjoyed the podcast! See you next time.

    Buy some fun Swag

  • Power BI Bookmarks Tips, Tricks, and Best Practices

    Power BI Bookmarks Tips, Tricks, and Best Practices

    This article describes Power BI Bookmarks tips, tricks, and best practices. Bookmarks are a powerful feature that can greatly improve the reader’s experience. However, there are several settings you should be aware of. Used incorrectly, they can become hard to maintain and often not display the intended functionality.

    Power BI Bookmarks

    This article will assume some basic knowledge on how to record or apply bookmarks. Please see this. If you are new to Bookmarks, you may want to watch this helpful video by Adam Saxton from Guy In A Cube.

    It will run through an example of using a switch visuals bookmark group. If you have not seen this before, I suggest you watch this video, also by Guy In A Cube.

    You should be familiar with:

    The rest of the article will focus on some tricks and tips using bookmarks, while walking through an example of a visual switch between a map and a graph.

    Tips Covered


    Change Power BI Bookmark Settings

    You should always update the bookmark settings when creating them. This should always be as specific as possible to the action they are trying to achieve.

    Here is a quick breakdown of the settings:

    Data: This captures items including filters and sort order. It does not capture if the item is visible or not.

    Display: This captures whether an item is visible or not, without modifying filters or sort order.

    Current Page: This will switch to the current page view if you apply the bookmark from a different page. If unselected, it will still apply the bookmark, but it will stay on the page you apply it from.

    All Visuals: If this option is selected, it captures every setting on the page. This can include items in the filter pane, or even if the filter pane is open. I would recommend to never use this setting.

    Selected Visuals: Selected visuals still only apply bookmarks to the visuals you had selected when you record the bookmark. You can select items by holding control and clicking on them in the selection pane.

    In general, I try not to use both Data and Display together, as most cases bookmarks are just changing one of these fields. Previously, it was required to use bookmarks to navigate pages. However, this is no longer needed after new functionality allows this to be done with buttons directly. Therefore, I rarely use this feature.

    One of the best Power BI Bookmarks tips – use selected visuals only. Recording bookmarks on all visuals often has unintended consequences and can be difficult to manage. Rarely is this needed and can become very hard when adding more visuals to the page.


    Rename Your Visuals

    The first tip is to rename your visuals. Each visual is given a name, which can be viewed in the Selection Pane. By default, the name is usually the type of visual it is. This means if you have several slicers on a page, you might get a list of several visuals with the same name. While this is not an end user feature, it can make it difficult to identify the correct visual when developing.

    We recommend renaming each visual when you add it. First, open the selection pane. Next, double click on the visual you have just added in the selection pane. Rename the visual to something that calls out what it is. Our recommended naming strategy is the following.

    Visual - Description
    The selection pane
    Example of renamed visuals in a selection pane

    Pro Tip: When a page contains multiple bookmarks it’s difficult to know what Bookmark touches which Visuals or Groups. Thus, when you are planning multiple bookmarks on a single page add an ID at the end of the Visual or Group. This will correspond to a number listed at the end of the Bookmark.


    Record Power BI Bookmarks on Groups

    Using groups has huge benefits for Power BI bookmarks. If you record bookmarks on groups instead of individual visuals. Now, any edits made on the content of the groups will flow through, without the need to re-record bookmarks.

    For example, let’s say I want a bookmark that switches a visual from a table to a map.

    First, I’m going to make the groups. Open the selection pane. Whilst holding control, click on each visual that should be in the group. Right-Click on one of the selected visuals, then click the list option named Group then in the sub menu Group. You should also rename the group, so you know what it contains.

    Visual image showing how to group visuals, as described in the text above.

    Note that to set up a group, you need at least two visuals. In my example, I have a graph visual and a title. If you have just one, you can still set up a group. Simply add a blank text box or shape and group it with your visual. You can then delete the blank text box or shape and the group will persist.

    HINT: Elements can be difficult to move or select after grouping. If you want to modify a visual, use the selection pane to select it easily. If you want to move it, click and drag the ellipsis to move it.


    Add Placeholder Groups to Easily add More Visuals

    Next, I will set up the remaining groups. Aside from the map group, I’m also going to add some placeholder groups. To do this, I will add a blank visual and a blank text box.

    Power BI Bookmark tips: Grouping visuals

    Next, I’m going to select the new group. Then I’m going to copy and paste using Control-C and Control-V to create three placeholders.

    Now that all the groups are set up, it is time to record the bookmarks! For each group follow these steps:

    1. Using control, select all visual groups including the placeholders.
    2. Using the eye, hide all visual groups except the Map – Visual Switch.
    3. Rename the bookmark in the bookmark pane by double clicking it.
    4. Click the ellipsis to open the bookmark settings.
    5. Deselect Data and Current Page. Change to Selected Visuals. The settings should look like the picture above.
    Power BI Bookmark tips: Adding the bookmark and changing the settings

    Rename and Group Bookmarks

    Two more Power BI Bookmarks Tips are to rename the bookmarks and to group them. In addition to renaming your visuals when adding them, you should also rename your bookmarks. For the bookmarks themselves, I do action name – function.
    Secondly, you should group similar bookmarks together. For example, the bookmarks in the visual switch should be put in the same group. This group can also be renamed. I often like to include the page name in the group and then its function.

    Image showing renamed Power BI bookmarks. The names read Sales Overview - Preset filter selections, Product - Visual Switch, Show Graph - Visual Switch, Show Map - Visual Switch
    Example of Power BI bookmark groups and names

    Pro Tip: You will want to provide a connection between the bookmarks and the visual elements on the page. By adding an ID at the end of the Visual or Group and the Bookmark you can create a traceable link. This is especially important when you have multiple repot developers working on the same report. Adding an ID signals to the next report developer that these bookmarks are influencing the associated items on the Selection pane.


    Layers

    For this section, you should be familiar with the selection pane. Remember that objects at the top of the selection pane are in front of those below it.

    Now that we have our groups, it makes it simpler to have buttons. In my example, I will create a button that says Graph, plus a button that says Map. If we are switching visuals, it is useful to have highlighted what visual is presented. I will highlight with a blue background and bold text.

    One way of doing this, is to layer text boxes behind the buttons. First, create the buttons at the that will contain the bookmark action. This button will be see-through and slightly larger than the text boxes.

    Next, create the middle text boxes that formatted for the selected button name.

    Finally, create the back text boxes that are formatted for the unselected button name.

    Visual description of the layer order described above
    Example of the button elements

    Keep it Tidy

    Once we have repeated for all buttons, we can tidy it up. First, place all button elements in the same position on the page. You can do this easily using the align function.

    Then, place the middle text box inside the group it relates to. This means when the bookmark is applied, the selected format will be visible for the correct visual. The trick is that we will layer the elements, so this text box will appear in front of the unselected text box. The buttons will always be on top, so the functionality will always remain the same.

    Group the front buttons together, and make sure they are in front of the text boxes. These control the functionality of the Power BI Bookmarks.

    Group the back text boxes together, and make sure they are at the back.

    Example of Power BI Bookmark groups

    The layer sets:
    Visual Switch Buttons
    : These are the buttons that apply the bookmarks. This is the top layer and always visible. This contains the Front Buttons.

    Visual Switch Groups: This is the groups we set up earlier. This contains the text box that shows the highlighted button name. As the text boxes are part of the groups, only the selected one is visible. The is the middle layer. This contains the middle text boxes.

    Button Text Boxes: This contains the text boxes that go at the back and show the unselected value. This contains the Back Text Boxes.


    Final Words

    Out of all the Power BI Bookmarks tips, the one I would stress the most is: use the selected visuals setting. It will make your reports much easier to maintain!

    If you are not convinced to use bookmark groups, it was recently announced at MBAS 2021 some extra functionality. This will allow users to apply whole bookmark groups to a page, automatically adding buttons when you add extra bookmarks.

    I also described a similar tip using buttons almost two years ago. This uses slightly more advanced technique, and some functionality was not out then that is now. However, it is still valid and a viable option.

    If you like the content from PowerBI.Tips please follow us on all the social outlets. Stay up to date on all the latest features and free tutorials.  Subscribe to our YouTube Channel.  Or follow us on the social channels, Twitter and LinkedIn where we will post all the announcements for new tutorials and content.

    Introducing our PowerBI.tips SWAG store. Check out all the fun PowerBI.tips clothing and products:

    Check out the new Merch!

    Hasta La Vista Data
    Go Ahead Make My Data
    PBIX Hat


  • Power BI Version Control – Ready to use solution

    Power BI Version Control – Ready to use solution

    Power BI Version Control is a free, fully-packaged solution that lets users apply version control, local editing, and manage PBIX or PBIT files. The solution runs entirely on Power Apps (Power Platform) and SharePoint. Power BI Version Control can give business users or smaller organizations the ability to easily implement and utilize version control for their Power BI projects.

    Note: updating the app version will require you to re-import the SharePoint connection and folders.


    DOWNLOAD HERE

    The latest version is 2.0.1


    In this Article


    What is Power BI Version Control?

    In most version control systems, branching is a method to make edits to code in a safe and reliable way. Typically, users “branch”, or copy, the code to their local machine to make edits. They can then “merge” the code back to the master code, adding comments of what has changed and who changed it. Each change is saved as a different version, with the ability to go back to any version. Small, frequent changes are helpful, making it easy to undo any errors. This type of version control requires that every file be saved in a plain text format, so the differences between two versions of the same file can be easily identified, cherry-picked, merged, etc.

    However, unlike pure source code, Power BI reports are packaged into PBIX or PBIT files, which cannot be compared against each other in the way we just described. This makes it much harder for multiple users to work on the same set of files simultaneously. While it is possible to use Azure DevOps, GitHub, etc. as a version control solution for Power BI reports, it’s difficult to setup and use (especially for non-technical business users). The Power BI Version Control solution bridges that gap by harnessing SharePoint’s built-in file versioning and the user-friendly UI/UX of Power Apps.


    Why use Power BI Version Control?

    Single shared location for reports (no emailing files!)​

    Keeping all of your Power BI report files in SharePoint means that you’ll always know where to find them, and that they’ll always be the latest versions of those files.

    Keep all versions of the report (no adding numbers to file names!)​

    We often want to keep files from the past in case we need to roll back changes. Instead of adding version numbers or initials to the file names (like Sales_Report_v2.5_Final(1)(1).pbix), SharePoint will keep all versions of your report files automatically. Additionally, by using this Power BI version control method, it is possible to roll back to any of these versions whenever needed.

    Ability to check out files exclusively, like a library – only one person can make changes at a time

    When working in teams, you may have multiple people working on a project (see this post on Power BI team members). If you have more than one person who may edit a file, we want to make sure they are not trying to do it at the same time. Power BI Version Control ensures that only one person can check out any given file at once. As a result, nobody else can make edits to a file that you are working on. No more conflicts or working on outdated versions of files!

    Ability to check-in files – add comments describing changes made since the last check-in

    ​After making edits, we want to be able to keep comments about what was changed. With each version we are able to add a description of what has changed since the last version.

    Work locally – make all changes on copies, so we do not edit our files directly

    Another important benefit of Power BI Version Control is that we always work on copies of our reports. We can save and experiment as we work on the files, knowing that we will not accidentally damage a live report. We do all work locally on our machine and separate to our production or live reports. If needed, we can discard all changes and start again.


    How to use Power BI Version Control

    Power BI Version Control – Installation Instructions (YouTube)

    Installing the App

    • Download the Power BI Version Control app solution file (from the link near the top of this page)
    • Navigate to https://make.powerapps.com/
    • Ensure the correct environment is selected
    • On the left menu bar, navigate to Solutions
    • Select Import on the top menu bar
    • Select browse and chose the PowerBIVersionControl_2_0_1.zip file you just downloaded
    • Click Next and Next again until you reach the Connections screen
    • If you have existing SharePoint connections you wish to use (recommended), you can select them from the drop-down list. If not:
      • select + New Connection.
      • Select how to connect (usually recommended to Connect Directly)
      • In the new page that opens, click create and sign in if prompted
      • Once created, you can close the current tab and navigate back to the import screen
      • Click refresh then select the new connection from the drop-down list
    • Click Import. This step may take a few minutes to complete

    Configuring the App

    • Navigate to https://make.powerapps.com/
    • Ensure the correct environment is selected
    • On the left menu bar, navigate to Solutions
    • In the list of Solutions, find Power BI Version Control
    • Click the ellipsis and select edit
    • The app will now open in edit mode
    • Add the SharePoint folder by following the following steps:
      1. Open the data sources tab
      2. Select Add data
      3. Type “SharePoint” in the search bar
      4. Select SharePoint (note: be careful not to select “SharePoint Sites”)
      5. Choose the SharePoint connection you selected earlier
      6. In the pane that opens, enter the URL of the SharePoint site. This should be in the format:
        https://DOMAIN.sharepoint.com/sites/SITENAME
      7. Click Connect
      8. Choose the correct Document Library and click Connect
    • Select the tree view and navigate to the Settings Screen
    • Fix any red X marks on the page by updating the settings to match your folder structure (as described in the next section). If you used the default folder and document library names you should not need to update any settings

    Setting the connections

    • There are four numbered blue boxes that may require updating. If you see any red X marks next to any of the following boxes, click on that box and update the required property.

    1.

    Click this box and make sure Items is selected. Update the text to match the document library name (this is also the name of the data source you imported earlier). Use the IntelliSense (auto-complete) to ensure the correct value is selected. The text should turn green when correct, and the red X should disappear.

    2.

    Click this box and make sure OnSelect is selected. The formula should read Refresh(‘[Your Document Library]’). Update the text to match the document library name (this is also the name of the data source you imported earlier). Use the IntelliSense so ensure the correct value is selected. The text should turn green when correct, and the red X should disappear.

    3.

    Click this blue box (not the label) and make sure Text is selected. Update this to the checked out folder name, surrounded by double quotation marks.

    Note: if you add a forward slash to the end of the folder name, this will add all checked out folders to the same folder. Otherwise, a sub-folder will be created for each user based on their user ID.

    4.

    Click this blue box (not the label) and make sure Text is selected. Update this to the published reports folder name, surrounded by double quotation marks (e.g. “Published Reports”).

    • Check that there are no red X marks. A red error message will also show at the bottom of the screen if there were any errors in setup. Resolve all errors before publishing.
    • Click File then Save
    • After the app has saved, click Publish to ensure all changes are deployed

    Using the App

    Power BI Version Control – User Instructions (YouTube)

    We recommend embedding the Power BI Version Control app in a Teams channel. Additionally, the SharePoint site can be added to the Files section in Teams. This will allow all appropriate members to access the Power BI Version Control app and report files in one place.

    Check Out

    • Open the Power BI Version Control app 
    • Click the Check Reports Out button on the Home Screen 
    • The Check Out Screen will list all PBIX and PBIT files in the Published Reports folder. Select the reports you wish to modify in the Check Out Reports column. You will only be able to check out reports that are not already checked out
    • Click Check Out Reports button
    • Wait a few moments for the reports to process. It may take longer if using large files

    Editing the files

    • Navigate to the OneDrive folder on your local machine. The selected reports will appear in the synced folder Checked Out Reports (or sub-folder)
    • You can now open and edit these files. If using live connections, consider using the Hot Swap Connections Tool
    • If you want to save copies, you can do so in a sub-folder or elsewhere on your local machine. Avoid this when possible. We recommended to make small and frequent updates / check-ins
    • When ready, make sure only the files that are ready for check-in are saved in Checked Out Reports (or sub-folder). Make sure the names of files have not been altered
    • If you manually publish reports, publish immediately before closing and checking in

    Check In

    Once edits are done, Check In the reports from the Checked Out Reports folder to the Published Reports folder. Alternatively, you may wish to discard your work. As a result, this will release the file and ignore any changes you have made. Next, it will delete the file from the Checked Out Reports folder.

    Commit changes:
    • Open the Power BI Version Control app 
    • Click the Check Reports Out button on the Home Screen 
    • This will list all PBIX and PBIT files in the Checked Out Reports folder. Select the reports you wish to Check In in the Check Out Reports column. You will only be able to check in reports that are checked out to you
    • Make sure to add comments. Include details on changes you made. If using Azure DevOps, Planner, or some other project management tool, include the relevant ticket/task number(s) in your comments whenever possible
    • Click the Check in reports button
    Discard changes:
    • Navigate to the Check In page by the button on the main page
    • This will list all PBIX and PBIT files in the Checked Out Reports folder. Next, select the reports with changes that you wish to discard in the Discard Report column. You will only be able to discard reports that are checked out to you
    • Confirm Discard

    Helpful Tips

    Also included in the app is a flow called Initial Step: Create Power BI Reports Library with Folders.

    • Open the flow and select Run
    • Paste in your SharePoint site where you wish to create the folders, site e.g. https://powerbitips.sharepoint.com/sites/powerbi

    Running this will automatically create a library and folders in your desired site. It will use default names, which means you will not need to configure the app in the settings page after connecting to the data source.

    Sync Folders

    You should sync the Checked Out Reports (or sub-folder) that was created to your local machine’s OneDrive, allowing for local edits. If using sub-folders, you must check out a file once to create the folder.

    Ensure to sync only the Checked Out Reports folder (or sub-folder).

    You can sync either through SharePoint or through Microsoft Teams.

    From SharePoint:
    • Navigate to the correct SharePoint site
    • Select Documents and navigate to the Checked Out Reports (or sub-folder)
    • In the toolbar, select Sync
    From Teams:
    • Open the Teams channel
    • In the toolbar, select Files and navigate to the Checked Out Reports (or sub-folder)
    • Select Sync

    You can also add the files to an existing team by selecting Add Cloud Storage.
    Note: See more info on syncing here.

    You can now access the files in this directory from the local machine.


    Limitations and Scope

    Known issues:

    The app will fail if the internal SharePoint name and the Display name do not match. This happens when a SharePoint site is created, and the display name is manually changed later. We are working on a patch for this.

    If you have a very large number of reports, the app may not display all of them. We are working on a patch for this.

    Design:

    This solution is designed to handle thin report files, and not large models. The solution will copy and publish to one single folder, and is not intended to manage environments (e.g. dev / test / prod). It should be connected to a Development environment, we recommend using Power BI Deployment Pipelines to deploy reports from Dev to Test, and from Test to Prod.

    The Power BI Version Control app solution performs these main tasks:

    • Check out and lock editing to a single user
    • Copy files to a local synced folder for safe editing
    • Keep version history and enforce developer comments on each check-in

    If you like the content from PowerBI.Tips please follow us on all the social outlets. Stay up to date on all the latest features and free tutorials.  Subscribe to our YouTube Channel.  Or follow us on the social channels, Twitter and LinkedIn where we will post all the announcements for new tutorials and content.

    Introducing our PowerBI.tips SWAG store. Check out all the fun PowerBI.tips clothing and products:

    Check out the new Merch!

    Hasta La Vista Data
    Go Ahead Make My Data
    PBIX Hat