

This post will walk through how to pull daily stock price from Yahoo! Finance, then transform the data using a technique called a query branch. It will be completed all in the Power Query Editor. We will convert this to a function to reuse on any stock we want.
There are many API to pull stock information that get historical stock prices. Many come with a cost to get this information in a decent format. The technique described here is free but will require some data transformations to get the data in a usable format. The purpose is to explore parameters, web URLs and query branches to design a usable function. If you’re just interested in pulling stock information, skip to the end to grab the M code – just make sure you read the performance considerations.
Note: The content in this blog was first presented at the Power Platform Summit North America on October 18th, 2019.
Getting Started
This blog will use parameters to create functions in Power Query. Some experience using Power Query editor may be helpful, specifically:
– Knowledge of tools such as merge and append queries
– Familiar with query steps and the formula bar
For a detailed look at parameters or if you need to brush up, check out this post on parameters.
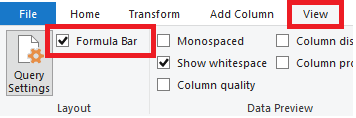
Before starting, you will need to ensure the formula bar in the query editor is open.
Open the Power Query Editor by Clicking the Edit Queries on the Home ribbon of Power BI desktop. Then, go to the View ribbon in the Query Editor and make sure the check box for Formula Bar is turned on.
Create the Parameter
First, Create a Parameter. This is a value that we can change and feed into our query, in this case the stock symbol.
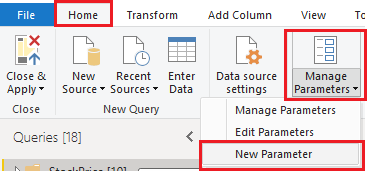
In the power query window, under the Home ribbon, Click the bottom half of the Manage Parameters button. From the drop down Select the option New Parameter.
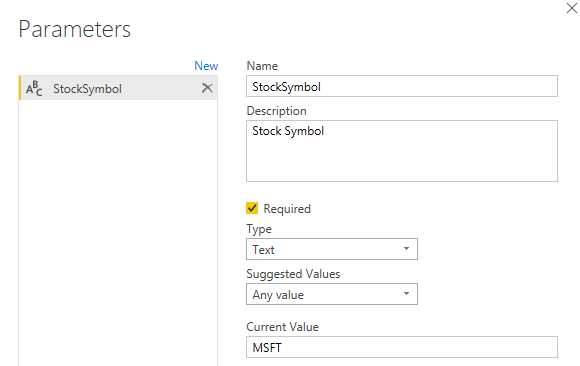
In the Name section, enter the text StockSymbol (without spaces – this makes it much easier to reference later). Give it a description if you like. If you share this report other people can read the description to understand what the parameter is being used for. Change the Type field to Text. Enter MSFT in the Current Value input box. By the way, MSFT is the stock symbol for Microsoft.
Making the Query
Now we have set up a parameter, we can use it to pull in some data. The data source is going to be a web URL. In Power Query editor window, Click the Home ribbon and the button Get Data. Select the item Web in the drop down. In the popup dialogue, Click on the button labeled Advanced.
You’ll notice this brings up a dialog called URL Parts. This allows us to break down the URL into parts. We can easily change individual parts of the URL using this dialog. It will then concatenate it all back together in the order it is entered. Our URL to connect to Yahoo! for a single stock will be split into three parts.
- The base URL, which points us to Yahoo! Finance website and the correct data
- The stock symbol, in this case will be our parameter
- Our other settings (range and interval). These could also be changed in Power BI with a parameter, but we do not want to for this example
The actual URL parts:
| 1 | https://query1.finance.yahoo.com/v8/finance/chart/ |
| 2 | {StockSymbol} |
| 3 | ?range=5y&interval=1d |
In the open dialogue box, first Click the button Add part. This will add a new box. Locate the first window and Enter part 1 of the URL. In the second box, Change the abc symbol to a parameter. Make sure Stock Symbol is selected. In the third box, enter part 3 of the URL. We’re setting the range to 5y (5 years of data) and the interval to 1d (daily). You can change these if you want at a later time.
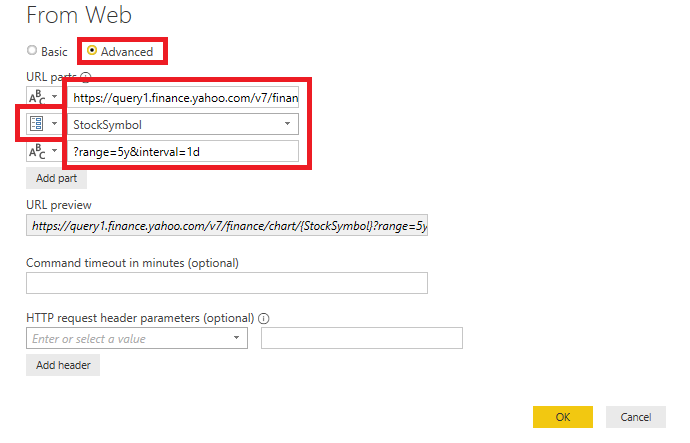
Note: It is important to remember that Stock Symbol is a parameter – change the symbol to parameter and select from the drop down. Do not type Stock Symbol into the box.
Now Hit the button labeled OK. The request will be sent and returned to us in a JSON format.
Rename the query Stock Value. You can edit the name above the Applied Steps section on the right.
Making the Query Branch
The data returned is a little messy and not in the best format. We need to drill down and pull out the appropriate bits of information. Start by drilling down to the correct information. To drill down, Click the underlined result part in the following order:
Chart: Record
Result: List
1: Record
Your screen should look like the image below. If it doesn’t, simply delete the navigation step and start again.
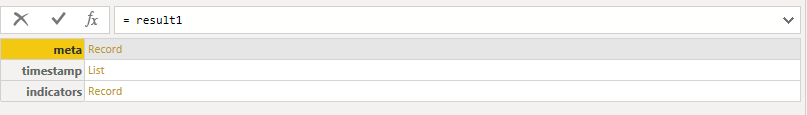
Here, we are presented with three options of paths to drill down further:
Meta: holds some info about the stock, as well as the timeframe and granularity we chose
Timestamp: a list of the dates in the range we selected
Indicators: this holds the price information of stock
Right now, the dates and the price are in two different lists. The price information is another layer down than the dates which makes this more complicated. Extracting these individually would result in a list of random prices and a big list of dates – not helpful if these two pieces of information are not together.
To solve, we will create a Query Branch. The branch will split our query at this step into two paths. One will retrieve the dates, the other the prices. Then we will merge these branches back together to get the dates and prices in the same table.
To start this branch Right Click on the Navigation Step, then Select the option in the drop-down menu Insert Step After. This will reference the previous step and show the same data. Our newly created set is the start of the branch. Rename this new step StartBranch.
Note: the reason for this reference is that the “Navigation” step is not really a step at all. It is actually a collection of steps that Power Query editor groups together. You cannot reference “Navigation”, which will be needed later. You’ll see you cannot rename the Navigation step and if you open the advanced editor you can see the breakdown of individual steps. Another option is two perform any action after the Source step, before you drill down. This will cause Power Query to list each drill down step individually.
Branch 1: Dates
Our first branch we will pull the dates.
Click on timestamp: List.
This will drill down to a list of dates, but they are stored in a UNIX format. UNIX date format is the number of seconds past January 1, 1970 (midnight UTC/GMT), not counting leap seconds. Converting this is quite easy but will take a couple of steps.
First convert the list to a table so we can perform transformations. Click on Transform ribbon. Select the button To Table. Next, under the Add Column ribbon Click the button Custom Column. Change the name to Date and use the following formula in the formula window:
25569 + ( [Column1]/60/60/24 )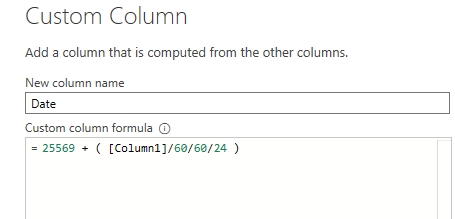
Then Select the Date column. Click the Transform ribbon. Under the Data section, Select the Date format. Note: do not select the Date/Time.
Now we have the date but need to preserve its order. This can be solved by adding an index. Go to the Add Column ribbon, Click the little Drop down on the right half of the Index Column button. Select the option From 0 from the drop down menu. Remove the column labeled Column1, as it is not needed anymore. To do this, Right Click on Column1 and select the option Remove from the drop down menu.
This finishes the branch for the dates. Rename this step EndBranchDate by Right Clicking the step in the APPLIED STEPS and Clicking rename.
Branch 2: Prices
Now we need to get the information for the stock prices. Right Click EndDateBranch and Click the option Insert Step After to add the start of the branch. By checking the formula, we can see it says
=EndBranchDate
This step is doing is referencing the step before it, EndBranchDate. It is duplicating the output of this step. We need to get back to the StartBranch step in order to start the second branch. Change the value in the formula bar from = EndBranchDate to = StartBranch.
This now loads us back to this step to drill down to the stock prices. We will use the adjusted close – this is the stock price at the end of the day after adjusting for dividends. Here we need to drill down to this information, by drilling in the following order:
Indicators: Record
adjclose: List
1: Record
adjclose: List
Next, Covert our list to a Table. see above for this step. Here we have the list of prices and again need to preserve the order with an index column. Go to the ribbon labeled Add Column. Click the Index Column and select From 0 in the drop down.
This is the end of this step, so Rename it EndBranchPrice.
To summarize the query so far:
- Pulled the information for a MSFT stock for 5 years on a daily basis.
- Drilled down to the dates, converted them to a better format and added an index to preserve order.
- Revert to an earlier step.
- Drilled down to the daily prices and added an index column.
Merging the Branches
This leaves two separate tables, but it is only possible to output one of these results. We will need to add a final step to merge these two branches into one table.
On the Home Ribbon, Click the drop down arrow on the Merge Queries button. Then Select the option Merge Queries. This brings up the merge screen. Merge the query with itself. On the bottom half of the merge, Select StockValue (current). Click on the Index column for both top and bottom.
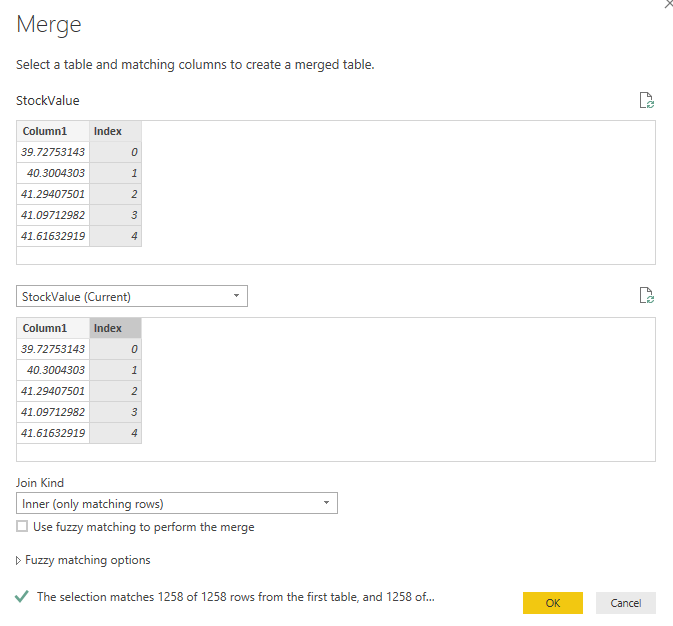
Clicking OK, will merge the data to itself. This is the formula in the formula bar:
= Table.NestedJoin(EndBranchPrice, {"Index"}, EndBranchPrice, {"Index"}, "EndBranchPrice", JoinKind.Inner)This step uses the Table.NestedJoin formula, which has 6 arguments filled in:
Table.NestedJoin(table1 as table, key1 as any, table2 as any, key2 as any, newColumnName as text, optional joinKind )
In our example, table1 and table2 is the same (EndBranchPrice). This makes sense as we joined it to itself. You will notice that when joining from the same query, the table argument references a step in that query (EndBranchPrice). We really want to join EndBranchPrice to EndBranchDate. We can simply change the second table in the formula bar to EndBranchDate:
Change:

To:
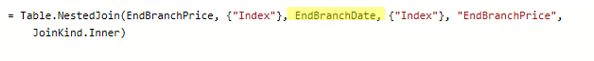
Now, we are joining the EndBranchPrice to the step EndBranchDate. These both have a column named index that we added, which will join our data in the correct order.
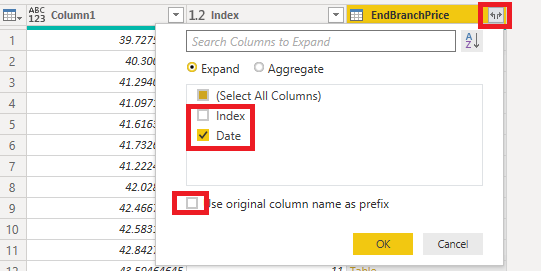
Expand the merged table by Clicking the Expand button on the column name. The settings will just Select the Date and Deselect the option to Use original column name as prefix.
Remove the index column as it is not need this anymore. That completes our query with the branch.
Enabling Publish to the Service
If we want to publish this to the service (app.powerbi.com), we will need to make a small edit to our URL. The service will not allow parameters in the base URL. To get around this, we can split our URL using an option in Web.Contents called RelativePath. After Clicking on the Source in the applied steps window, Edit the URL as follows:
From:

To:
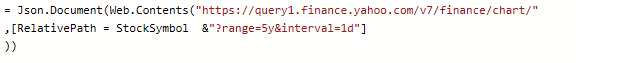
Make sure the brackets are correct. Here is the code you can copy and paste into the formula bar:
= Json.Document(
Web.Contents("https://query1.finance.yahoo.com/v8/finance/chart/"
,[RelativePath = StockSymbol  & "?range=5y&interval=1d"]
))
Now we have changed the URL, we need to make a change to the settings. This is because Power BI will try and check the base URL (https://query1.finance.yahoo.com/v8/finance/chart) before it runs the query and adds the second part in RelativePath. This isn’t a valid URL on its own, so it will fail.
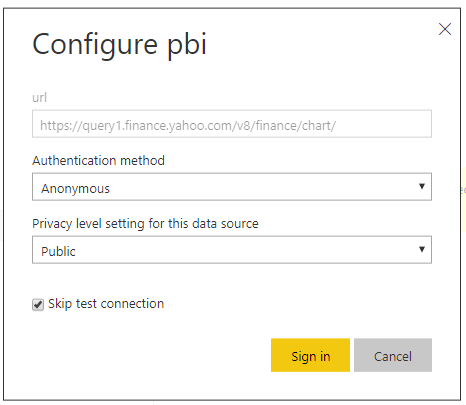
To do this, publish the report to the service, and Navigate to the dataset settings. This is found in the service by Clicking the ellipsis in the top right, then the option called Settings in the drop down.
You should be in the tab called Datasets. Then Navigate to the published dataset. Under the option titled Data source credentials, next to Web, Click the option to Edit Credentials. Make sure to check the option to Skip connection test.
If you are interested in learning more, check out Chris Webb’s blog on this here: Using The “Skip Test Connection” Option For Power BI Data Sources To Avoid Scheduled Refresh Failures
Creating the Function
This query uses a parameter which enables us to can convert it to a function. To do this, right click on the query in the Queries pane on the left and select make function.
Now we have a function where we can input any stock symbol and return a list of daily prices. To check multiple stocks, you can add your function to any list of stock symbols. This can be found in Add Column ribbon. Then Clicking the button Invoke Custom Function. This will return a table for each row. Before expanding, it is important to handle errors, otherwise it could break the query. One option is to Right Click the column header, and select the Replace Errors option, and Type the text null.
Performance Considerations
While this query will quickly return single stocks, adding multiple stock will send a different query for each stock. Make sure you design the correct solution to what you are trying to achieve, and check out this article on API considerations.
Final Result
For those who like M code, here is the final function. You can copy and paste this directly into the advanced editor (See this article on how to do this).
let
Source = Json.Document(Web.Contents("https://query1.finance.yahoo.com/v8/finance/chart/"
,[RelativePath = #"Stock Symbol" &"?range=5y&interval=1d"]
)),
chart = Source[chart],
result = chart[result],
result1 = result{0},
Branch = result1,
timestamp = Branch[timestamp],
#"Converted to Table" = Table.FromList(timestamp, Splitter.SplitByNothing(), null, null, ExtraValues.Error),
#"Added Index" = Table.AddIndexColumn(#"Converted to Table", "Index", 0, 1),
#"Added Custom" = Table.AddColumn(#"Added Index", "Date", each 25569 + ( [Column1]/60/60/24 )),
#"Removed Columns" = Table.RemoveColumns(#"Added Custom",{"Column1"}),
EndBranchDate = Table.Buffer(Table.TransformColumnTypes(#"Removed Columns",{{"Date", type date}}) ),
Custom1 = Branch,
indicators = Branch[indicators],
adjclose = indicators[adjclose],
adjclose1 = adjclose{0},
adjclose2 = adjclose1[adjclose],
#"Converted to Table1" = Table.FromList(adjclose2, Splitter.SplitByNothing(), null, null, ExtraValues.Error),
EndBranchPrice = Table.Buffer(Table.AddIndexColumn(#"Converted to Table1", "Index", 0, 1) ),
#"Merged Queries" = Table.NestedJoin(EndBranchPrice, {"Index"}, EndBranchDate, {"Index"}, "EndBranchPrice", JoinKind.Inner),
#"Expanded EndBranchPrice" = Table.ExpandTableColumn(#"Merged Queries", "EndBranchPrice", {"Date"}, {"Date"}),
#"Removed Columns1" = Table.RemoveColumns(#"Expanded EndBranchPrice",{"Index"})
in
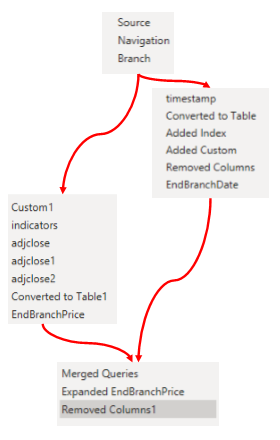
#"Removed Columns1"Visually splitting the steps, the query can be visualized like this:
If you like the content from PowerBI.Tips please follow us on all the social outlets to stay up to date on all the latest features and free tutorials. Subscribe to our YouTube Channel. Or follow us on the social channels, Twitter and LinkedIn where we will post all the announcements for new tutorials and content.
Introducing our PowerBI.tips SWAG store. Check out all the fun PowerBI.tips clothing and products:
