

This post will walk through how to pull an estimated household income from a US address. It will be completed all in the Power Query Editor. We will convert this to a function to reuse on any address we want.
This is the second part in a series on free API calls. The first part demonstrated how to pull daily stock price from Yahoo! Finance, which is available here.
Note: The content in this blog was first presented at the Power Platform Summit North America on October 18th, 2019.
Introduction to the Data
We cannot get exact income of a US address, but the US census releases data which is aggregated at different groups of households (called Geography Hierarchies).
There are different levels of Geography Hierarchies, explained on the census website. The lowest level of granularity available for this data is Block Groups. This is a small group of blocks, and usually consists of about a few hundred to over 1000 people. A block group is expressed as a code.
It is unlikely we will have the actual bock group code, but rather a street address. In order to retrieve information, we need to find which block group the address falls into. The first step is to convert the address into geographic coordinate, a process called Geocoding. You are probably familiar with using this feature – for example when you enter an address into a map app in order to get directions.
The census.gov website offer a free service to do this (US Census TIGER). However, in my experience the match rate (percentage of addresses geocoded) is not as good as some other services – this means that some of the addresses you enter will not be found. There are many other companies that offer Geocoding services, such as Bing, who often provide better match rates. However, these tend to come at a cost. These can be used instead, but for this example we will focus on the free US Census TIGER service.
Create an API Key
The first step will be to sign up for an API key from the census website. API keys allow organizations to monitor usage and can stop overloading their databases with requests. Some can be used to charge for paid API calls, however the census API is free and only requires an email address. If you do not work for an organization, you can write “none”.
Sign up here:
https://api.census.gov/data/key_signup.html
Storing the API Key
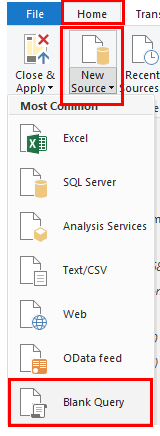
Back in Power BI, on the home tab in Power Query, click Home, New Source, Blank Query.
In the formula bar, Paste in the API key value you received. Rename the query to P_APIKEY.
This will store the API key so it can be changed, but will not set it as a parameter and require it to be entered by the user every time they use the function.
Setting up Parameters
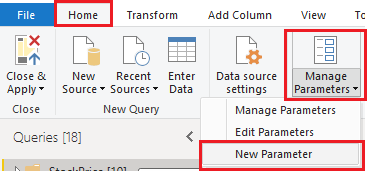
In the power query window, under the Home ribbon, Click the bottom half of the Manage Parameters button. From the drop down Select the option New Parameter.
Name the parameter P_Address. Change the Type field to Text. Enter 15010 NE 36th St in the Current Value input box.
Repeat this step 3 more times, so you will have 4 parameters in total. Use the below table for the names and default values:
| Name | Default Value |
| P_Address | 15010 NE 36th St |
| P_City | Redmond |
| P_State | WA |
| P_ZIP | 98052 |
Function Part 1: Geocoding
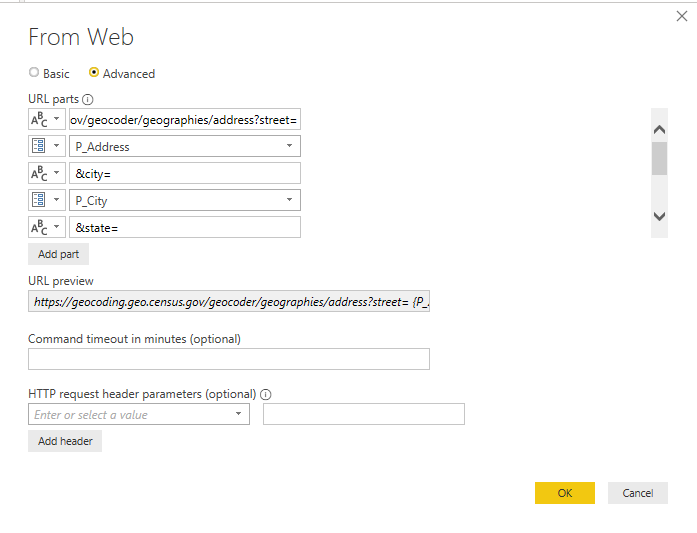
On the home tab, Click New Source > Web. Switch to the advanced tab, Then in the open dialogue box, first Click the button Add part. This will add a new box. Repeat this to add 9 web parts. Afterwards, locate the first window and Enter part 1 of the URL. In the second box, Change the abc symbol to a parameter. Fill in the boxes like below:
| 1 | https://geocoding.geo.census.gov/geocoder/geographies/address?street= |
| 2 | P_Address |
| 3 | &city= |
| 4 | P_City |
| 5 | &state= |
| 6 | P_State |
| 7 | &zip= |
| 8 | P_ZIP |
| 9 | &benchmark=Public_AR_Census2010&vintage=Census2010_Census2010&layers=13&format=json |
Note: Do not enter the rows that begin with P_ directly (rows 2,4,6,8). Switch the type to parameter and pick from the list.
This will return a result: Record. Click on the Record value to drill into it.
In the convert tab, click To Table to transform to a table.
We have extra information here, but we are only interested in the blockgroup data. Filter the column Name to include the following rows only:
“BLKGRP” , “COUNTY”, “STATE” , “TRACT”
(make sure you keep the correct columns with these exact names).
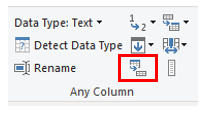
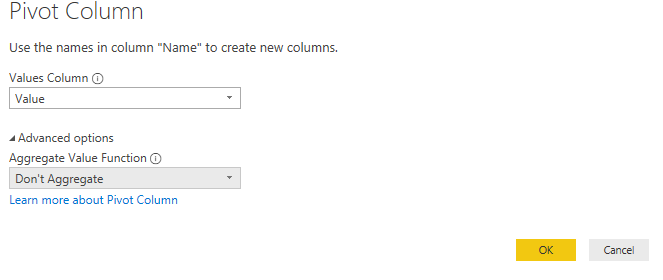
Now we have the correct columns, but for our function to waork we want them in one row. Highlight the Name column, navigate to the transform tabe and click Pivot Column. The symbol is:
Expand the Advanced Options, and change the Aggregate Value Function to Don’t Aggregate.
If you are following with the Microsoft head office, your data should look like this:
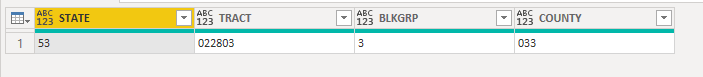
Now that we have the address geocoded, we can find out census information.
Function Part 2: Returning Household Income
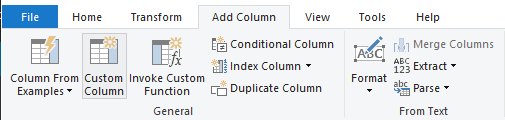
To add the second API call, we can take advantage of the custom column. It is actually possible to use Power Query (M) code in the custom column.
Click Add Column then Custom Column.
The code needed for the column is below. You can copy and paste this directly into the “Custom column formula” :
Json.Document(Web.Contents("https://api.census.gov/data/2018/pdb/blockgroup?get=Tot_Population_CEN_2010,avg_Agg_HH_INC_ACS_12_16&for=block%20group:" & [BLKGRP] & "&in=state:" & [STATE] & "%20county:" & [COUNTY] & "%20tract:" & [TRACT] & "&key=" & P_API))Breaking this code down:
– Json.Document tells Power BI the value being returned is in JSON format, and to decode this to a list
– Web.Contents will tell Power BI we are going to be sending a web (api) query
– https://api.census.gov/data/2018/pdb/blockgroup?get=Tot_Population_CEN_2010,avg_Agg_HH_INC_ACS_12_16 is our base URL will some parameters. The parameters we’re giving are to return population and average household income
-The second half of the URL takes in the location from the current row. anything in [Square Brackets] is a column. P_APIKEY is the parameter we set up earlier, that holds our API key
This will add a new column holding a list of lists. Click on the word list to drill into it
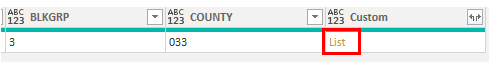
This will bring to the second level, two lists. Afterwards, Transform to a table by clicking on the “To Table” button in the ribbon, under list tools > Transform.
After it is in table format, we expand the values to take them out the list. The data has two lists, the first is the column headers and the second is the values, so we need to transform a little to see the data in a nice format.
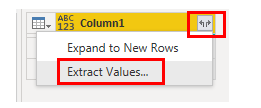
Firstly, expand the values by clicking the expand button and select Extract Values.
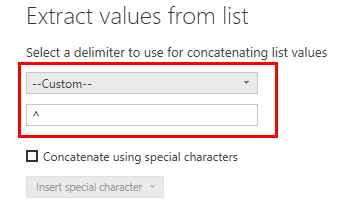
This will expand to one column, separated by a character of our choice. I’m going to use the carat symbol (^), as I’m confident this will not be a character already in the data. To do this, change the first box to –Custom– then type in the carat symbol.
After extracting the data from the lists, we can split it into columns. We will split on the delimiter we added, the carat symbol (^). Click on Home Tab, Split Column, By Delimiter.
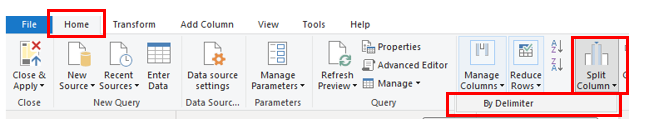
Same as before, change the first box to –Custom– then type in the carat symbol. Leave the default setting of “At each occurrence of the delimiter”.
Now it is split, promote the first row to headers by going to the Transform tab and use the “Use first row as headers”.
Finalizing the Function
As a result, this returns lots of columns. Highlight the Tot_Population_CEN_2010 and avg_Agg_HH_INC_ACS_12_16 column, right click and select “Remove other columns”.
Rename the two columns to “Population” and “Household Income” by double clicking the column header and typing the new name.
Finally, highlight both columns, enter the Transform tab and click “Detect Data Type” to convert the data type.
Optional: If you want to add the original address in, Click Add Column then Custom Column. Enter the below code, which will concatenate the address to one value. You can name the column Address.
P_Address & ", " & P_City & ", " & P_State & ", " & P_ZIP Creating the Function
This query uses a parameter which enables us to can convert it to a function. To do this, right click on the query in the Queries pane on the left and select make function.
Now we have a function where we can input any address and return the estimated household income, as well as population of this average is taken from(n value). To check multiple addresses, you can add your function to any list. This can be found in Add Column ribbon, then Clicking the button Invoke Custom Function. This will return a table for each row. Before expanding, it is important to handle errors, otherwise it could break the query. One option is to Right Click the column header, and select the Replace Errors option, and Type the text null.
Final Function
For those who like M code, here is the final function. You can copy and paste this directly into the advanced editor (See this article on how to do this).
let
    Source = (P_Address as any, P_City as any, P_State as any, P_ZIP as text) => let

            Source = Json.Document(Web.Contents("https://geocoding.geo.census.gov/geocoder/geographies/address?street=" & P_Address & "&city=" & P_City & "&state=" & P_State & "&zip=" & P_ZIP & "&benchmark=Public_AR_Census2010&vintage=Census2010_Census2010&layers=13&format=json")),
            result = Source[result],
            addressMatches = result[addressMatches],
            addressMatches1 = addressMatches{0},
            geographies = addressMatches1[geographies],
            #"Census Blocks" = geographies[Census Blocks],
            #"Census Blocks1" = #"Census Blocks"{0},
            #"Converted to Table" = Record.ToTable(#"Census Blocks1"),
        #"Filtered Rows1" = Table.SelectRows(#"Converted to Table", each ([Name] = "BLKGRP" or [Name] = "COUNTY" or [Name] = "STATE" or [Name] = "TRACT")),
            #"Filtered Rows" = Table.SelectRows(#"Filtered Rows1", each ([Name] = "BLKGRP" or [Name] = "COUNTY" or [Name] = "STATE" or [Name] = "TRACT")),
            #"Pivoted Column" = Table.Pivot(#"Filtered Rows", List.Distinct(#"Filtered Rows"[Name]), "Name", "Value"),
        #"Added Custom" = Table.AddColumn(#"Pivoted Column", "Custom", each Json.Document(Web.Contents("https://api.census.gov/data/2018/pdb/blockgroup?get=State_name,County_name,Tot_Population_CEN_2010,avg_Agg_HH_INC_ACS_12_16&for=block%20group:" & [BLKGRP] & "&in=state:" & [STATE] & "%20county:" & [COUNTY] & "%20tract:" & [TRACT] & "&key=" & P_APIKEY))),
        Custom = #"Added Custom"{0}[Custom],
        #"Converted to Table1" = Table.FromList(Custom, Splitter.SplitByNothing(), null, null, ExtraValues.Error),
        #"Extracted Values" = Table.TransformColumns(#"Converted to Table1", {"Column1", each Text.Combine(List.Transform(_, Text.From), "^"), type text}),
        #"Split Column by Delimiter" = Table.SplitColumn(#"Extracted Values", "Column1", Splitter.SplitTextByDelimiter("^", QuoteStyle.Csv), {"Column1.1", "Column1.2", "Column1.3", "Column1.4", "Column1.5", "Column1.6", "Column1.7", "Column1.8"}),
        #"Changed Type" = Table.TransformColumnTypes(#"Split Column by Delimiter",{{"Column1.1", type text}, {"Column1.2", type text}, {"Column1.3", type text}, {"Column1.4", type text}, {"Column1.5", type text}, {"Column1.6", type text}, {"Column1.7", type text}, {"Column1.8", type text}}),
        #"Promoted Headers" = Table.PromoteHeaders(#"Changed Type", [PromoteAllScalars=true]),
        #"Changed Type1" = Table.TransformColumnTypes(#"Promoted Headers",{{"State_name", type text}, {"County_name", type text}, {"Tot_Population_CEN_2010", Int64.Type}, {"avg_Agg_HH_INC_ACS_12_16", Currency.Type}, {"state", Int64.Type}, {"county", Int64.Type}, {"tract", Int64.Type}, {"block group", Int64.Type}}),
        #"Removed Other Columns" = Table.SelectColumns(#"Changed Type1",{"Tot_Population_CEN_2010", "avg_Agg_HH_INC_ACS_12_16"}),
        #"Renamed Columns" = Table.RenameColumns(#"Removed Other Columns",{{"Tot_Population_CEN_2010", "Population"}, {"avg_Agg_HH_INC_ACS_12_16", "Houshold Income"}})
    in
        #"Renamed Columns"
in
    Source
If you like the content from PowerBI.Tips please follow us on all the social outlets to stay up to date on all the latest features and free tutorials. Subscribe to our YouTube Channel. Or follow us on the social channels, Twitter and LinkedIn where we will post all the announcements for new tutorials and content.
Introducing our PowerBI.tips SWAG store. Check out all the fun PowerBI.tips clothing and products:
