
If you’re like me, building a data model in Power BI is an iterative process. Sometimes, you try out different ways of writing measures before you hit on the one that’s right. You end up with temporary measures that don’t actually end up being used in visuals. You may also pull in more columns than you might end up needing, just in case. The final result is your report masterpiece with measures and visuals, there are probably quite a few that you don’t need. Two problems with this are that having extraneous columns and measures (1) can slow down your model and (2) can make it more difficult to maintain. You may also want to know where on your report a change to a measure will have an impact.
The Solution
The problem this led me to was that I had no easy way of finding out where columns and measures were used in the visuals of reports. I could click on each separate visual to see what elements it used, but I couldn’t go the other way and click on a data element to see where it was used in visuals. In researching the existing Power BI utilities, I learned a lot about how to improve my data models, but I couldn’t find anything that provided the ability to find where exactly data elements were used in reports. So I decided to try to build one myself. Based on the incredibly informative blog posts of Gilbert Quevauilliers, Reza Rad, Jese Navaranjan, Imke Feldman, and David Eldersveld, among others, I was able to create a tool that met some of my needs. Hopefully it will help you, too!
You can download the Field Finder here:
If you are interested in contributing to enhanced versions of the Field Finder feel free to check it out on Github here: https://github.com/stephbruno/Power-BI-Field-Finder
The download contains both the pbix file and the template (pbit) file for you to use. Use the template if you want to just get started and use the tool as-is. To see how it works, or make some tweaks of your own, use the pbix file.
Setting up the Field Finder
1. Double-click the Power BI Field Finder.pbit file wherever you downloaded it.
2. After the file opens, you’ll be prompted to enter a value for the input parameter. This is the complete file path and name of the pbix file you’d like to analyze. (thanks to Marco Russo, you no longer need to have your source file unzipped!)
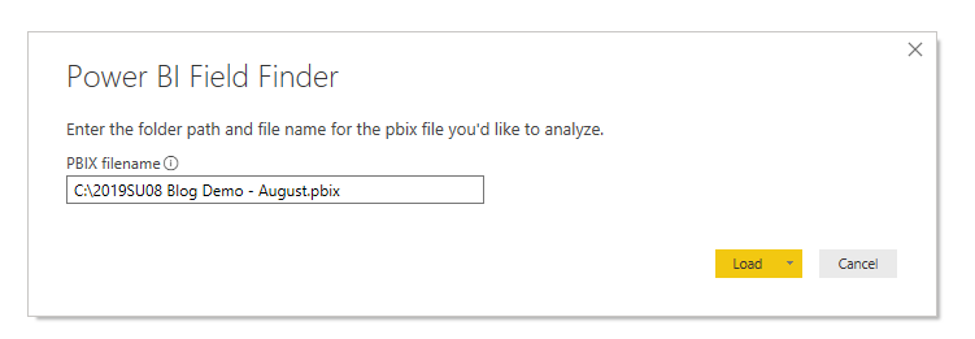
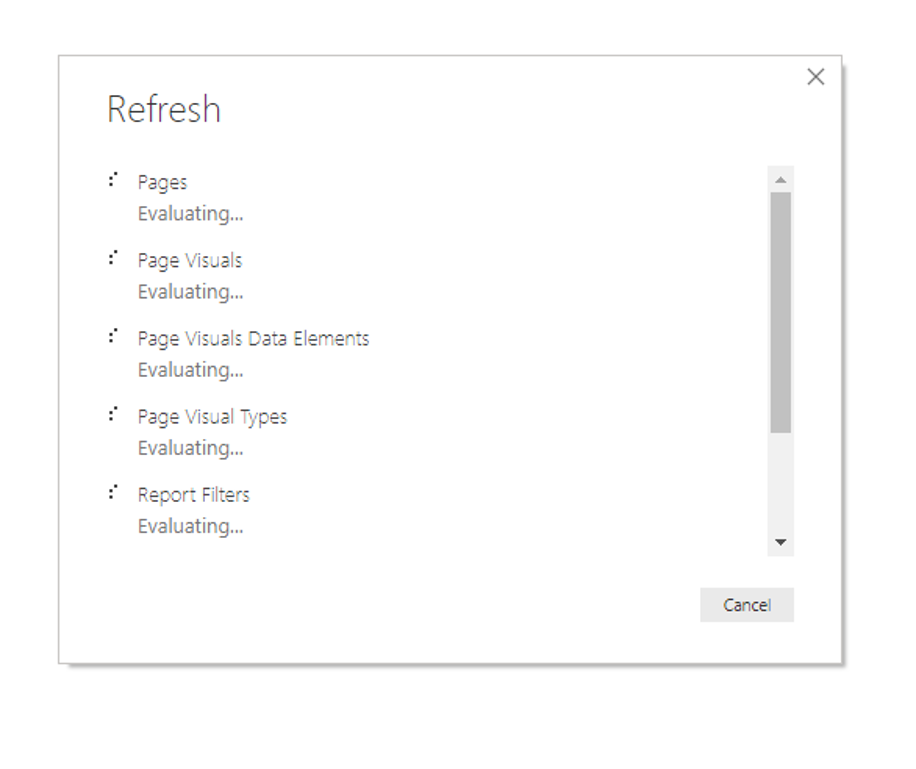
3. Click the Load button. The file will start importing the layout information for your file.
Field Finder Contents
4. After loading the information, you’ll see four tabs.
- The first tab (Instructions) provides basic information and instructions.
- The second tab (Columns and Measures) provides an overview of all pages of your report
- The third tab (Page Details) provides more detail on each page of your report
- The fourth tab (Helpful Resources) includes links of blog posts I used to make the tool
Columns and Measures
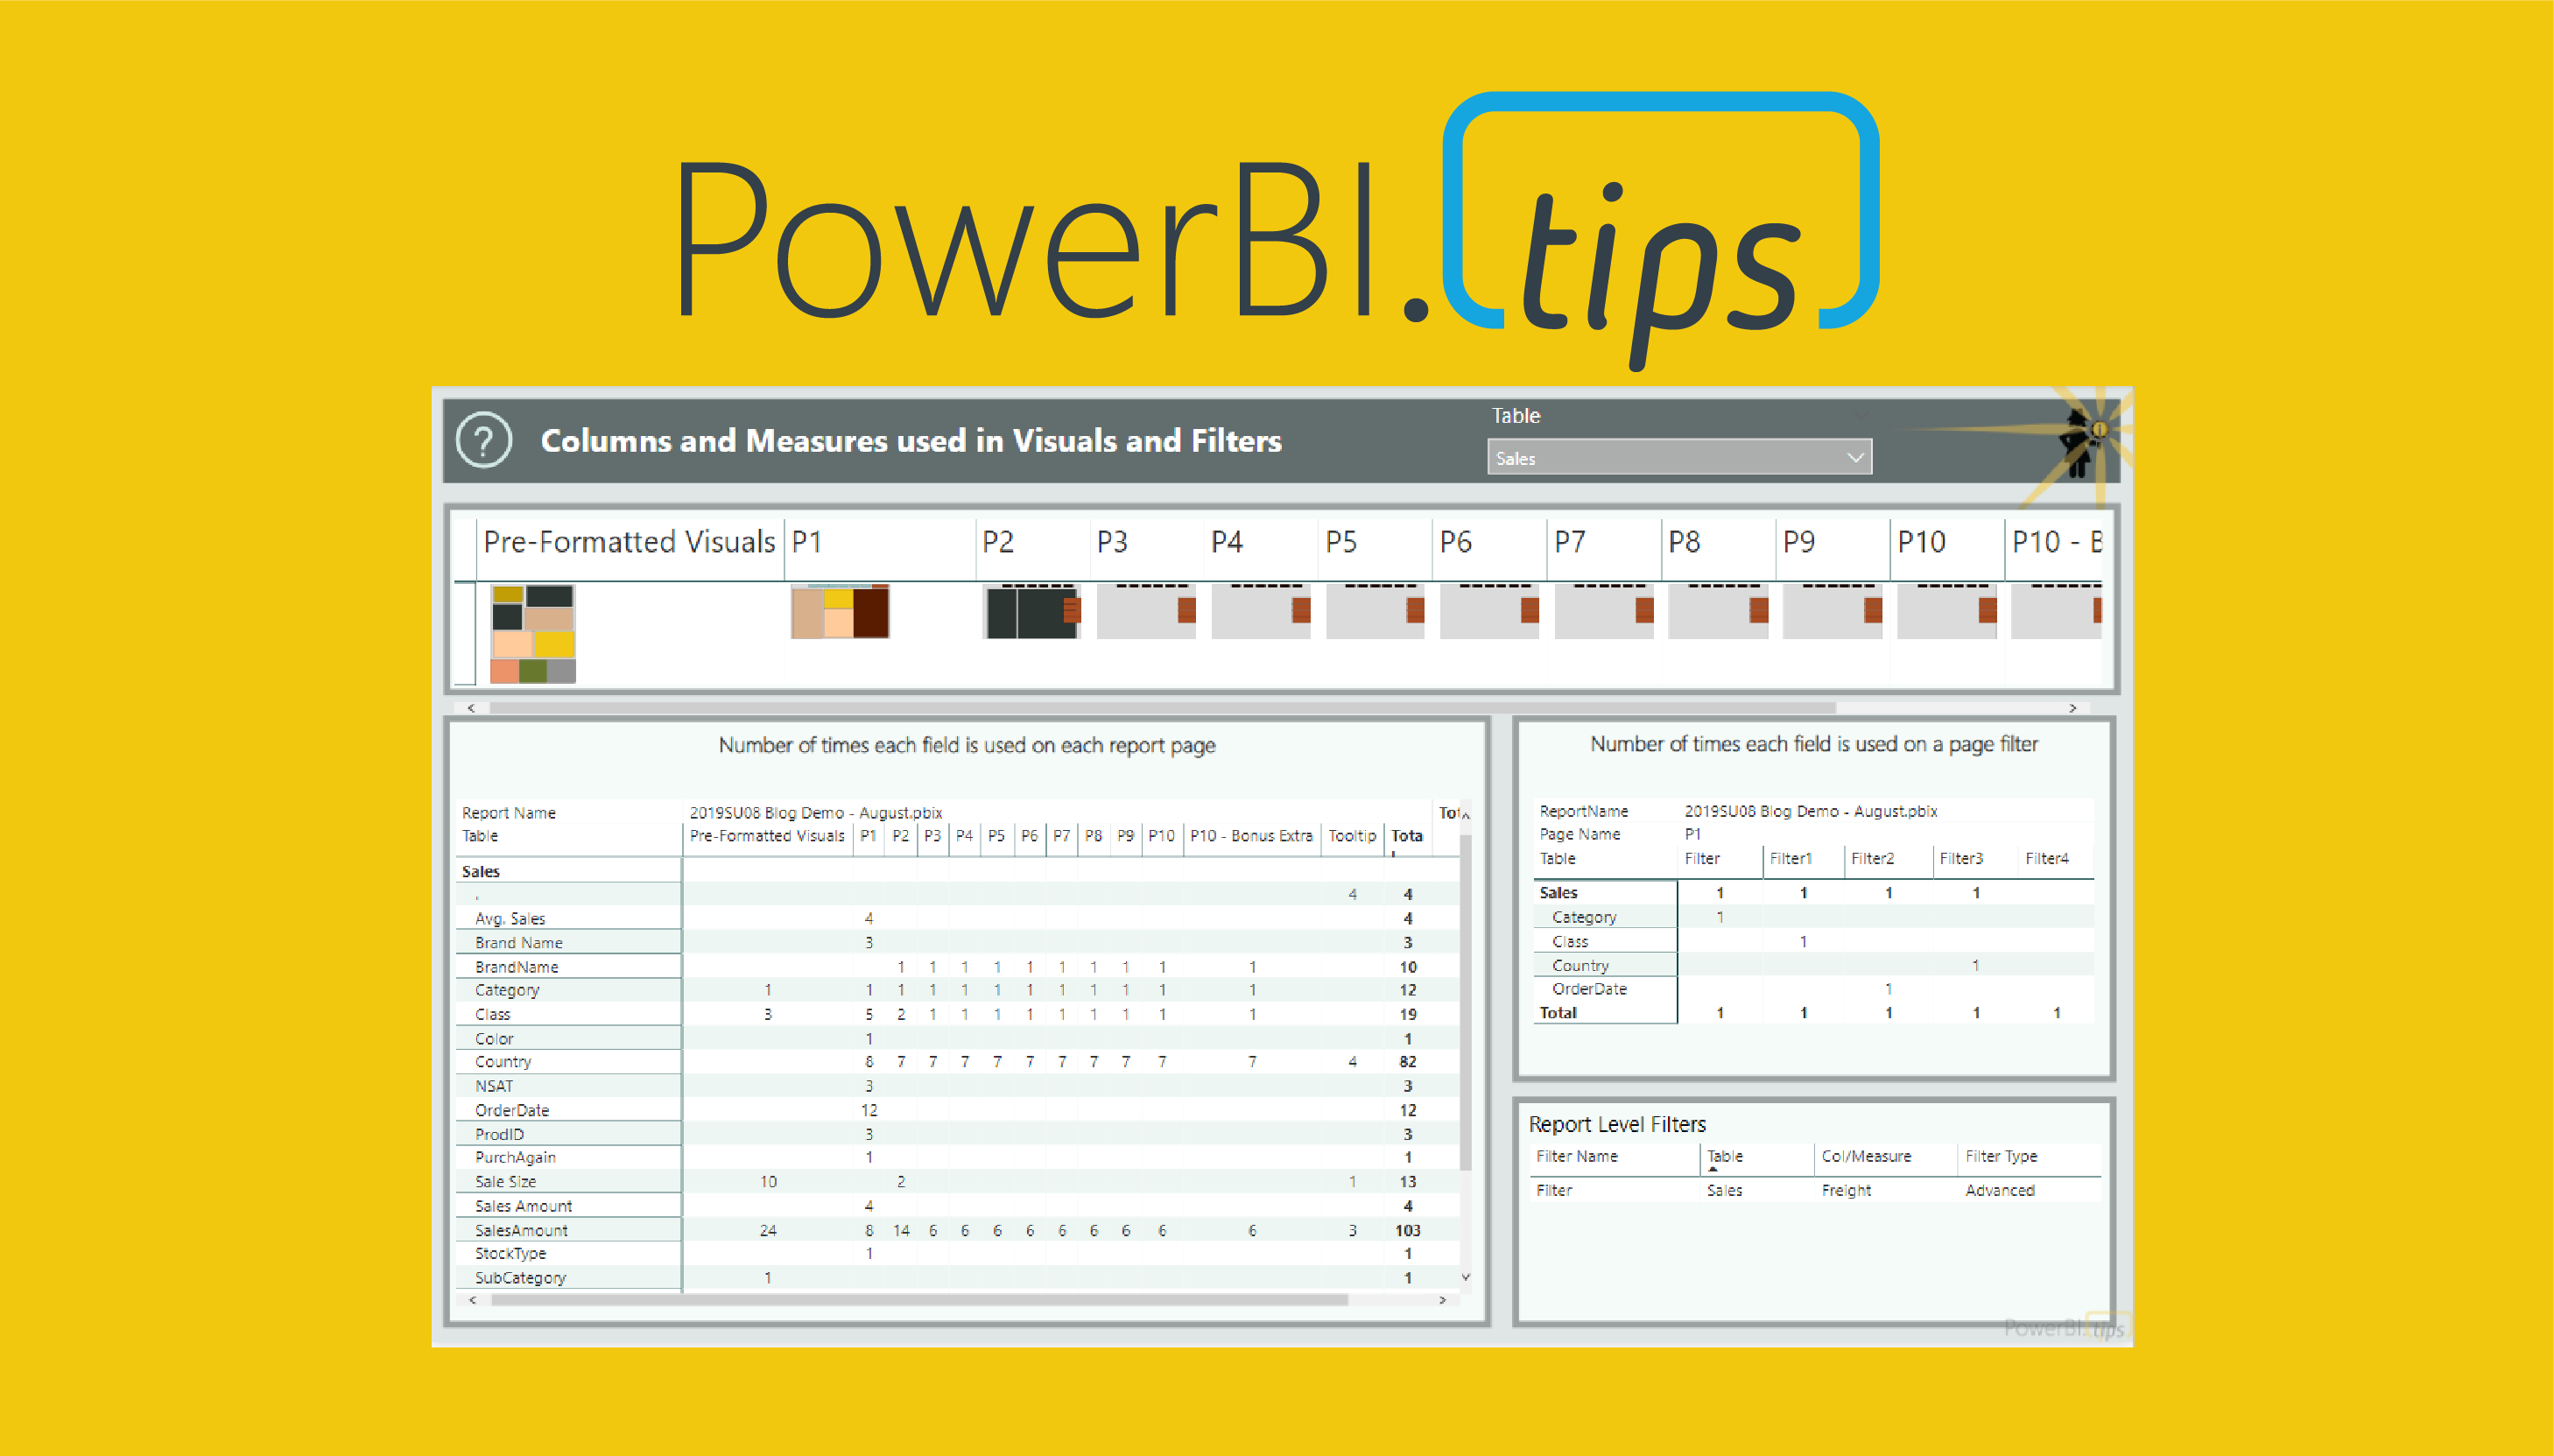
5. Let’s look at the Columns and Measures tab
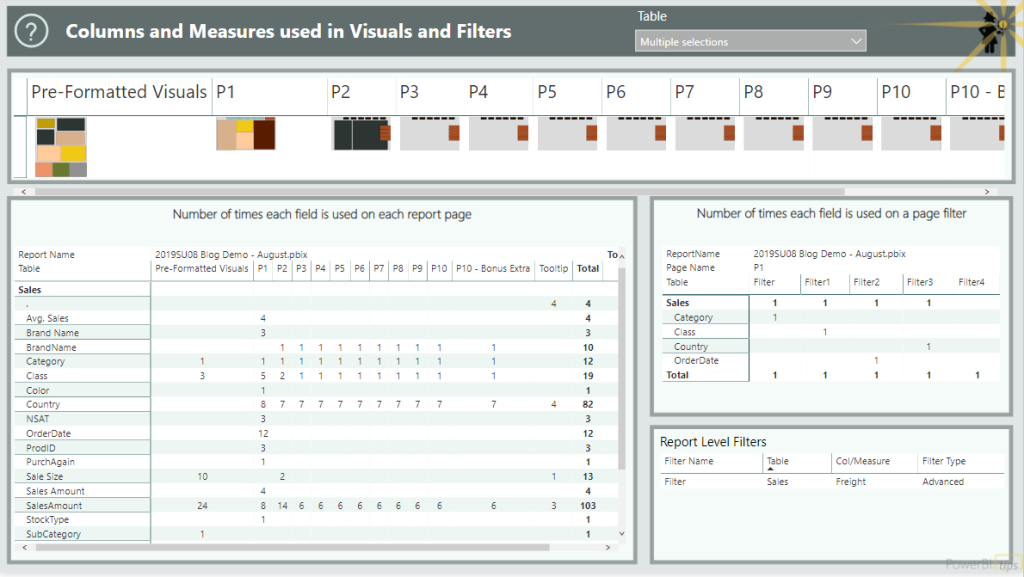
On this tab, you get a thumbnail along the top of each of the pages in your report. The types of visuals are color coded and the name of the page is above the thumbnail. The table on the bottom left gives you the number of times each column or measure is used on each page of the report. On the right you will see the page level and report level filters using columns and measures.
Clicking on the thumbnail of a page will filter the tables below to show you exactly which elements are used on that page. Similarly, by clicking on a column or measure name values in the tables will cross-filter the thumbnails above. This lets you quickly see which pages it’s used on. For example, clicking Units from the Sales table in the bottom left shows that it’s used in the Pre-Formatted Visuals, P2, and Tooltip pages. The thumbnails cross-filter to just those pages.
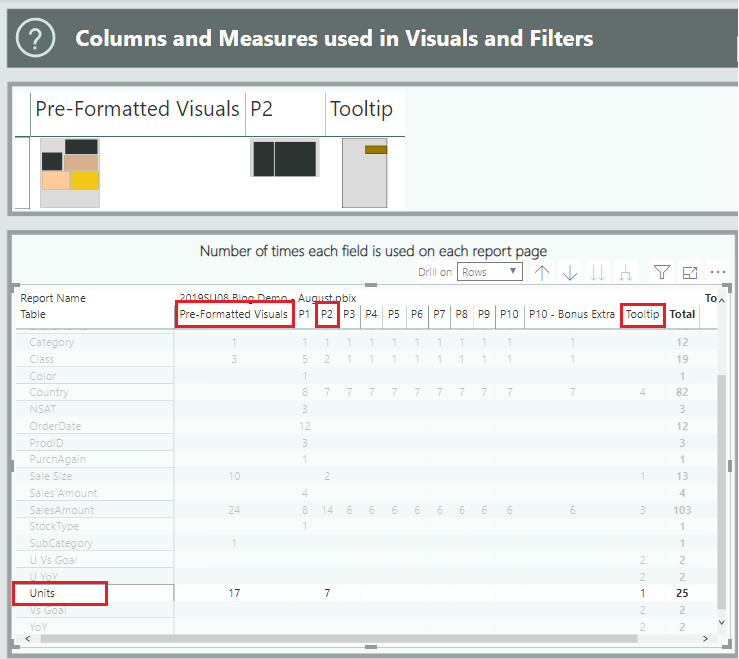
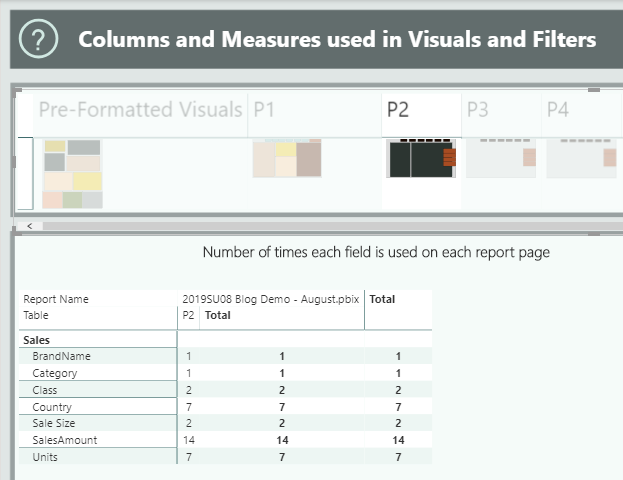
Or, clicking on just thumbnail for P2, you can see which columns and measures are used on the entire page.
Page Details
6. For more detail on a specific page, click on the “Page Details” tab.
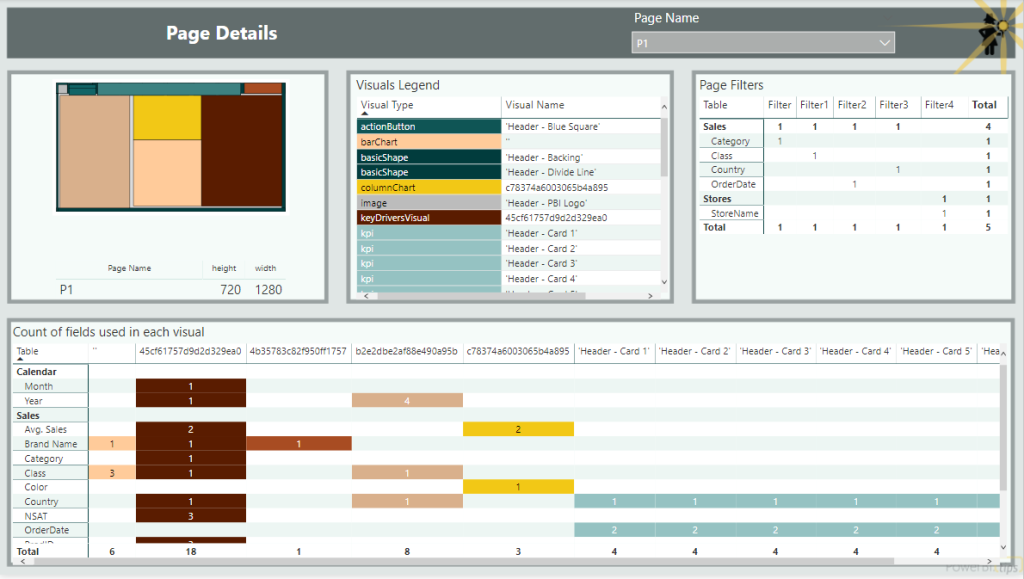
The Page Details tab provides a bigger image of the visuals on the page, and includes more details on the types of visuals and what they’re using. You can select one of your pages with the slicer on the left. The Visuals Legend provides a color code of the type of visual used and the name of the visual. If you haven’t updated the name of your visual in the Selection Pane of your pbix file, you’ll get one of these long strings for the visual name that isn’t very helpful. In addition, you will also see the list of all the columns and measures used in the visuals as well as any page level filters.
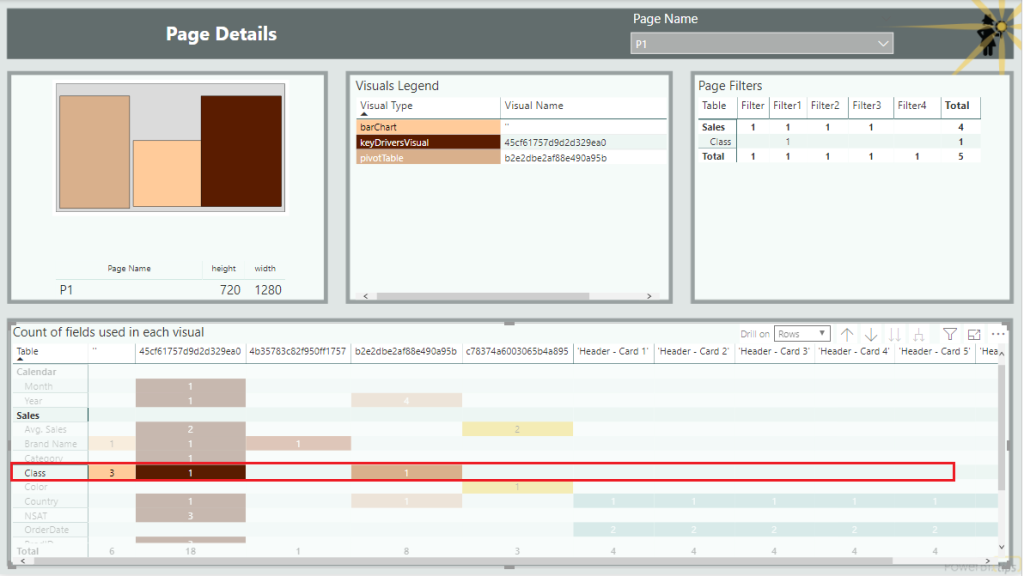
For example, by clicking on Class in the table in the bottom right, can see at a glance where it’s used on the page. The image of the page also makes it easy for me to go to my pbix file and find exactly which visuals it’s used on.
7. If you make changes to your source pbix file, just save it and then refresh the Field Finder to get your updates.
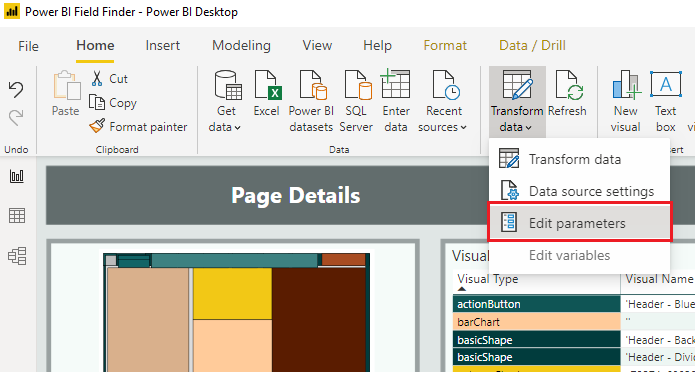
8. If you want to examine a different pbix file, all you need to do is change the parameter for the file name and path. To do that, go to Transform data – Edit parameters and enter the path and name of the next file you want to look at.
I hope you find the Field Finder useful. Please let me know if you have any suggestions for future versions.
Many thanks to Seth and Mike of powerbi.tips for creating the improved visual layout of the Field Finder!