Category: Sharing & Administration

  • Overcoming Challenges in the Center of Excellence

    Overcoming Challenges in the Center of Excellence

    Starting a center of excellence (COE) can feel daunting. We face political challenges. This article pushes to explore the challenges of a COE and some recommendations to handle these challenges.

    The Importance of Attention to Detail

    Microsoft does a great job in outlining the key aspects of COE. For more details on this topic check out the Fabric adoption roadmap found here. A summary of those items are in the list below:

    I strongly feel that documenting the result of these conversations is a huge win. The documentation can be used to show leadership that you have a solid plan. Discussing these topics pushes towards a health data culture. Lastly, when you bring documentation to leadership you show thought of aspects that drive success.

    Foundational Attributes for Success

    The optics of the COE matter. COE performance and leadership are crucial, as they can impact the entire organization. Don’t underestimate the value of setting clear goals. Taking time to identify pain points with your current organization structure help with planning process for the COE.

    • Setting clear goals
    • Addressing pain points that you see, plan to solve those pain points
    • Just start, don’t worry about making the COE perfect, plan for adjustments

    Sometimes I feel that people try to over plan. Therefore, read up on the best practices provided by Microsoft’s documentation, write down your decisions then get moving! I have observed just by communicating and developing the plan really creates some momentum. Bear in mind it won’t be perfect in the first iteration. Plan on being flexible to adjust the COE to the organizations needs.

    Recommendations for Overcoming Challenges

    • Attention to Detail: Paying attention to aspect you can control of the COE’s performance. Engage leadership so they support the development of the COE. Remember the COE is a vote in the direction of better data culture for your company.
    • Setting Clear Goals: Defining clear goals helps the team align towards a unified direction. Address pain points that could derail or distract from the creation of the COE. Connect the success of the COE to Objectives and Key Results (OKRs) outlined by the leadership team.
    • Regular Communication with Executives: Regular communication with the executive team helps remove mis-aligned expectations. When you win let leadership know, they can promote your success. Success means more buy-in from the company.
    • Feedback: Gathering feedback and pivot. Have empath for the process and be willing to adjust. If something is not working within the COE try something new. Ask others involved in the COE for recommendations, some of the smartest people are the ones you already work with.

    For more thoughts on the COE and overcoming those challenges check out our episode on the explicit measures podcast.

  • Does a Power BI developer need Python?

    Does a Power BI developer need Python?

    In this episode of the Explicit Measures Podcast, we discuss the values of adding Python knowledge. It is well known that more organizations are moving to cloud platforms. Because of this, we should ask the following questions:

    • What will be the needed skills for Power BI professionals?
    • Is this for the Business or for a Data Engineer?

    We invite you to jump in and listen to the podcast as we discuss these topics. Enjoy!

    YouTube Explicit Measures Podcast

    Listen on the go

    Don’t want to watch the video, no problem we are on all major podcast platforms.
    Spotify
    Apple Podcasts
    iHeart Radio

    Ask Chat GPT

    As in all our episodes we like to end with what does chat GPT say. Thus, our question for this episode is

    Should I learn Python for Power BI development?

    Chat GPT response

    The response was quite interesting, discussing the various factors as to why Python is valuable. Overall, we gave chat GPT a better than average score of about 6.5 out of 7.

    Learning Python can be beneficial for Power BI development. Python is a versatile programming language that is widely used in data analysis, data manipulation, and data visualization tasks. Power BI has its own built-in capabilities for data processing and visualization. Python can extend its functionality and provide additional flexibility.

    Here are a few reasons why learning Python for Power BI development can be advantageous:

    Data Manipulation

    Python has a rich ecosystem of libraries such as Pandas, NumPy, and scikit-learn. These libraries are excellent for data manipulation, cleaning, and transformation. Use Python to preprocess and shape your data before loading it into Power BI.

    Advanced Analytics

    Python offers a range of libraries for advanced analytics and machine learning, such as TensorFlow, Keras, and PyTorch. Integrating Python code into Power BI, you can leverage these libraries to perform complex calculations. Additional features could include predictive modeling, or create custom machine learning models to enhance your data analysis capabilities.

    Custom Visualizations

    Power BI provides a variety of built-in visualizations. But, if you have specific visualization requirements or want to create custom charts. Python can be a powerful tool for visual development. Libraries like Matplotlib and Seaborn offer extensive options for data visualization. Enabling you to generate interactive and customized charts and graphs to present your insights effectively.

    Automation and Integration

    Python can help automate repetitive tasks and streamline your Power BI workflows. You can write Python scripts to extract data from different sources, transform it, and load it into Power BI automatically. Python’s integration capabilities enables connections with other tools and platforms, such as web APIs, databases, or cloud services. Python expands the scope of your data analysis.

    Community Support

    Python has a large and active community, with abundant resources, tutorials, and forums available. Learning Python can provide you with access to a wealth of knowledge and expertise. A Large community makes it easier to find solutions to specific challenges.

    In conclusion, while it is not necessary to learn Python for Power BI development. It can certainly enhance your capabilities and offer more flexibility in data manipulation, advanced analytics, custom visualizations, and automation. Consider your specific requirements and goals for a project. Your project requirements may determine whether investing time in learning Python would be beneficial.

    Chat GPT – May 12 Version

    Not bad Chat GPT. I would disagree with a couple points made on how easy it is to integrate python into Power BI. Two options I am aware of today using Python in Power Query.

    Option 1 – Using Python in Power Query

    Using Python in Power Query from Microsoft Learn

    Option 2 – Using Python for Visuals

    Using Python to develop a Visual

    I feel that more of python is used in cloud services. This was a major point brought by Seth in the podcast. Very valid point.

    Overall, we hope you enjoyed the podcast! See you next time.

    Buy some fun Swag

  • PowerBI Tips Theme Generator: The Ultimate Tool for Creating Complex Themes

    PowerBI Tips Theme Generator: The Ultimate Tool for Creating Complex Themes

    Power BI is a powerful business intelligence tool that helps organizations to gain insights into their data. With its ability to create stunning visualizations, it’s no wonder that it’s become a popular tool among businesses. However, creating the perfect visualization requires more than just dragging and dropping data points onto a canvas. It requires a good understanding of design principles and a keen eye for detail. The time it takes to create a visual can be drastically reduced if a Theme is used.

    Themes make it so that all that time you spend tweaking colors, fonts and properties becomes a standard file template. That theme file template can get re-used over and over in all your reports saving an immense amount of time. The only roadblock to creating a theme, is that it is a complex developer level driven task. It requires a creator to understand how to properly construct a complex JSON file.

    PowerBI Tips Theme Generator Updates

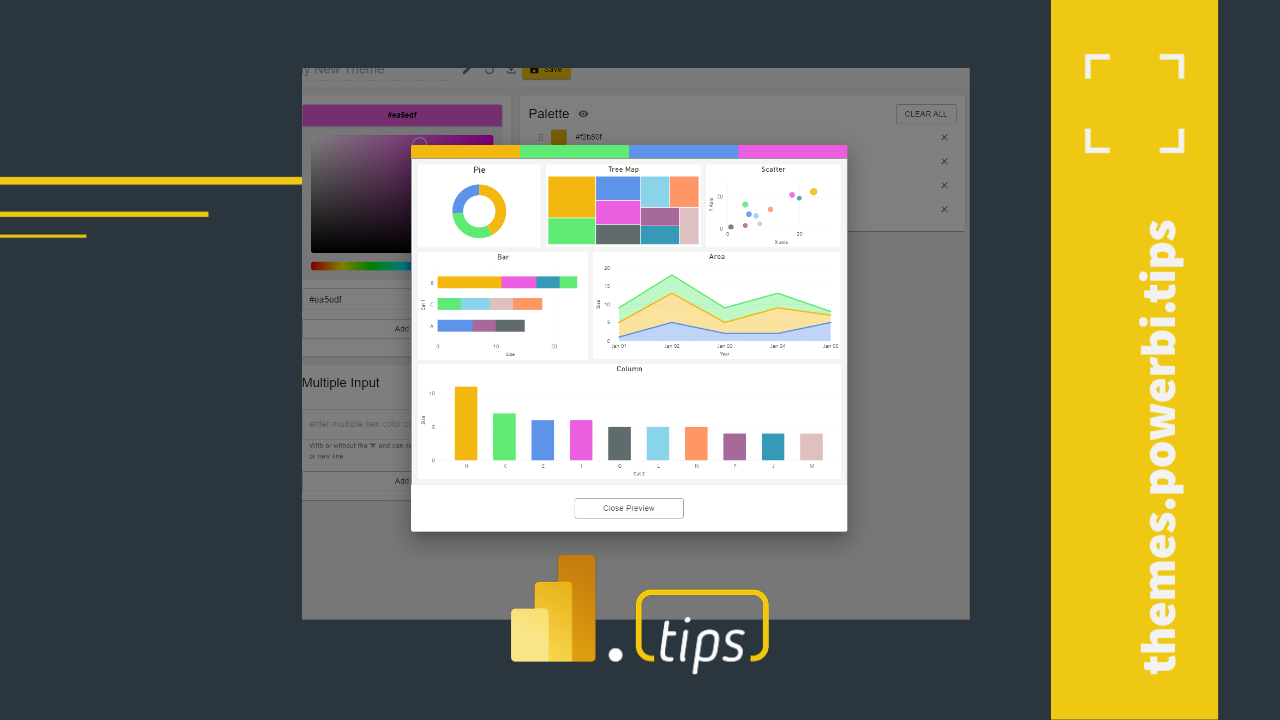
    That’s where the Power BI Tips Theme Generator comes in. This powerful tool has simplified the process of creating complex theme files. It provides an intuitive user interface that makes it easy to customize every aspect of your visualizations all at once. The tool remains free! However, included with our latest update, users can now save their theme files via a subscription service! This is the only tool on the market that solves all these critical needs for you and lets you easily access and modify them. Whether you’re creating reports, dashboards, or scorecards, this tool has everything you need to create the perfect visual theme file template.

    The Power BI Tips Theme Generator now supports all the properties found in the new Microsoft schema. Moreover, it also ensures that the theme file aligns to the new validation rules. In February 2023, Microsoft released a new version of Themes validation. They understood the complexity of creating files, and this change ensures that the files uploaded match exactly to their specifications. However, this caused quite a few problems for users that didn’t have valid files (see video below). This validation is great for the Power BI, except that it creates a bigger hurdle for users. Everyone wants the benefit of Themes, without the challenge of having to create one.

    (UPDATE!): Be sure to check out all the additional features we’ve included (Upload existing files, Code Editor, Icons & more! New Theme Generator Updates

    Why You Should Use the PowerBI Tips Theme Generator

    One of the biggest benefits of the PowerBI Tips Theme Generator is its ability to simplify the user experience. By providing a comprehensive tool that creates theme files automatically, users can focus on what they do best – analyzing data. With its intuitive interface and powerful features, the PowerBI Tips Theme Generator has become a must-have tool for any business that wants to create stunning visualizations consistently without spending countless hours tweaking every detail every single time.

    If you’re looking for a powerful tool to help you create the perfect visualization theme file, the PowerBI Tips Theme Generator is the only tool you need. With its comprehensive feature set, intuitive user interface, and ability to save theme files via subscription service, it’s the ultimate tool for businesses and users that want to create stunning visualizations with ease. So why wait? Try the PowerBI Tips Theme Generator today and take your visualizations to the next level!

    Here is how you can get started!

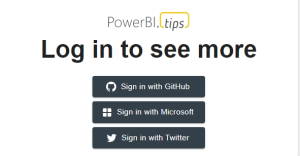
    Sign Up

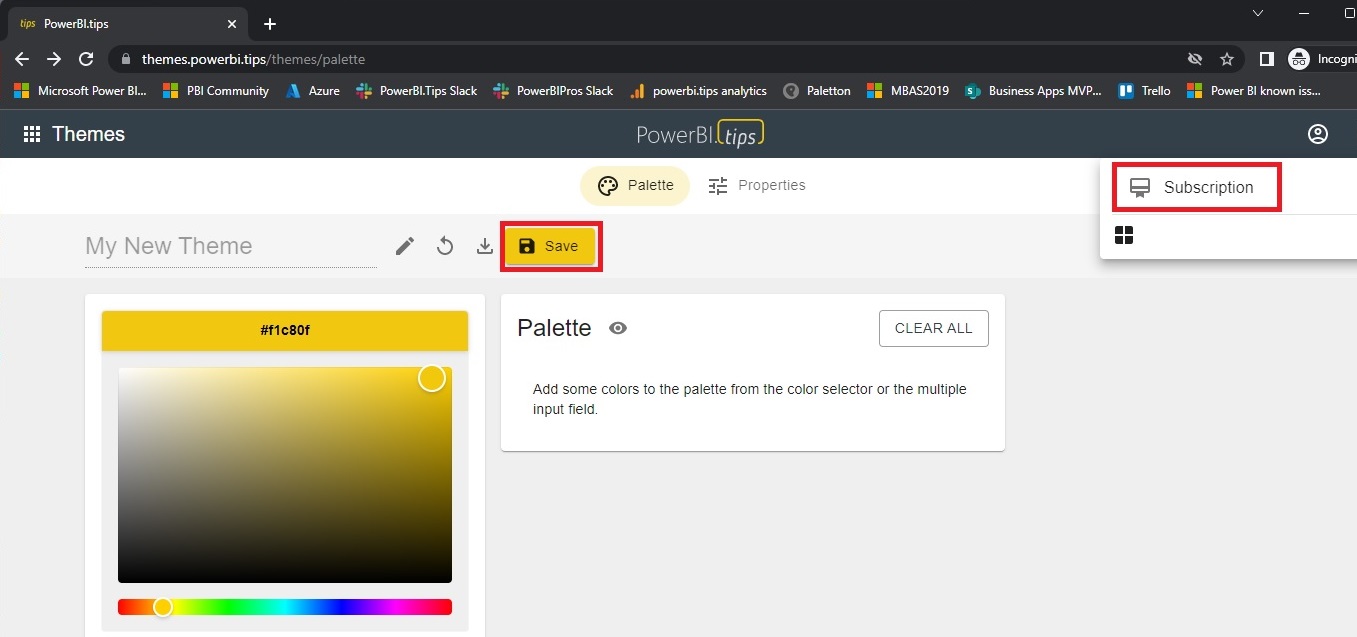
    Click on Save Or Subscribe

    Choose your level

    Full walkthrough of the additional subscription features!

    Explicit Measures Podcast on the importance of Power BI Themes!

    If you like the content from PowerBI.Tips please follow us on all the social outlets. Stay up to date on all the latest features and free tutorials.  Subscribe to our YouTube Channel.  Or follow us on the social channels, Twitter and LinkedIn where we will post all the announcements for new tutorials and content.

    Introducing our PowerBI.tips SWAG store. Check out all the fun PowerBI.tips clothing and products:

    Check out the new Merch!

    Hasta La Vista Data
    Go Ahead Make My Data
    PBIX Hat


  • Welcome to Community Jam

    Welcome to Community Jam

    PowerBI.Tips LOVES community. And we are out to prove it.

    We are so proud to announce Community Jam by PowerBI.Tips, the all-inclusive, resource driven, and COMMUNITY led learning tool for members of the Power BI Community. Today is our first step – there is so much more to come.

    What is Community Jam

    Community Jam is the one-stop shop for what is important in the Power BI community and keeping up with the latest news. As of launch today, there are three main areas of Community Jam: Release Plan, Power BI Ideas, and Bookmarks.

    Release Plan

    We have incorporated Alex Power’s Power BI Release Plan app into Community Jam, allowing you to see what is on the roadmap for MIcrosoft releases around Power BI.

    Power BI Ideas

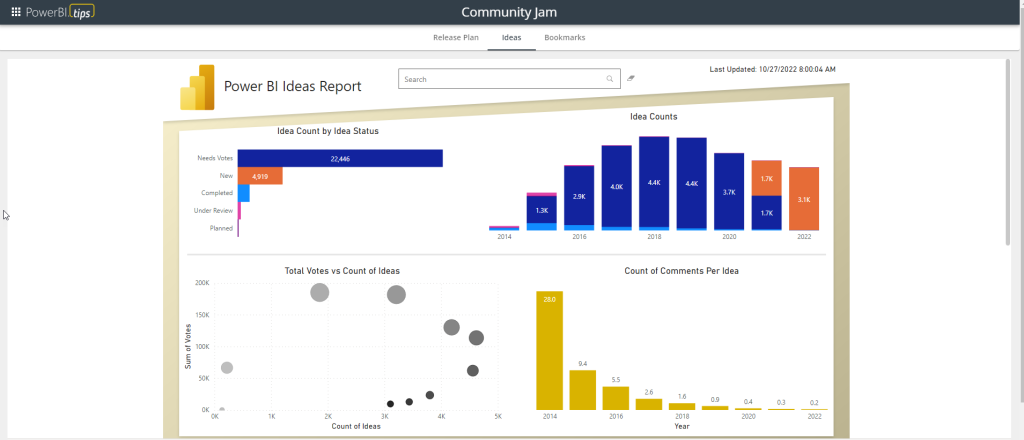
    Mike Carlo has done an incredible job feeding in all of the ideas on ideas.powerbi.com, allow you to easily search, find, and vote for new and hot ideas that should be part of the next wave and future of Power BI features.

    Ideas on Community Jam

    Bookmarks

    This is a cool one. Working with Tommy Puglia, the PowerBI.Tips team has now over 6,000 articles from across the Power BI community of authors and bloggers that you can use as your own knowledge center. Using the bookmarking service Raindrop.io, any new articles, videos, and resources that touch Power BI are saved here.

    Bookmarks in Community Jam – Your Go-To Resource Toolbox

    I want to talk more about the bookmarking feature here. I have been using Raindrop.io for over 3 years to save any relevant article posted around Power BI. With a combination of RSS feeds, Twitter links, and email subscriptions, a ridiculous amount of articles have been written around the how-to’s, what, and did you know in Power BI.

    Tips & Tricks

    You can either browse through the latest articles in the Community Jam website or go to the dedicated Raindrop page. On the Embed page, if you have a raindrop account, you can save articles to your own Raindrop service, or simply read the new articles within Community Jam.

    Use the “more” button to go to page on Power BI that really opens up the amazing features of Community Jam Bookmarks.

    find articles based on nested collections

    Nested-Collections

    Community Jam Bookmarks have nested collections that allow you to further refine the articles. Simply by choosing on the top of the page, you can fine focused articles (new and old) around Community, Power Query, DAX, Admin, or Data Visualization with just one click.

    DAX nested collection

    The top right has a search bar that will allows you to choose based on tags (more to come here) or by your own search. Not only will it search title and description, but Raindrop allows you to search the content of the article as well!

    Search in Community Jam Bookmarks

    Want to learn about variables in DAX? Use nested collections and search, and you got 235 articles to read up on.

    Need to read up on Power Query? How about 917 articles?

    Admin & Governance? 500+.

    What about Tabular Editor 3? 50 focused articles.

    How about Charticulator? 28 dedicated resources.

    Power BI Goals? We got 56 for you.

    The search feature is INCREDIBLE. We have more plans here to include a tagging system (using the # which you can see on the search page) that will further help you find the right resources.

    And More Resources

    Get your favorite PowerBI.tips resources using the app pane in the top left of Community Jam, including the Theme Editor, Charts, DAX Templates and more. Also, you can find the podcast and all training here too!

    Why Community Jam.

    We cannot stress this enough. This is just the beginning of what we see as what should be a central area for Power BI fans to learn and grow within the community.

    Community Jam is for users, for the community, by the community. Empower and grow, network and learn – Community Jam is ready to go!

    If you like the content from PowerBI.Tips please follow us on all the social outlets. Stay up to date on all the latest features and free tutorials.  Subscribe to our YouTube Channel.  Or follow us on the social channels, Twitter and LinkedIn where we will post all the announcements for new tutorials and content.

    Introducing our PowerBI.tips SWAG store. Check out all the fun PowerBI.tips clothing and products:

    Check out the new Merch!

    Hasta La Vista Data
    Go Ahead Make My Data
    PBIX Hat


  • Super Fast Data Loads to Prod

    Super Fast Data Loads to Prod

    When you have really large data models loaded in powerbi.com there are challenges around quickly loading gigs of data into a data model. This is particularly challenging when working with data models in production. When changes are made which require a full load of data tables this can take hours to refresh. This means when a production change needs to be made, this should be done in low use times, evenings or over the weekend. What if we could greatly increase the load speed? but, we can!!

    TL/DR

    Let us cut to the chase. How do we solve this issue? We use Power BI backups with Azure blob storage. This feature can be found here on the official Microsoft Documentation.

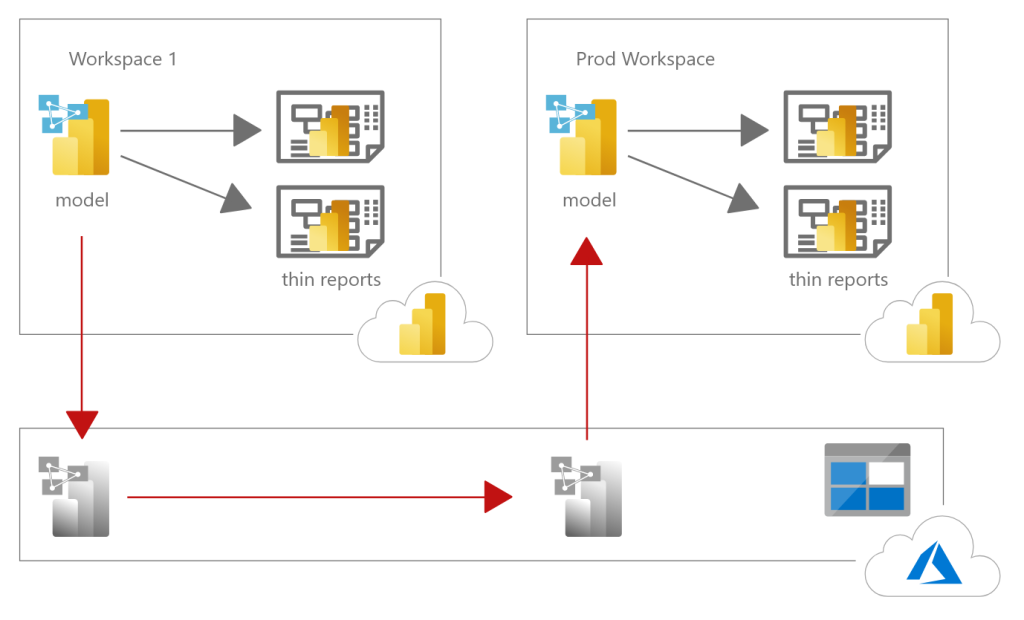
    Below is a high level architecture and movement of the Power BI data models across the blob storage account.

    The Solution

    The high level solution goes something like this:

    1. Create two workspaces, one in prod and one for pre-loading data
    2. Connect both workspaces to premium
    3. Turn both premium capacities to large dataset capacities
    4. Link azure storage to both workspaces
    5. Publish a modified data model into the pre-load workspace, this contains the changes to the data model.
    6. kick off a full load of the data model in the pre-load workspace
    7. Open SSMS connect to the backup the pre-load workspace XMLA endpoint
    8. Backup the pre-loaded model to azure blob storage using SSMS
    9. Open azure bob storage, copy and paste the .abf file into the prod workspace
    10. Use SSMS to connect to the prod workspace XMLA endpoint
    11. Use the restore feature from SSMS to load the .abf file back into the model in production

    Instructions

    Below are the step by step instructions as show throughout the experience.

    When you link your Power BI workspaces you will see inside the Blob storage a folder for powerbi and another folder for power-bi-backup. Note, it is important that both workspaces the pre-loading data workspace and the prod workspace point to the same blob storage account.

    For each workspace PowerBI.com will create a single folder for each workspace. See below we have two workspaces for this demo.

    We can use the XMLA endpoint found in the workspace settings to connect and see the partitions within our data model. For this example we have a pre-loaded dataset called nyctaxi. This dataset was deployed into a workspace and fully refreshed loading all the data into all the partitions.

    Below is a the same dataset, with the exception there are no partitions preloaded. We assume we are going to use the backup created from the above dataset and then load the partitions into the Prod model.

    Note: in this example we are pushing all the partitions and all data in the partitions into production. Usually your production model will already have partitions. Thus, it is easier to show our model adding partitions for this demo. If you really want to confirm the data is correctly being restored from backups you would look at the row counts found in each partition.

    Here we log into the pre-loaded data set using SSMS.

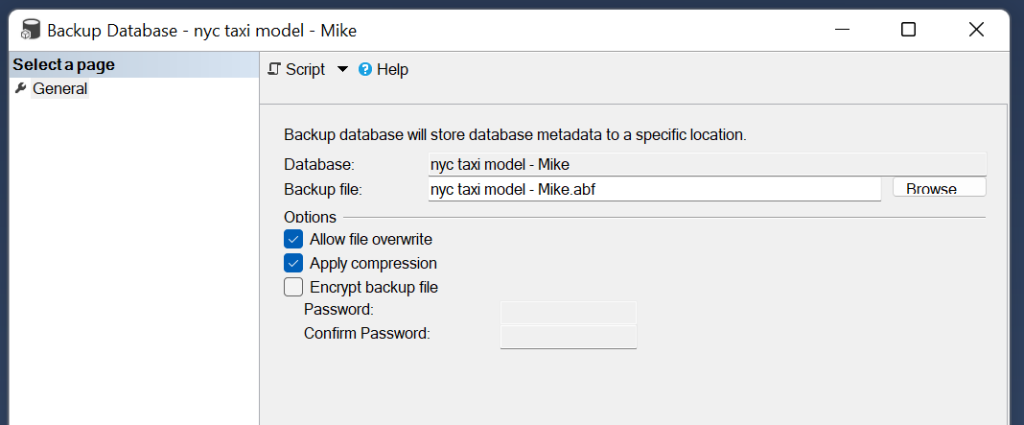
    Right Click on the data model that you are going to backup. Select the option labeled Back Up… in the drop down menu.

    After clicking Back Up… a menu will appear letting you to name the backup file.

    It is recommended to allow the file to be overwritten and to apply compression to the files. Once your settings have been configured, then you can Click the OK button at the bottom of the window to accept the changes.

    After the backup completes we will be able to see the .abf file inside the blob storage folder.

    Using the copy and paste buttons form the azure portal you move the files between the workspace folders.

    Below is the copied model .abf file from the demo-synapse (pre-loaded data) into the Prod workspace named (Demo – Test Models).

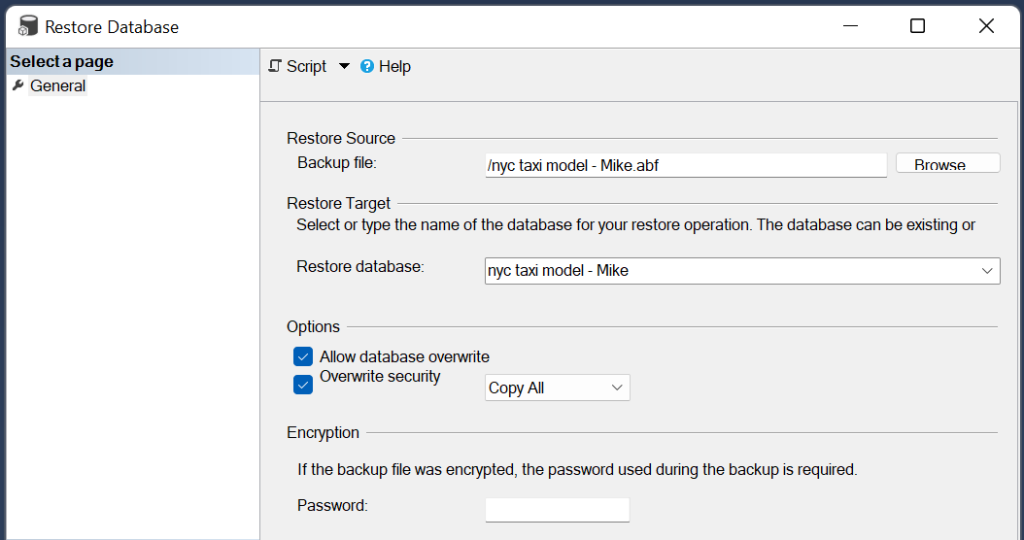
    In SSMS we connect to the production workspace. Again Right click on the data model and select Restore… shown in the drop down menu.

    The restore menu will appear. In this menu clicking on the Browse button will bring up another window letting the user to select the data model from the storage account.

    Note: on this screen you will need to select Allow database overwrite and it is optional to select if you want to Overwrite security

    Below is a screen shot of the selection screen for picking the model

    Once the restore has completed we can go back to our production model and see we now have partitions loaded.

    If you like the content from PowerBI.Tips please follow us on all the social outlets. Stay up to date on all the latest features and free tutorials.  Subscribe to our YouTube Channel.  Or follow us on the social channels, Twitter and LinkedIn where we will post all the announcements for new tutorials and content.

    Introducing our PowerBI.tips SWAG store. Check out all the fun PowerBI.tips clothing and products:

    Check out the new Merch!

    Hasta La Vista Data
    Go Ahead Make My Data
    PBIX Hat


  • Power BI Hack: Download Report Authored in Browser as PBIX

    Power BI Hack: Download Report Authored in Browser as PBIX

    The Problem

    Most of you have probably run into a situation where someone in your organization has authored a report in the Power BI web service, and now they want to make changes that can only be done with Power BI Desktop. So, you try to download the PBIX file from the Power BI web service, only to discover that you can’t, because if it wasn’t created as a PBIX, it can’t be downloaded as a PBIX. Infuriating!

    :rage:

    The Solution (sorta…)

    There’s actually a way to get around this problem. If you publish a blank PBIX file to the Power BI web service, you can copy the contents of the report that was originally authored in the browser into that blank report. And since that report was originally a PBIX file, you can download that instead!

    Unfortunately, the only way to do this right now is to use the Power BI REST API and hit the Update Report Content In Group endpoint, and this process is just about as straightforward as Lombard Avenue in San Francisco. (Actually, probably even less so.)

    File:Lombard Street SFA.jpg - Wikimedia Commons
    Lombard Avenue in San Francisco: Famously bendy, but still more straightforward than manually hitting Power BI APIs.

    PowerShell to the Rescue!

    :powershell:
    Hooray for PowerShell!

    So, I wrote a PowerShell function to simplify and streamline this process, and its only prerequisite is the MicrosoftPowerBIMgmt.Profile module for PowerShell. Just run the script file (linked below) in your PowerShell terminal, and then call the Copy-PowerBIReportContentToBlankPBIXFile function directly from that same window. The expected parameters are:

    • sourceReportId: The ID of the report to copy from
    • sourceWorkspaceId: The ID of the workspace to copy from
    • targetReportId: The ID of the report to copy to
    • targetWorkspaceId: The ID of the workspace to copy to (this one is optional – if you leave it blank, the function will assume both source and target are in the same workspace)

    Download the Copy-PowerBIReportContentToBlankPBIXFile.ps1 PowerShell script file here.

    As always, feedback and suggestions are 100% welcome and encouraged. 

    :sunglasses:

    Cheers!

    ~ James


    Acknowledgements:
    This PS function was inspired by a blog article written by one of the top minds in the Power BI space, Mathias Thierbach. Check out his article here. And if you’re not already using his pbi-tools for Power BI version control, you should check that out too.

    If you like the content from PowerBI.Tips, please follow us on all the social outlets. Stay up to date on all the latest features and free tutorials.  Subscribe to our YouTube Channel.  Or follow us on the social channels, Twitter and LinkedIn, where we post all the announcements for new tutorials and content.

    Introducing our PowerBI.tips SWAG store! Check out all the fun PowerBI.tips clothing and products:

    Hasta La Vista Data
    Go Ahead Make My Data
    PBIX Hat


  • Power BI Support Channel: Microsoft Teams Tips

    Power BI Support Channel: Microsoft Teams Tips

    When organisations deploy Power BI, it is important to offer support to users. Often this can be in the form of formal help desk and tickets. In addition to this, many companies use Microsoft Teams to set up specialised support channels. Teams offers a quick and straightforward way for users to get answers to questions. However, best practices should be followed when setting these up. This article focuses on some communication tips in Microsoft teams to help create a successful support channel.

    Additionally, we recommend reading the Power BI Adoption Roadmap. This roadmap goes into detail about rolling out Power BI and setting up user support. It is a vital part of creating a data culture within your organisation.


    Use a Power BI support channel

    It can be beneficial to have an individual location for users to ask for help and support with Power BI. Typically, there will be a dedicated set of users who are knowledgeable and proficient with the tool. Some organisations give them nicknames such as champions, super users, or rockstars. In this article, we will refer to them as the BI team.

    An organisation can, and should, set up different teams for individual projects. As part of a Centre of Excellence (CoE) or a User Support Hub, there may also be a team specifically for Power BI or the Power Platform. This specialised team would have channels dedicated to supporting and assisting the wider organisation.

    To implement this correctly, the BI team should encourage users and ensure awareness of the correct teams. For example, there may be a project team working on a problem involving Power BI. After some deliberation, the project team gets stuck and decides to ask the help of the BI team. One of the project team members collects the relevant information they head to the support channel, which could be part of the CoE. Posting in this correct support channel, rather than the project channel, allows the project team to get answers quicker.

    A centralised Power BI support channel

    Having a centralised Power BI support channel depends on organisational structure and may not suit all businesses. However, there are several advantages for a centralised channel. There is a centralised area for the BI team to focus on, instead of users asking questions in multiple areas. A central location can also encourage users to collaborate and ask questions, helping adoption and learning at the organisation. Other users can see the results and responses, which may answer their own issues without need of additional help.

    Additionally, the BI team members do not need to be added to multiple teams to support every query. This also reduces the BI team from receiving large amount of support emails, or direct contact from users asking for help. If users email and speak to BI team members directly for support, the BI team should politely tell them to ask the question on the correct channel.

    The BI team should include a wiki on the channel. This can have helpful information about the BI team itself.


    Asking support questions

    A support channel can be invaluable to a business and be a great alternative to a help desk. However, even if it is not an official ticket, thought and structure should be put into the question. Lack of information can cause wasted time for the BI team to figure out exactly what the need is. This goes against the goal of getting users a timely answer. It will also have a knock-on effect as other questions will take longer to be answered. Additionally, it is often a source of great frustration to the BI team when there is not enough information to provide a response.

    One effective way to aid users is to create a question template. Place this in the wiki of the channel and pin a message in the channel chat telling users to visit the wiki, so they can easily find it. Still, even with advice, many users may ask poorly formulated question. In this case, it can be easy for the BI team to respond negatively. However, this is not useful and may result in users not reaching out for help. Instead, the BI team should remind the user how to formulate a question and point to the template. If necessary, they can de-prioritise questions that do not use the template while prioritising those that do. Having your question prioritised, and therefore answered quicker, is a big incentive for people to ask questions in the desired format.

    Screenshot of a teams response, reading:

Thanks for contacting the BI team. This question has been marked as low priority, due to there being some missing information. Adding more information will help us resolve your question promptly. Feel free to edit the question and fill in all the information using the Question Template in Wiki. Thank you
    Example Response

    Question Template

    Here is an example of a template you can supply to users. When users have a question or issue, they are expected to copy the template and answer the headings as required.


    Business need
    Give some context on why this is needed to be looked at. If it is affecting reports or datasets, say what they are and who uses them.

    Issue
    Go into detail and explain what the issue is. List out anything you’ve tried before.

    Expected behaviour
    Explain what you would like to see and the output you were expecting.

    Code
    Use the code snippet function to add any code examples. Please format it first, using tools such as DAX formatter.

    Link (optional)
    If this relates to questions or messages in other teams, you can link to them here. You can copy a message link by clicking the ellipsis on the message. Alternatively, you can link directly to the channel the same way. Note that the BI team member will need to be added to the channel to see any messages.

    Attachments
    Attachments are a great way to show the trouble you are having. Include examples where you can, and try to include data where possible


    Tag lists

    A feature called Tag lists allow you to mention specific people. This helps users make specific people aware of the message, while not tagging a channel directly, which can be frustrating to those in it. Tag lists are great for alerting the correct people to a problem, without sending unnecessary notifications to others. An example could be tag lists could be “DAX Experts” within the BI team. This group contains those who are experienced in DAX. When users need DAX help, they can @ tag that list. The people in the list would get a notification that a high priority issue has been raised. Now only the DAX experts get notified, as they are the ones who can respond to the query.

    Tag lists as notifications

    Other uses for tag lists are opt-in notifications. Let’s take an example of a fictional company. The company creates a team called “News and Announcements”. Here, they post valuable news and information about Power BI. The company needs to follow the monthly release of Power BI, as software downloads are tightly controlled. Some users wish to know as soon as a new release is announced, while others are not as interested.

    First, they create a tag list named “Power BI Release Alerts“. Users who want to be in this tag list can opt in. Now, whenever there is a monthly release of Power BI release, a designated user will post an announcement in this channel. The poster tags the “Power BI Release Alerts” tag list in the post. This allows users to sign up for alerts and get notifications about the announcement. Others who do not need to know as quick can still find the information but view it in their own time.

    The tag lists should be an opt in group. The organisation size and structure will affect how to manage this. Some organisations will allow users to assign and manage tag lists, and to add themselves to the appropriate lists. Others may have a formal request process set up to be add or remove a user from a list.


    Use a hierarchical folder structure

    Within your files section, be careful how you arrange documents. Take time in creating a logical folder structure.  A new user should be able to access the files and understand the logic of the folder structure.

    Hierarchical folder structures rely on various levels. The top levels are used only for navigation and keeping the file structure clean. Direct files should be saved in lower down folders. This stops users adding multiple and unrelated folders, or saving files in the root folders.

    An example of a hierarchical folder structure:

    1st Level: High Level Subject Areas
    2nd Level: Subjects
    3rd Level: Breakdowns
    4th Level: Individual files saved inside level 3 folders


    Best Practices in Communicating on Teams Power BI support channels

    When using the Power BI support channel, reply to the correct conversation rather than starting a new one. This will keep the channel tidy and the responses will have context. When starting a post, set a subject like you would an email. You can do this by clicking the format button under the input box (shown in the image below).

    Image showing location of format button
    Format button

    Only if necessary, notify people that are the recipient of the message by tagging. You should think carefully about tagging people. Tagging someone implies there is a need for them to read the post urgently. If you are asking a question in a support channel, it is unlikely you need to tag someone, as they will be reading the channel when possible. When possible, tagging should be reserved for tag lists, to allow correct users to be notified. Additionally, always avoid tagging the team or channels directly. There is no need to notify everyone, as they are part of the team anyway.

    Use chats for conversations that do not require outcomes. Chats are good for working sessions, informal talk or quick questions. In many cases it can be helpful to mute chats to stop alerts distracting you do not participate in it often. Try and keep conversation in the appropriate Channel if you need a quick response from someone.

    If you do use chats, follow the no hello rules. Don’t start a chat with just “hello”. Feel free to add a greeting, but include why you want to speak to that person too!

    When creating Channels, make use of the apps. There are many different apps you can add, or create your own in Power Apps, such as the Power BI Version Control app.
     

  • 8 Mistakes I made to Start Learning Power BI

    8 Mistakes I made to Start Learning Power BI

    If you want to start learning Power BI, or are looking to improve your skills, there are lots of areas you can start. However, learning itself is a skill. When I started out, I had a few things that slowed down my progress. These are eight common mistakes that I made when I started my journey of Power BI, and the lessons I learned along the way!

    note with the text "never stop learning" written on it

    1) Trying to Focus on Learning too Narrow

    There is a lot of areas to cover in Power BI. Most people see the visual design side of Power BI (being graphs and visuals). Yet, there is much, much more. Power Query and DAX are two detailed languages to learn in themselves. Next, there are tabular models and analysis services. Then you have the Power BI service, governance, and all things that come with software deployment. On top of that, all the third-party tools and add-ons.

    You do not need to master these, but you should have breadth in your learning. Understanding the fundamentals and basic concepts of each stage in Power BI. When starting out, I dived into Power Query and wanted to be an expert modeller. While this is not a bad idea, I neglected some basics of database design and governance. Without these, my skills were not complete enough to be considered an expert in any one aspect.

    Lessons Learned: See the bigger picture and start with the fundamentals. Don’t stop being a specialist if wanted, but get the basics covered first. Look at the skills matrix. Try to get to at least level 4/5 in each subject, then dive into the detail.


    2) Trying to Focus on Learning Everything

    A warning to the previous post, is to try and master all the areas. As I learned more, I thought learning Power BI required me to learn everything about it. Yet this was an unrealistic task. When I went to start learning Power BI, I tried to master Power Query, DAX, Analysis Services, design theory, governance among many more. The result is that I was taking on too much and forgetting most of what I had learned.

    Lessons Learned: Find your niche. You may love story telling, enjoy writing complicated Power Query or advising users on admin features. It is a careful balance to not focus on too narrow or too broad. Learning is an iterative process though. To find an area you excel at and enjoy the most, you need to experience more. First, learn the fundamentals and get a good breadth of knowledge. Next, get involved in your favourite areas and get a good depth of knowledge.


    3) Saying YES to every request

    This is one of the biggest mistakes I made (and see others make) when taking requests. Stakeholders requesting reports are often less versed in Power BI. As a result, they may not understand best practices or visual design theory. It happened a lot – they would ask for unique and specific requirements. I took it as a challenge to try and deliver exactly what they wanted. This often-meant creative hacks, crazy DAX, and bizarre uses of visuals.

    While I was pleased that I could stretch Power BI to meet users’ needs, I know now this was a bad approach. This resulted in hours of fixing the complicated visuals when things went wrong. Changes that should be small turned into complex projects.

    Leason learned: You are the expert for a reason. Knowing how Power BI should be used is an important skill. Being able to explain this and not over customizing reports is even more important. Learn how to take requests from users and understand what they really want. The story the report tells is much more important than the style of visuals on a page.


    4) Not Understanding enough about I.T. practices

    I came from a business side analytics role. I was a big excel user and loved creating complex and unique solutions to solve difficult problems. However, I did not know enough about I.T. best practices. These include DevOps, releases, or multiple environments (e.g. DEV, TEST, PROD).

    While I could develop reports, I did not know the processes to deploy them. I did not know how to thoroughly test.

    Lessons Learned: While you do not need to be an expert, you should know the basics. When you start learning Power BI, make sure you spend a bit of time understanding these. Moreover, contact your I.T. department and ask about the practices in your organization.


    5) Start Learning Power BI too advanced – not at the fundamentals

    I love learning new skills. The more complex, the better. Trying to learn the most difficult and complex tasks seemed like a clever idea to quickly advance and become a pro. Yet, the reality is a little different. You may have heard the phrase “Don’t run before you can walk”. By diving in too quickly to the complex tasks, I missed some fundamental knowledge. This slowed my learning down overall. Without that knowledge, I found it difficult to grasp the why. This doesn’t just apply to skills in Power BI Desktop, but fundamentals in databases and data transformation too.

    One area I did this is when I was learning to data model. I tried to learn all advanced methods and specialised tricks. I would find complex ways of doing powerful tasks. But without the fundamentals, I wouldn’t fully know the why. I learned replacing long text keys with integers was a good idea. Learning about data storage and the reasons behind this helped me know why to do this and understand the best methods.

    Lessons Learned: When you start learning Power BI make sure to learn the basics. Even as a seasoned developer, make sure you revisit them. Learn the fundamentals of skills such as databases or data storage. Learn about STAR schema, keys, dimension, and fact tables.


    6) Going too fast in learning DAX

    At the start, DAX seemed like the holy grail. It was familiar from an excel background. So, I set off to master it. It seemed simple enough to do.

    I was wrong. DAX is hard. In fact, DAX is extremely hard. Many beginners will say DAX is easy. Only until you learn DAX, you know it is not. While it may be easy to do some calculations, others can seem impossible. Writing DAX requires a knowledge of how it works. DAX also works differently to anything I have used before.

    The worst scenario is not knowing DAX’s difficulties. You may end up writing incorrect DAX, and not know it is wrong. Users will consistently come back saying the numbers are wrong. Eventually, people will stop trusting your reports. Luckily, you do not need to be an expert in DAX. You can be a great developer will reasonable skills.

    Lessons Learned: If you are struggling, first make sure you model is following best practices. This is the often cause of most DAX issues. If you want to be an expert, then great. This can be a valuable skill when you start learning Power BI. Otherwise, ensure you learn and re-learn the fundamentals. Read this article on the what the fundamentals are. Educate, practice the skills, then re-educate. Never stop learning DAX, and never stop visiting the fundamentals. Read this amazing article by SQLBI.


    7) Start Learning Power BI by Ignoring best practices

    Learning new skills is fantastic and often I was eager to show them off. The more complicated an answer was, the more I wanted to include it in a report. This gave me great confidence and made me feel like I really knew the subject.

    However, this rarely translated into better reports. What I found was changes became difficult to make. Additionally, reports would break in the future. Minor changes and growing data would often mean repair was needed for the reports. Ignoring modelling standards such as STAR schema resulted in hours spent in DAX.

    Lessons Learned: Learn the best practices and religiously follow them. Microsoft have an excellent resource for this. Simple is often better – you want to design reports that are robust, and users can trust will not break.


    8) Start Learning Power BI without asking for help

    There are lots of areas you can start with in Power BI. To be a great developer, it takes knowing lots of different skillsets. While there is a great deal of paid training, this may not be available to everyone. Self-training is an effective way to learn, but everyone will need some help sometimes. Thankfully, the Power BI community is an outstanding community. There are some amazing people who spend their time helping others. Yes, it is important to learn by making mistakes and figuring things out on your own. However, if you are really stuck on a problem or concept, reach out for help before getting slowed down or frustrated.

    Lessons Learned: Knowing how and where to ask for help, however, is important. Even if someone likes to help a lot, sending unsolicited messages to people you do not know can come off rude and annoying. Luckily, there are a number of places you can go for help:

    Community.PowerBi.com – This is the first place to go for specific questions when stuck. Please don’t treat this as a place for free consulting, but rather to help you understand concepts you are stuck on.

    User Groups – These are great to join and attend monthly meetings. They normally have a local community that include all levels of knowledge – great for learning and asking questions.

    Social Media – There are a number of active communities. There is a great Reddit group and some active users on Twitter. In addition, LinkedIn has many users who love to share knowledge (feel free to follow myself or PowerBI.tips too!).


    Conclusion

    It can sometimes be overwhelming to know where to start in a new skill. There is a phenomenon called the Dunning-Kruger effect. This is the effect that often, when you start learning, it will feel easy. However, as you learn more, you realise how much knowledge there is and feel there is so much you don’t know. Please, do not let this put you off. This is a very common feeling that almost everyone goes through.

    Instead, focus on getting great at the basics. Keep it simple and to things you can complete. Reach out, join the community, and ask questions. Of course, most of all, have fun!


  • Certified vs. Promoted Dataset?

    Certified vs. Promoted Dataset?

    Power BI continues to grow and strengthen its position in the enterprise space. A feature that you may not be aware of, but can be extremely valuable, is the ability to certify datasets. This capability offers organizations a way to help end users identify that certain datasets are more concrete than others. In this episode we discuss different criteria by which we think a dataset should reach a promoted or certified level. Do you use this feature? Do you know the difference between a Certified vs. Promoted Dataset?

    Promoted Datasets

    Sample of Promoted Dataset Setting

    This endorsement doesn’t have any guard rails. Any user with edit permissions on a workspace can add a promoted dataset/report. Business users should have a clear idea of what a promoted dataset means. However, this certification setting does not have any gates for sign off from admins or user bodies. The end user should have confidence in the accuracy of data, but there is no direct governance that requires it.

    Certified Datasets

    Sample of Certified Dataset Setting

    We spend a lot of time discussing and getting some great feedback in the live chat around this area. The Certified endorsement can be tightly controlled. It is a setting that is allowed for admins or a governing user to implement. This endorsement can carry a significant amount more weight. It should imply that there are a series of steps, processes, and reviews that ensure the data is as trusted as possible. Join us as we explore what should or shouldn’t be a requirement using these endorsements. The best ways to implement these features and the value they provide to your overall implementation.

    If you like the content from PowerBI.Tips, please follow us on all the social outlets to stay up to date on all the latest features and free tutorials.  Subscribe to our YouTube Channel, and follow us on Twitter where we will post all the announcements for new tutorials and content. Alternatively, you can catch us on LinkedIn (Seth) LinkedIn (Mike) where we will post all the announcements for new tutorials and content.

    As always, you’ll find the coolest PowerBI.tips SWAG in our store. Check out all the fun PowerBI.tips clothing and products:

    Snap Back Hat
    PBI Hat
    Clicky Click T Shirt
    Clicky Clicky Draggy Droppy T Shirt
  • Using the Power BI Scanner API to Manage Tenant’s Entire Metadata

    Using the Power BI Scanner API to Manage Tenant’s Entire Metadata

    Much thanks must go to both Ferry Bouwman and Rui Romano for inspiration and building off the work they have done already for the use cases for the Scanner API. Ferry created the initial Microsoft Flow to automate the request and pull of data, and design ideas were taken by Rui Romano’s existing Report. Please give them a shoutout because this would not be possible without them!

    Recently the Power BI team announced a major advancement in the ability for Power BI admins to extract tenant-level metadata with the ability to collect information such as tables, columns, measures, and DAX expressions in datasets in the Power BI Service. This feature is a huge step and something that any Power BI Champion should strongly focus on the use cases and integrating this solution into their catalog.

    Let’s start with the what and the why of using the Scanner API as a Power BI Admin.

    What is the Power BI Scanner API?

    The Power BI Scanner API allows organizations to request and collect the entire metadata of a tenant’s Power BI schema and catalog. Using the Power BI REST API, users can push a scan and more importantly extract nearly all of a dataset’s information and schema. The Scanner API returns the entire tenant metadata such as:

    • Datasets & Workspaces
    • Data Sources
    • Dataflows
    • Dataset
      • Tables
      • Columns
      • Measures, including the actual DAX expressions
    • Table M Expressions

    Why Use the Power BI Scanner API

    The ability as a Power BI Admin or champion to consume and understand the datasets and information of their tenant is vital both from an Governance and Adoption perspective. Firstly, the Scanner API enables admins to discover and easily understand the workspaces, measures used, and what datasets are active in their tenant. Rather than relying on various methods of manual input of datasets into a system, the automated fashion to pull in this information positions admins to better enforce and manage the organization of datasets.

    Governance

    Along with dataset information, the newly updated Scanner API pulls in dataset metadata which creates more potential of how to better govern and unify the business logic used in datasets. A primary use case is to ensure that datasets and the tables being used are using the proper logic (columns, data sources, merges) by easily viewing the M code behind any table dataset. In the same fashion, champions can now ensure that datasets are 1) using Explicit Measures in their reports, and 2) those measures which are universal to the company are using the correct formulas (think Net New Members in multiple reports, ensuring that the correct relationship for date and Member ID is being used).

    Adoption

    There are many workarounds in the community to best provide discoverability of data for users. Unfortunately, many of these require manual input and do not synchronize with one’s active data. Using the Scanner API, admins can create automated solutions to easily provide datasets that are active for users to discover, and further can be integrated with other platforms to include custom fields.

    One idea is creating a Data Lexicon for an organization, which includes a company’s report catalog and terminology. A Data Lexicon should include helpful content for consumers, such as a report’s purpose, intended audience, and refresh schedule. Using the Scanner API, anytime a dataset is added to the tenant, report authors can easily integrate these custom fields with active datasets.

    Understanding the Goal

    This article is not going to cover the intricate details of the API requests and parameters. Rather, the TL;DR version of the required calls / steps of the API are:

    1. Call the Scanner API to trigger a Scan
      1. This call must include a body of what Workspaces to be scanned
    2. If more than 100 workspaces, than loop through the request (limit per call is 100 workspaces)
    3. Wait until a Scan is completed (depending on how many scans)
    4. Get the Scan Result and collect the array as JSON

    The goal here is then to try to accomplish the following:

    • Create an easy-to-use process to automate the API workflow
    • Store the scan results into a JSON file into SharePoint
    • Transform the metadata into a structured model (Tables, relationships, etc)
    • Use the structured tables in multiple products (Data Flows, Power BI, Power Apps)

    Building the Solution

    The majority of credit needs to go to Ferry Bouwman who initially created a viable solution that can easily be integrated into a report. He created a GitHub repo that included a Power Automate flow that truly covers the entire process of automating the API call.

    The following is building off Ferry’s solution, including the new metadata schema that is now available. There is more that I want to accomplish in this solution, but to get the Scanner API and a template to connect to the data, you can do so using the steps below.

    Pre-Requisites Before Use

    Before starting, you must have already completed the following in order to use the Scanner API at all. Please see the documentation for each to set up:

    The Solution Bundle

    The solution includes the following to implement:

    • A Power Automate Flow that handles the entire API request and call
    • A Scheduled Refresh Flow that refreshing daily and triggers the Flow above
    • A Power BI Template report to connect to the metadata results

    Download the Solution on GitHub.

    Installing & Using

    Import the API Scanner Flow

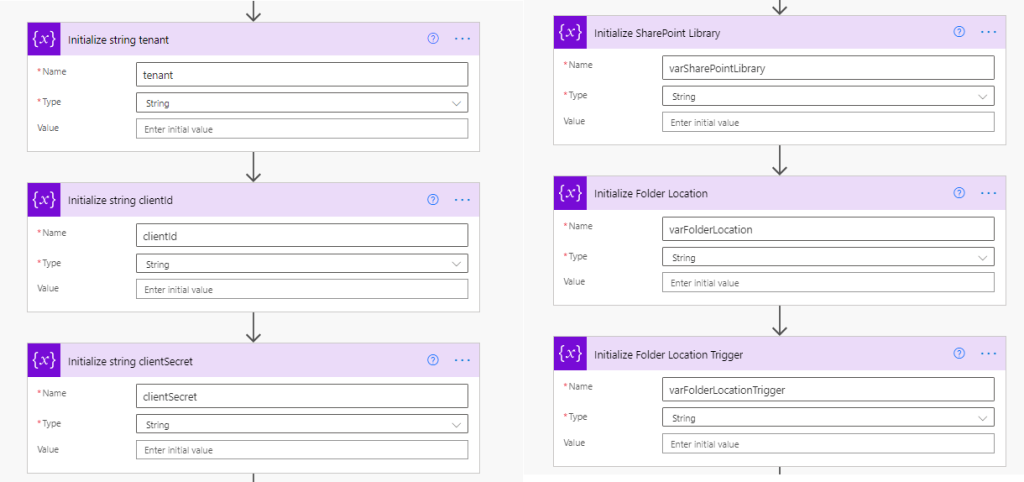
    The first step is to import the Flow pbitips_ScannerAPI into your tenant. Once you do this, there are a few variables and actions to update before running.

    • tenant: The tenant of your Active Directory
    • clientId: The Client ID of your registered App
    • clientSecret: The Client Secret value of your registered App
    • SharePoint Library: What SharePoint library you want to save the files
      • NOTE: Remember this location as it will be used in Power Query
    • Folder Location: The folder location to save all returned scans
      • NOTE: Remember this location as it will be used in Power Query
    • Folder Location Trigger: A different folder with a different name, to trigger the refresh run.

    Set up the Automation Flows

    The next part is we want to set up the automation of the Flow, so that it triggers on a daily basis, or even a manual basis.

    Import the Flow PBI_Scanner_Refresh into Power Automate. Once imported, you will need to grab parts of the initial Flow’s HTTP trigger and add them to the variables in the PBI_Scanner_Refresh Flow:

    • Initialize string URI-first-part: The first part of the HTTP Request Received, everything from the start up to modifiedsince/.
    • Initialize string URI-last-part: The parameters. Simply copy from the ? part of the URL to the end
    • Initialize string modifiedSince: write all
    Copy the HTTP Get URL from the initial Flow to grab the variables needed
    Paste the parts of the HTTP GET URL into the variables in the daily refresh Flow

    Additionally, The Power BI Template also includes a visual to trigger the Flow within the Report. You can simply copy and paste the variables and the HTTP Call other flow with all Power BI API logic actions using the When a Power BI Button was clicked as the trigger.

    Run the Flow: Ensure It is successful & saves the files

    Run the flow manually. Note that the first time you ever call the Scanner API, it will return a subset of the metadata. The more that you run it (daily) the more complete metadata will be returned.

    Once you can confirm that 3 files have been saved to the folder specified above (a MetaData_, a WorkspaceArrary_, and RequestStatus_ json file), you know the Flow works.

    Ensuring that the files were saved to the correct SharePoint Library and Folder

    Once you have verified the flow runs and saves to the correct file, you are ready to start using the Power BI Report.

    Connect to the Data – Power BI Template

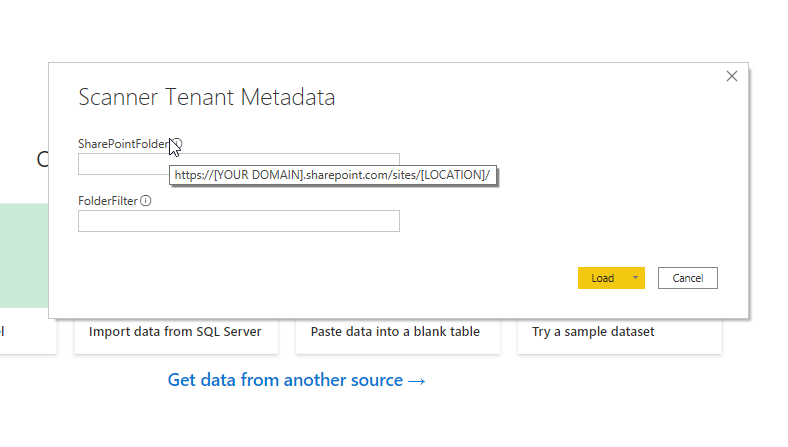
    Using the Scanner Tenant Metadata Power BI Template file, open it and it will prompt you to input two parameters.

    • SharePoint Folder: The SharePoint Document Library url specified in the variable from the Flow
    • FolderFiter: The deepest subfolder that the files live (for example, if the files live in PBI_Admin/MetaData/MetaFiles/, then enter in “MetaFiles“)
    Entering in the Parameters in the Power BI Template

    Once you enter the parameters, click on load, and wait for the magic to happen!

    Using the Scanner API Report

    The Report contains tons of information across the entire organization’s content in Power BI. From Datasets all the way to the DAX expressions per table and report. The template and report is meant to be a starting point for authors to further build out additional functionality to meet their needs. Much thanks to Rui Romano’s Scanner Template as well:

    Summary Page

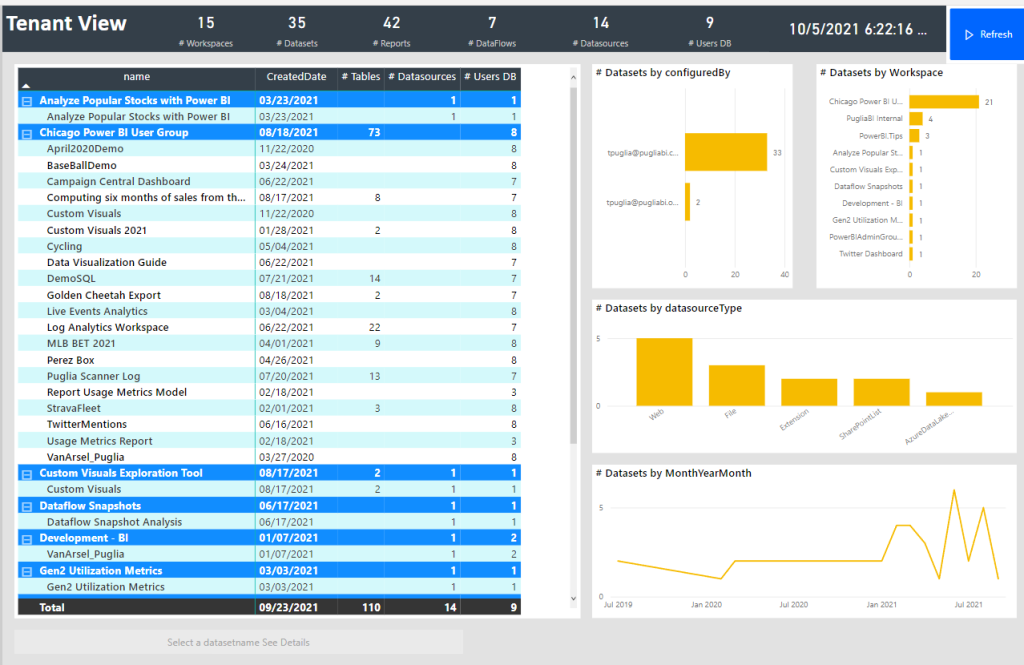
    The Template starts with the Summary Page, providing a high level overview of Workspaces and Datasets active in the tenant. Included in the high level overview is the created date of a particular dataset, the number of tables, data sources, and users who have access to it.

    Selecting a dataset will highlight a drill through button to navigate to a detailed dataset page.

    Summary Page in the Tenant Data Catalog

    Dataset Drill through Details

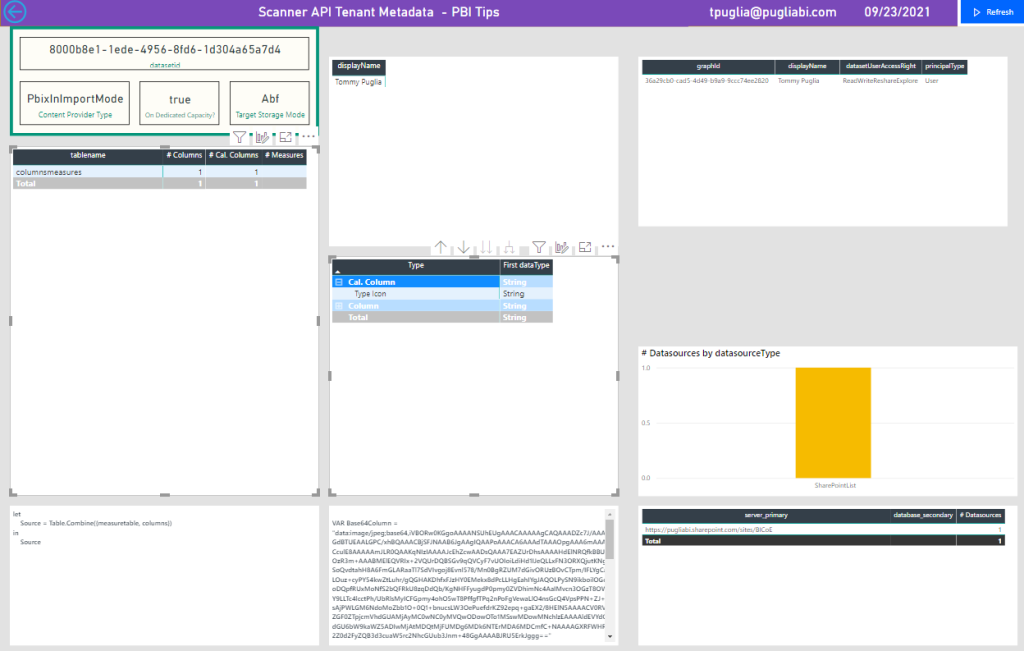
    The drill through page for a dataset provides vital information such as the tables, fields, and even the query and DAX expressions within a dataset. Along with this, an information panel of the ID, storage mode, and even users is available here.

    Selecting a table will display the M query in it’s entirety. Expanding the Measures & Calculated Columns displays the DAX expressions beneath it. Along with this, the list of data sources by type is available.

    Dataset Drill Through Page, showing expressions and Users who have access

    Datasets Page

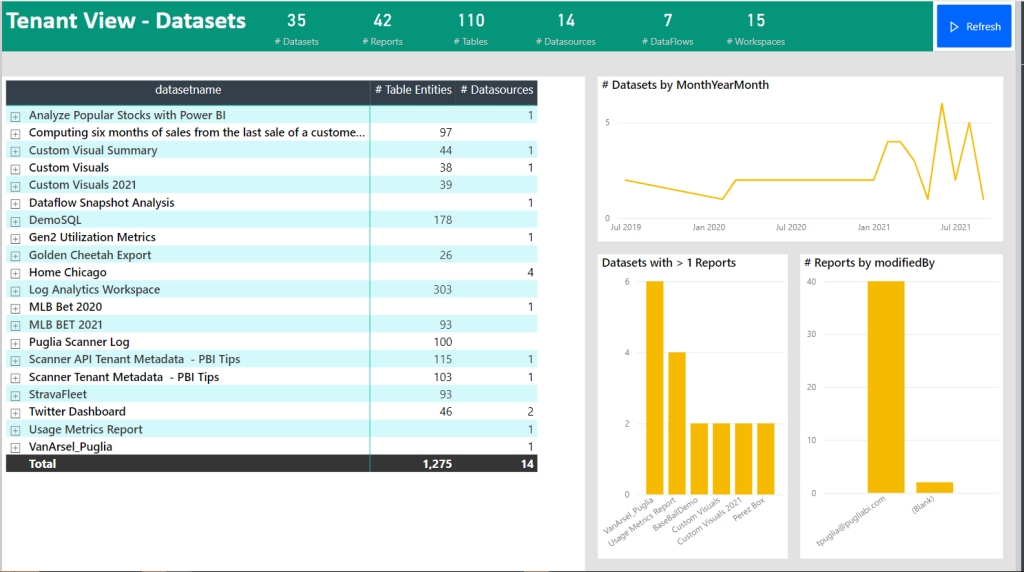
    The Datasets page is a overview showing the number of entities (columns, calculated columns, and measures) within a dataset, including what Data sources are being used. Tracking datasets by created time is a helpful feature allowing admins to monitor the creation of new datasets overtime.

    Datasets Summary Page

    Tables Summary Page

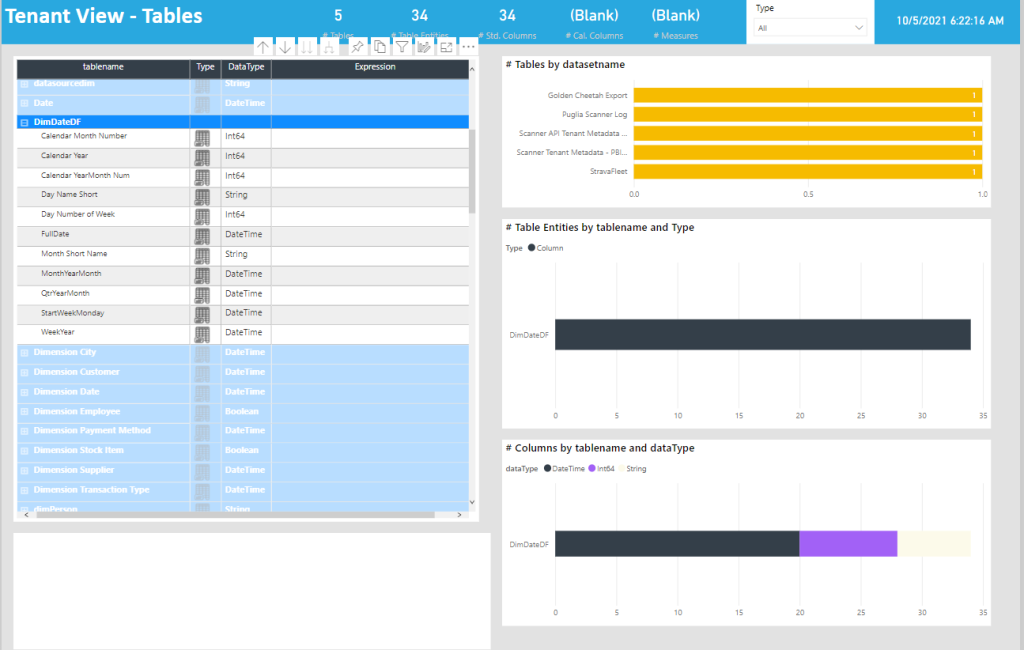
    Tables allows admins to monitor what tables are being used throughout the tenant’s datasets. This a powerful feature, allowing admins to monitor tables that may be used across datasets.

    Tables Page allows admins to see the columns, along with what datasets the table may be included in

    Data Sources Page

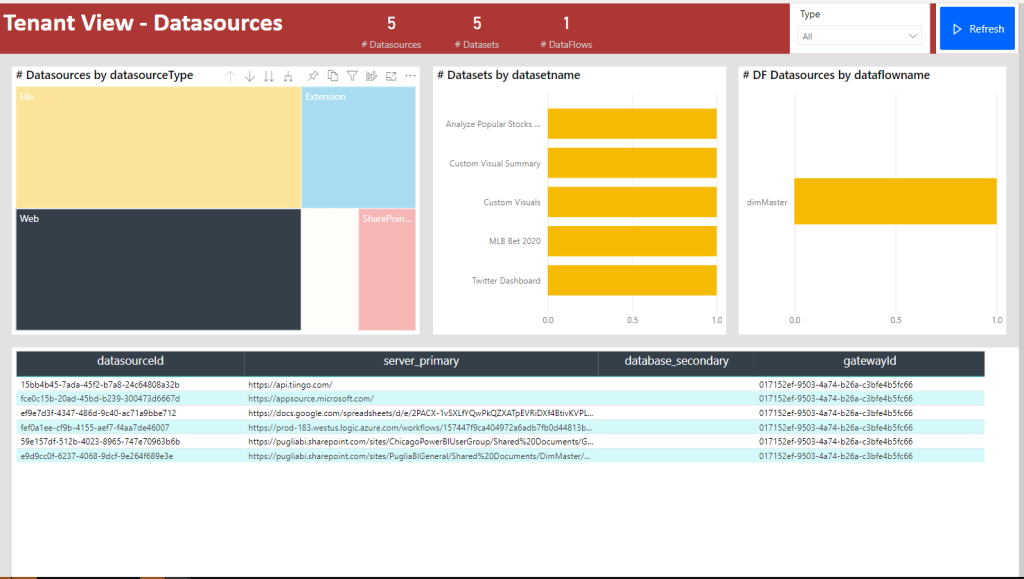
    Looking at the metadata in another way, admins can monitor the type of datasources used throughout the tenant, including the information such as the data source type (SharePoint, SQL, etc) and even the source. Selecting a datasource will display what datasets they are included in.

    Datasources Page shows by type what datasets, the source of the source ,and even Dataflows

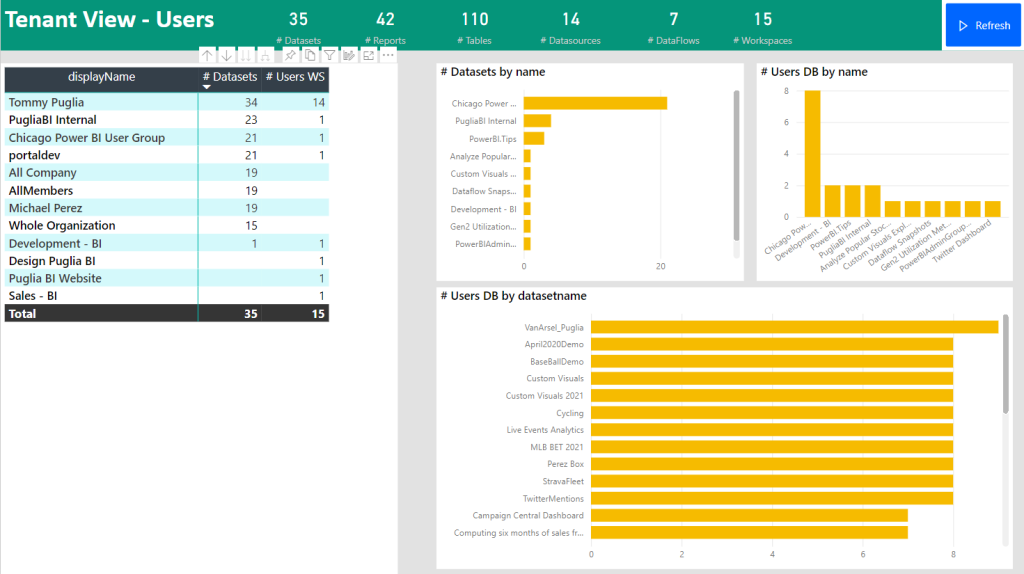
    Users Page

    The Users page is using the new ability to append to the Scanner API metadata, getArtifactUsers=true, to pull what users have access to various datasets. Again, the ability to select and display is a powerful feature for Admins.

    Users Page showing access

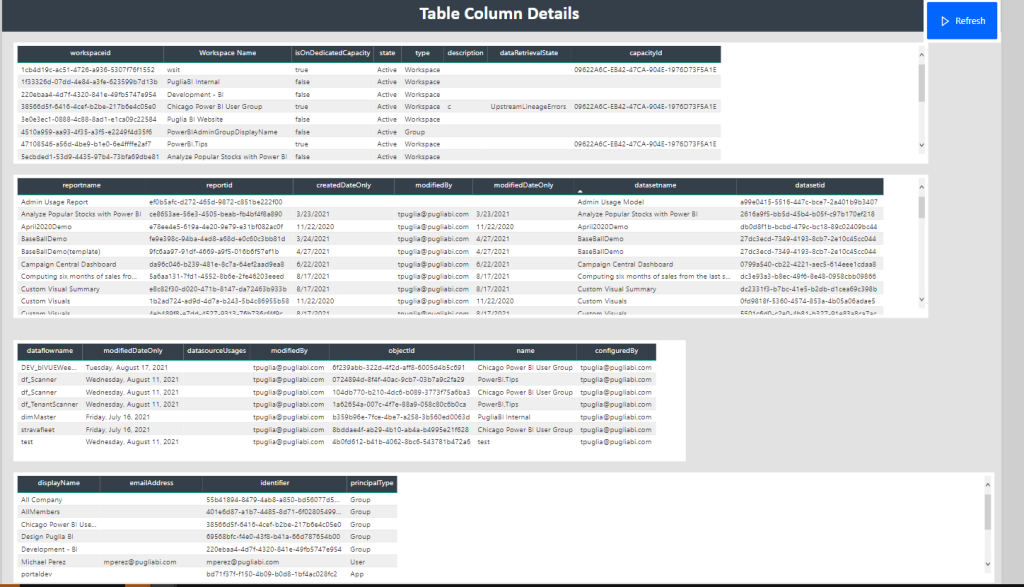
    Details Page

    Understanding needs to get the metadata displayed as a list, the Details page provides all of the underlying information about each artifact in the tenant, such as the ID’s used in Power BI, types, and who last configured an entity.

    Details Page showing all of the underlying information

    Conclusion

    The ability for a Power BI champion to have full visibility into the organization’s Power BI content has and will be a vital piece of adoption and governance of Power BI. The amount of information available and to act on will allow admins to readily understand the activity happening at all times.

    You can find the full solution here:

    This template is just a starting point. The community here should be able to take this and expand on this, and please provide your suggestions to the GitHub Repo here:

    Again, many thanks to Ferry Bouwman and Rui Romano for building the foundation.

    If you like the content from PowerBI.Tips please follow us on all the social outlets. Stay up to date on all the latest features and free tutorials.  Subscribe to our YouTube Channel.  Or follow us on the social channels, Twitter and LinkedIn where we will post all the announcements for new tutorials and content.

    Introducing our PowerBI.tips SWAG store. Check out all the fun PowerBI.tips clothing and products:

    Check out the new Merch!

    Hasta La Vista Data
    Go Ahead Make My Data
    PBIX Hat