
Power BI is a powerful reporting tool that has been dominating the market and rapidly evolving. Yet, in many organizations people seem unaware of its true potential or core purpose. As a result, too often it is deployed to simply extract or visualize data points in an ad hoc reporting manner.
Power BI is greater than a report
Power BI should not be thought of as a separate product to ETL, AI/ML or overall data strategy. Rather, organizations need to include it as part of a data culture with all of the products working in union.
To deploy Power BI successfully, do not use it to simply design reports. Instead, design a culture and architecture. This is one that allows business users to understand, interpret and react to rich and powerful data driven insights.
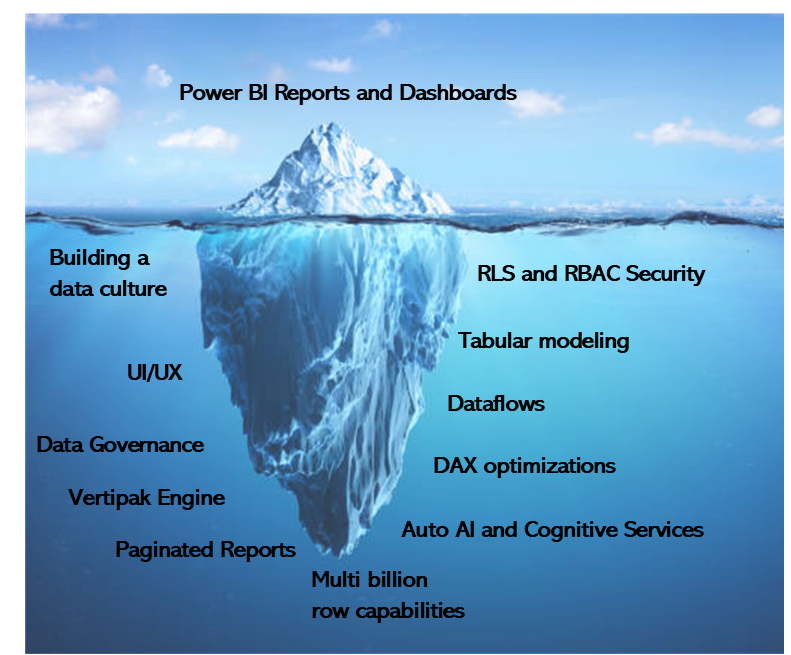
The many additional products, services and capabilities that come packaged in Power BI are too frequently overlooked. As a result, people see only the top level – visuals in reports and dashboards. But there is a whole host of rich and exciting features below the surface.
With that, here are some common mistakes I have frequently seen new users make when rolling out Power BI.
Mistakes made to under utilize Power BI
- Using it for Data extraction
Large tables with a selection of filters that you may or may not look to export. Instead, Power BI is designed for trends, insights and cross slice and dice. Large tables and data dumps do not give insight. - Using it for a data visualization to tell a single point
Design a visual that can convey information quickly, rather than an infographic type solution. If you are looking for that pixel perfect data visualization for a news story that tells a specific point, there may be other options. Paginated reports or predesigned Excel documents are viable options. Design data pipelines that are regularly updated. Create visuals that are designed to be interactive. This will help users drill down and find insights. - Ad hoc only reporting
While this can be a great tool for ad hoc reports, you may be underutilizing and doing extra work. Instead, build reusable data models that are designed for multiple reports. Write DAX business logic and KPI that can serve as a single source of truth. Be sure to document your measures inside the data models. By clearly documenting measures data consumers will understand how to use the data model to build new reports. - Current reporting tool / Excel replacement
A common request is to “lift and shift” all excel reporting into Power BI. These products are different and have different uses. If you are moving to Power BI, don’t try and recreate old solutions. Instead, a better approach is to design new reports that play to Power BI’s strengths. Utilize the rich features and powerful engines that make Power BI beneficial. This is a story of it’s better together. Using just Power BI or just Excel has it’s advantages and dis-advantages. Conversely, using both Power BI and Excel can play to each tool’s strength. - Not building a data culture
Matthew Roche has an amazing blog series on building a data culture with why and how to do this. Building a good data culture is vital for adoption within the organization. The data culture will start with an Executive sponsor who can push for adoption. So, first and foremost, be sure to have a leader who believes in your vision.
Mistakes made when deploying Power BI solutions
- Focusing on raw numbers, not business insights
Instead of simply displaying numbers, great reports often have the following KPI, trends, drill down, interactivity and slicing capabilities. This allows business users to gain meaning information about the direction for the business. - Ignoring the deployment approaches
Many business users are familiar with a typical process for reports; a user submits a ticket to IT. IT writes a bunch of SQL queries to get the data for this request. They then surface the data in tables and simple graphs. In contrast, Power BI does a great job at breaking down this long turnaround and getting the data in users hands quick. An organization should deploy a top-down, blended or bottom-up approach. As a result of utilizing this approach, they can merge the business and IT side of operations and remove silos. - Failing to Think like the Business and Act Like I.T.
The I.T. organization has many strengths related to how to make data available quick and reliably. Power BI is mainly designed for business users. Thus, Power BI has features that borrow from best practices from I.T. One such best practice is the use of Deployment Pipelines. - Not utilizing Data Models or ignoring self-service reporting
Data models, as described in this blog by Matt Allington, contain all the metadata needed for reporting. This includes the business logic and data transformations. However, creating and maintaining these can be time consuming. Instead, it is possible to reuse data models and keep one source of the truth for many reports. The modeling experts can own and maintain the models. Furthermore, business users can connect and build their own Power BI reports utilizing the models. This is done without even needing to write a single line of code. - Treating Power BI as a stand alone product, not part of the greater data or AI solution
You should not treat Power BI should as just a visualization tool (read this blog by Gil Raviv). Instead, Power BI is a business insights tool, a way to serve and communicate the information within the organization. In addition ML and predictive analytics are baked into it, as are ETL processes, data storage and security. As a result a unified approach to a data culture should be built. Users from all business areas need to be aware of the strategy.
Using Power BI the right way
Power BI should be unified and part of the entire data stage – not a visualization layer on top of it. A modern data platform typically has 4 steps:
- Load and Ingest – extract the data out of the source system and transform it.
- Store – Land this data somewhere so we can run analysis on it.
- Process (or transform) – Run analytics on your data and draw out KPIs, AI and predictions.
- Serve – present this data in an easily way for stakeholders to consume it.
Power BI can be all of these steps. From a single report using power query (Load and Ingest) to import data (Store). Next, you can build a model and DAX measures (Process). Lastly, you can surface the data in visuals on the report pages (Serve).
This can be a more enterprise level solution and scale well too. Firstly, Dataflows are set to extract and transform data from many sources (Load and Ingest). You can back-up and store in a data lake gen 2 storage (Store). Secondly, the data can take advantage of automated ML (AutoML) and cognitive services. Build DAX expression over them, combining a powerful DAX language with the power of AI (Process). Last, you can package these as reports, dashboards, apps or embedded into other applications (Serve).
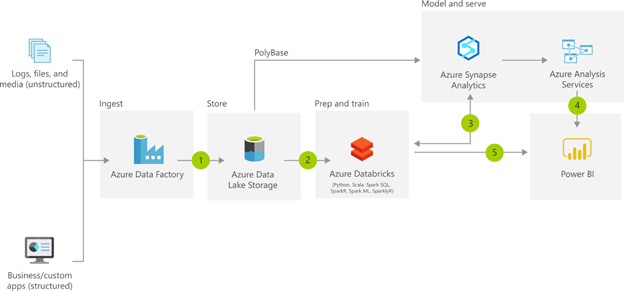
Alternatively, Power BI doesn’t have to be all these steps. A traditional data platform architecture is described by Microsoft in the picture below. You can utilize other tools such as Data Factory to Load and Ingest data. Next, you can use Databricks to Process/Transform the data. Power BI and Analysis services models will serve the data to the end user.
This is a great example of Power BI fitting into a greater data solution. However, you should implement the deployment with the entire solution in mind. Power BI is not as a tool for simply creating visuals. A good deployment is deeply rooted in the culture. Each step must consider the others in the pipeline, not sit in silos.
Bonus: See this great diagram by Melissa Coates, showing Power BI end to end features.
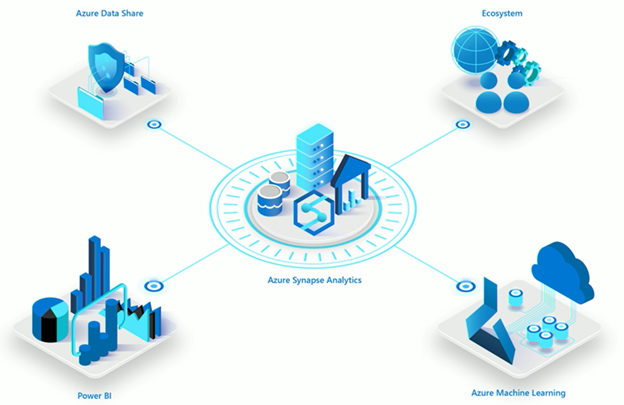
Azure Synapse
Microsoft is expanding this ecosystem with Azure Synapse. As they roll it out, they are designing data engineering as a single platform. This combines this entire pipeline and tools into a unified experience. Power BI being a part of this platform.
Synapse provides Consistent Security
When we think about user level security, Azure Active Directory (AAD) is the gold standard for access and security for organizations. Synapse leverages this technology to remove friction between different azure components. You can leverage AAD across the multiple services for data factory, Data Lakes, SQL and Spark compute as well as Power BI.
The experience of governing data on a user by user basis improves with the Synapse experience.
A Low Code Data Engineering Solution
There are many Azure components you can use to produce a well engineered data pipeline. Azure Synapse brings all these tools under the same portal experience. For example, using Azure Data Factory, then writing data into a data lake. Picking up the data and querying flat files with compute engines such as SQL or Spark. Azure Data Factory also has built in features that can simplify data lake creation and management using mapping dataflows.
More Computing Options
No longer do We have to choose just SQL or Spark, rather We have options. We can use Provisioned SQL which was previously Azure Data Warehouse. Synapse now offers on-demand SQL, and Spark compute engines. This is where we are really seeing the technology move to where we have separated the storage layer from the compute layer. This means Azure Data Lake Gen2 serves as storage, and SQL and Spark serve as compute.
One Place for all information
Whether it is Azure Data Factory, Spark, SQL or Power BI. Synapse has now become the single portal for integrating all these services. This in general simplifies the experience and management of all your data pipelines.
If you like the content from PowerBI.Tips please follow us on all the social outlets to stay up to date on all the latest features and free tutorials. Subscribe to our YouTube Channel. Or follow us on the social channels, Twitter and LinkedIn where we will post all the announcements for new tutorials and content.
Introducing our PowerBI.tips SWAG store. Check out all the fun PowerBI.tips clothing and products:
