I was having a candid conversation with Phil Seamark from DAX.tips about Aggregation Tables. During that conversation, I was asking about patterns in using Aggregation tables. Within that 10 minute conversation I was blow away by all the possible patterns. Because of this, we pleaded for Phil to present these patterns to the Milwaukee Brew City User Group.
While these patterns are described in detail here are the various patterns that can be used for Aggregation tables. Also, Phil includes a great introduction, found here. For each of these articles Phil describes proper usage for the pattern.
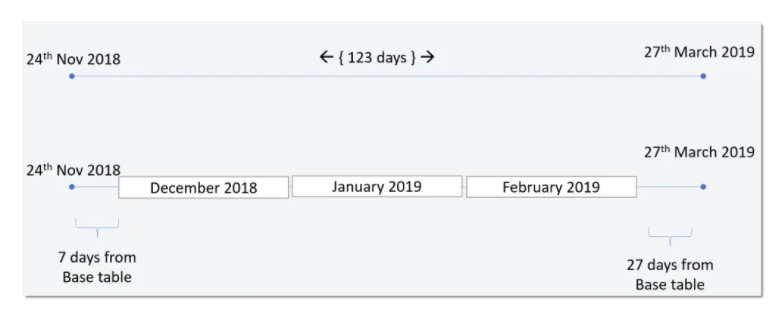
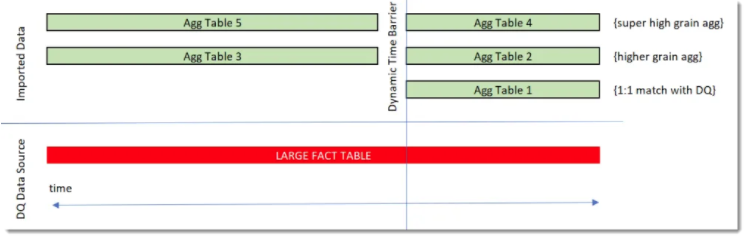
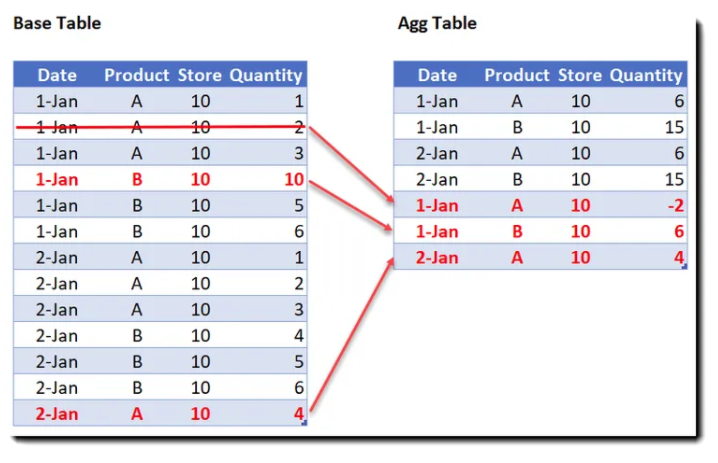
The Filtered Aggs would contain multiple Aggregation tables of the same data. But, each Agg table could contain different gains of data. For Example, data aggregated by Week, Month or Year.
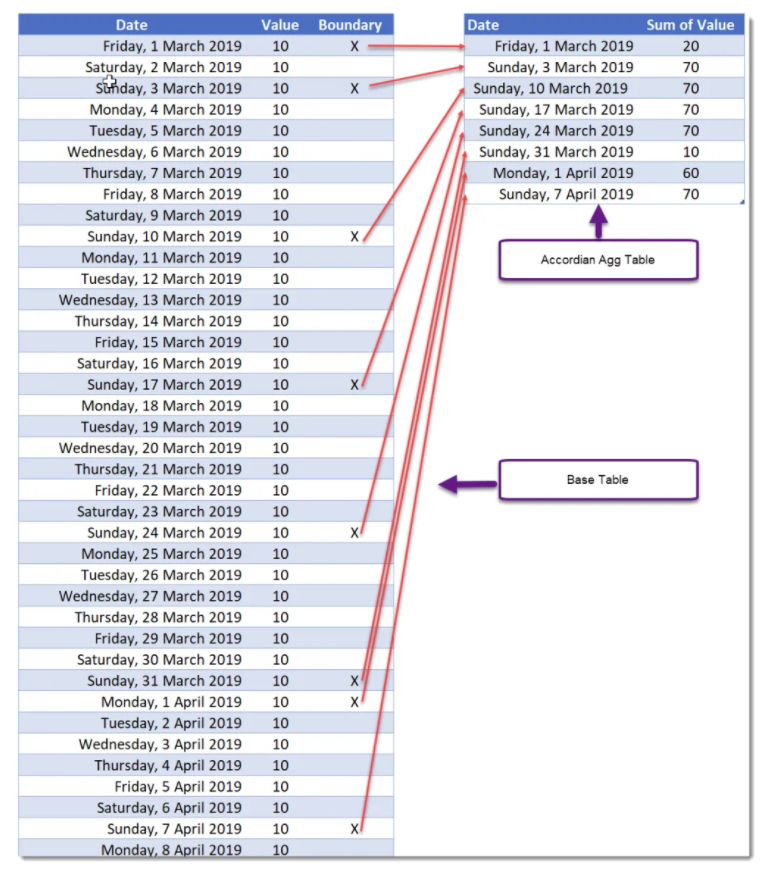
Finally, the Incremental Aggs. This type of aggregation would be used when aggregating transactions per day by store, and or product.
Thanks Phil
A special thanks to Phil for presenting. Since, we know you are a busy guy doing tons of great work. Thank you for taking time out of your day to present this wonderful topic. We hope you enjoy this exploration into Agg Tables.
If you like the content from PowerBI.Tips please follow us on all the social outlets. Stay up to date on all the latest features and free tutorials. Subscribe to our YouTube Channel. Or follow us on the social channels, Twitter and LinkedIn where we will post all the announcements for new tutorials and content.
Introducing our PowerBI.tips SWAG store. Check out all the fun PowerBI.tips clothing and products:
Well Microsoft has done it again. They have added a great feature in the Power BI desktop release for December 2020. Direct Query to Power BI data sources is a thing. As a result, this means we unlock new Architectural patterns.
Enterprise Modeling
In the Microsoft Release notes we get a glimpse of our new normal. Previously, Power BI datasets could only direct query certain data sources. Here is a full list of data sources for Power BI Desktop. The Enterprise Sematic model is simply larger view of a data model.
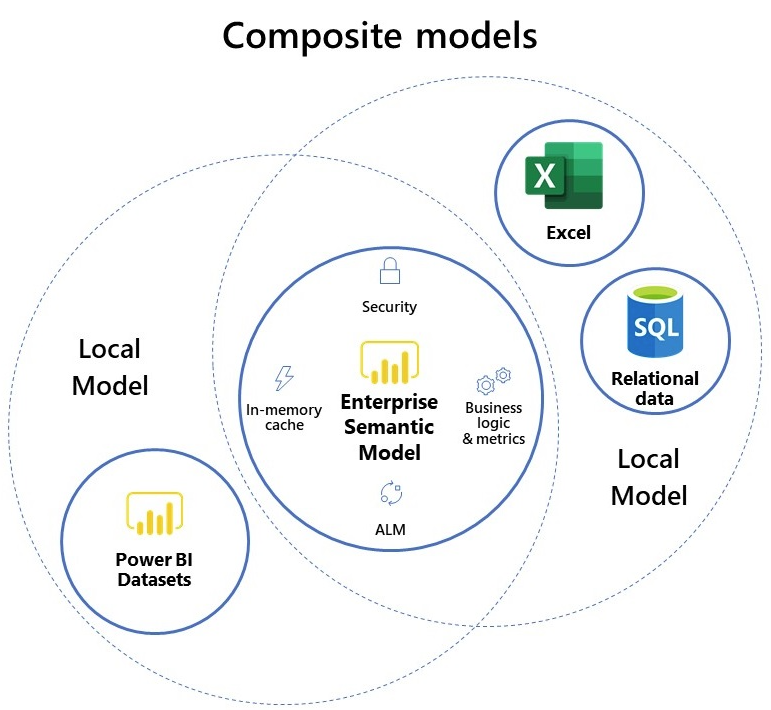
Quick background on Composite Models. A Composite model is a data model. More specifically, a Power BI data model. Typically Power BI models have multiple data sources. Such as, Excel, or SQL server. For certain data sources we load data in one of two ways, Importing, or Direct Query. The Import method loads data into the Power BI file. While, Direct Query leaves the data inside the data source, but sends queries to retrieve data on demand. Learn more about Import and Direct Query in these articles.
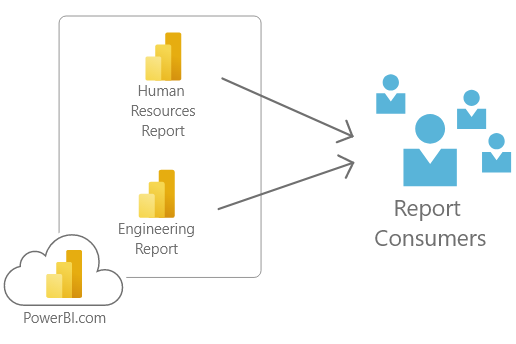
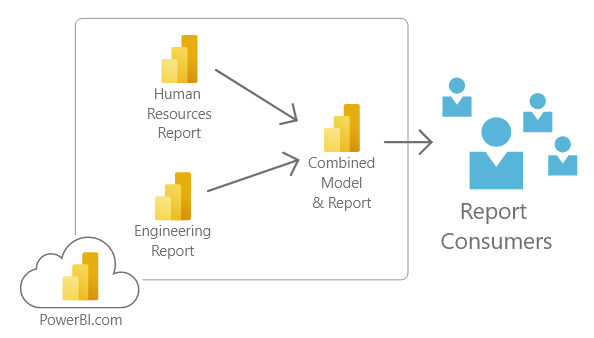
When we think of an organization there are likely hundreds of data models. These data models support by many different teams. Each model is solves some sort of problem. As an example, we can think about models developed for Human Resources. The Human Resource model informs the HR team about acquiring new talent, or track an interview process. Other teams such as Engineering track spend or project details.
Using this method, imagine a user who needs to see data from both human resources and engineering. Thus, a user would need to visit two different reports. Obviously value can given by combining multiple data models. This would enable the creation of a single report using data from both sources.
Direct Query for Power BI datasets
Now, lets consider the Enterprise Data model. In the Microsoft documentation this is called the Enterprise Semantic Model. We can think of the Enterprise Semantic Model as storing metadata linking tables of data and storing relationships between tables. Direct Query to PowerBI.com now lets us make models of models.
From our previous example now consider this architecture.
Report builders can now create a single model that queries other data models. This provides data from multiple subject matter areas. Thus, enabling a single report to combine data from multiple locations.
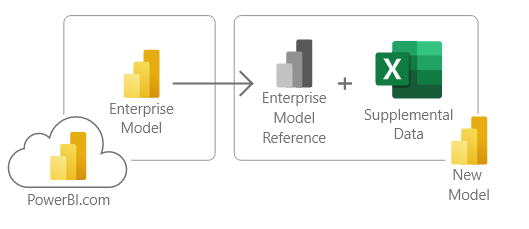
Centrally Managed Models
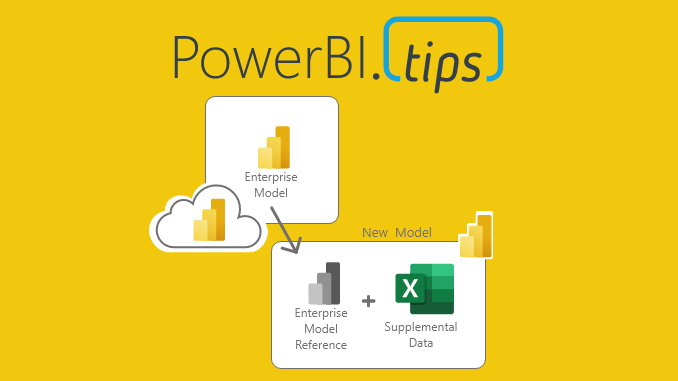
Often in larger organizations there will be different teams creating models. This means, you might not have access to modify an Enterprise build model. Again, Direct Query to models to the rescue. As a report author, I want to reuse an existing model. However, I would like to add more data to the model that would enrich my reporting. This may come in the form of a connected excel document. For this architecture consider the following diagram.
This new architecture is the ultimate success for self service business intelligence. Enterprise governed models can be enhanced by business users. Therefore, providing flexibility while controlling model governance and standards.
More Architecture thoughts
Power BI is evolving at a rapid pace. Because of this, Power BI is rapidly becoming one of the key tools. Therefore, more thought to Enterprise Architecture must be considered. Learn more about key architectural decision points in our previous articles, Data Architecture, and The Greater Data Solution.
Composite Models Conclusion
These are just some of my initial thoughts on this amazing new world we have. There will likely be many more designs and implementations from the community of Power BI developers. I’m extremely excited to see other patterns emerge from using Direct Query against Power BI datasets.
Read more from the official blog release and Microsoft documentation:
If you like the content from PowerBI.Tips please follow us on all the social outlets. Stay up to date on all the latest features and free tutorials. Subscribe to our YouTube Channel. Or follow us on the social channels, Twitter and LinkedIn where we will post all the announcements for new tutorials and content.
Introducing our PowerBI.tips SWAG store. Check out all the fun PowerBI.tips clothing and products:
Check out the new Merch!
Hasta La Vista Data
Go Ahead Make My Data
PBIX Hat
Power BI Swag Now Available
Now you can get your favorite Power BI gear. Visit our PowerBI.tips clothing store to purchase your favorite items.
This article will focus on Power BI architecture within a data solution. In this context, Power BI architecture describes how Power BI can slot in as a piece of this strategy. For instance, this includes not only the reports, but the data retrieval, storage and machine learning involved. Next, it discusses different roles and responsibilities involved. This can expand on Power BI skills, looking at the entire solution.
In addition, we hope it to provide ideas for current developers looking to expand Power BI skills or change directions in their career. It can provide a look at areas of need in organizations and give thought of learning opportunities available.
Power BI is Greater than a Report
In my previous article, I discussed how Power BI should not be thought of as a separate product to ETL, AI/ML or overall data strategy. Rather, organizations need to include Power BI architecture as part of a data culture with all of the products working in union.
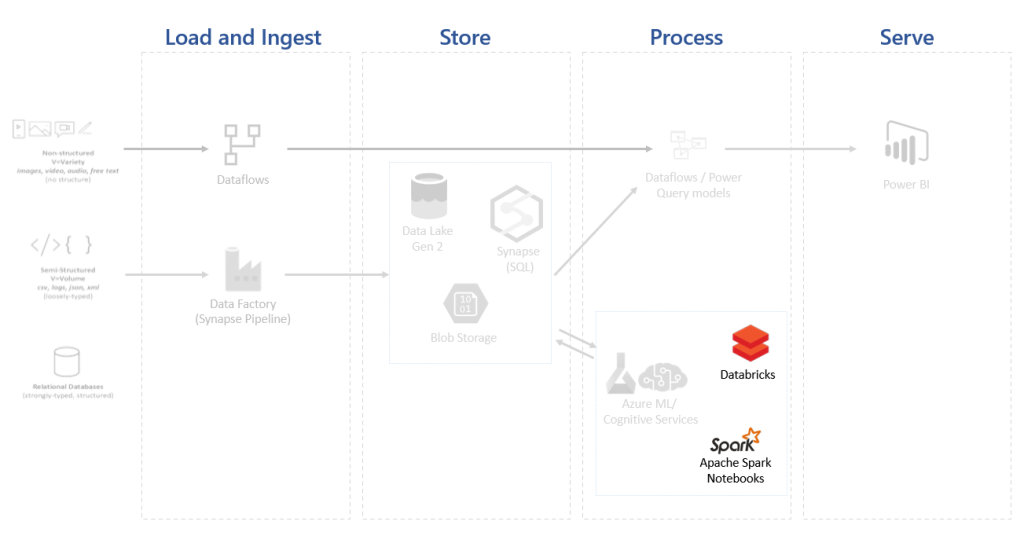
As a recap from the last article, a modern data platform typically has 4 steps:
Load and Ingest – extract the data out of the source system and transform it.
Store – Land this data somewhere so we can run analysis on it.
Process (or transform) – Run analytics on your data and draw out KPIs, AI and predictions.
Serve – present this data in an easily way for stakeholders to consume it.
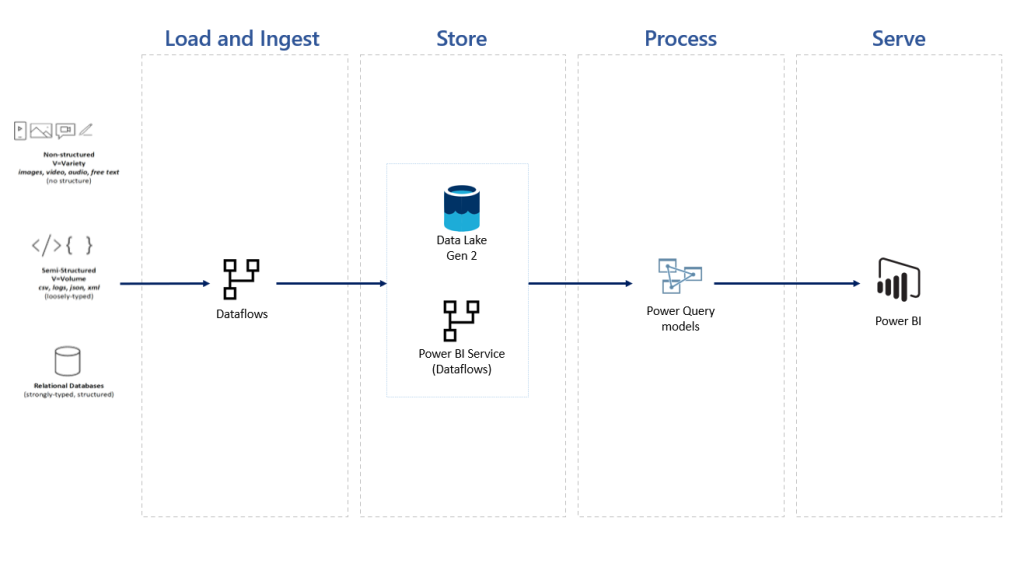
Medium Size – Power BI Services
It is possible to implement a reporting strategy entirely in Power BI. First, we can load data using dataflows. Next, these can be stored as a dataflow in the service or backed by Data Lake Gen 2 storage. It is good practice to separate our Power Query models and reports.
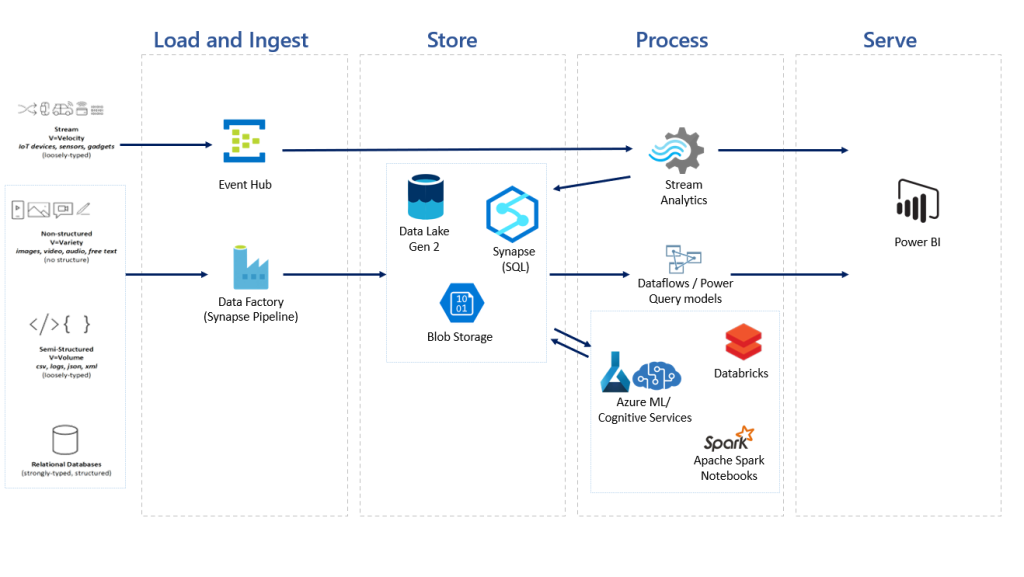
Large Size – Azure Services
Sometimes, we want to use more services than just Power BI. This may be due to huge datasets, use of data in other applications, or writing custom machine learning. The above diagram shows an enterprise scale reporting solution. Azure data factory can move and transform the data. Afterwards, we can store in a variety of storage options, depending on the nature of the data. Many options are available to run machine learning on the data. This ranges from custom code to autoML. Lastly, we create data models and we can produce reports off them. This integrates the Power BI architecture into a whole reporting solution. There is also a path for streaming data – through Event hub and Stream analytics.
Azure has a host of services available. If you are new to these, it can seem a lot to learn. Luckily, Microsoft are rolling out Synapse! This includes a portal that houses many of these services, enabling you to use them all in a single place. If interested, Nicola Ilic I has a great series on Synpase and Power BI.
Different Roles in a Data Solution
If we want to design a data culture, we often need more roles and skills than just designing reports. The below list looks to identify some different roles and responsibilities in a data solution. This is not intended to be a fully comprehensive list. Rather, we explore some different and common roles that could be involved within a project.
It is unlikely a single project will require all roles. Usually, one person may take on two or more of these roles. Instead, the aim is to distinguish different areas of the data strategy. This can help us to view Power BI in the bigger picture, seeing where it fits in.
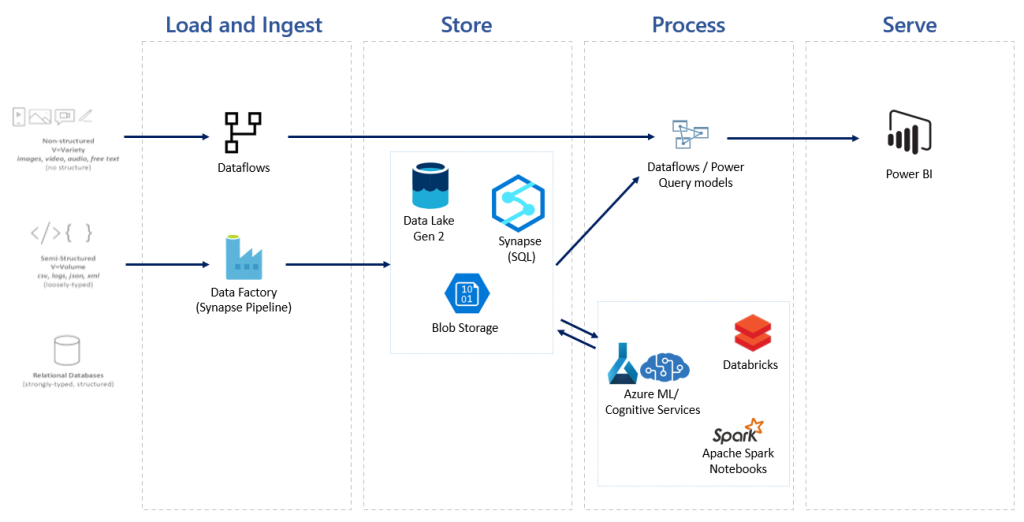
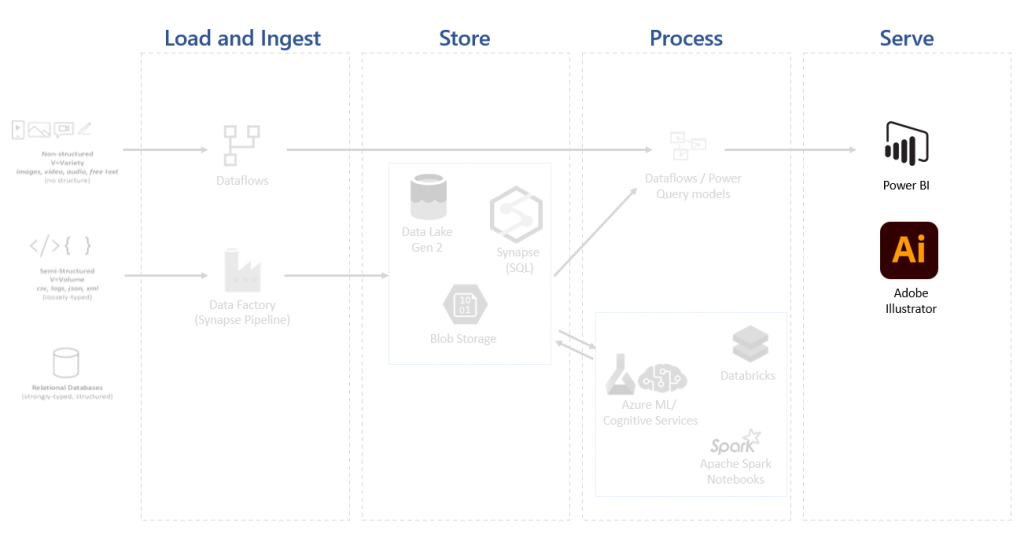
We will look at the following architecture – a company that uses Synapse as well as dataflows. For simplicity, we are not looking at any streaming reports. In this diagram the dataflows storage is implied to make the diagram easier to understand.
Each role will look at some common responsibilities and skills. It will also highlight the area in the above architecture diagram that they are responsible for.
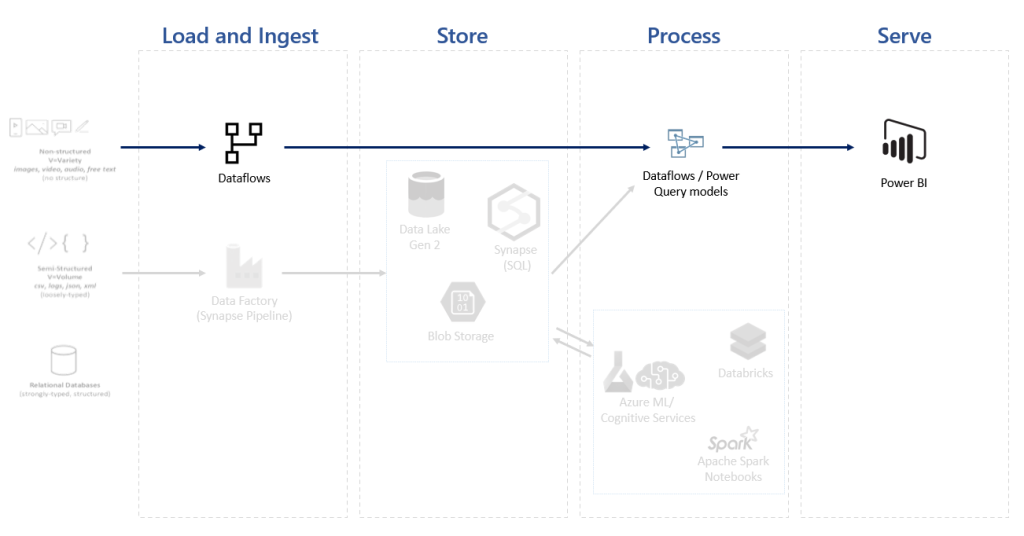
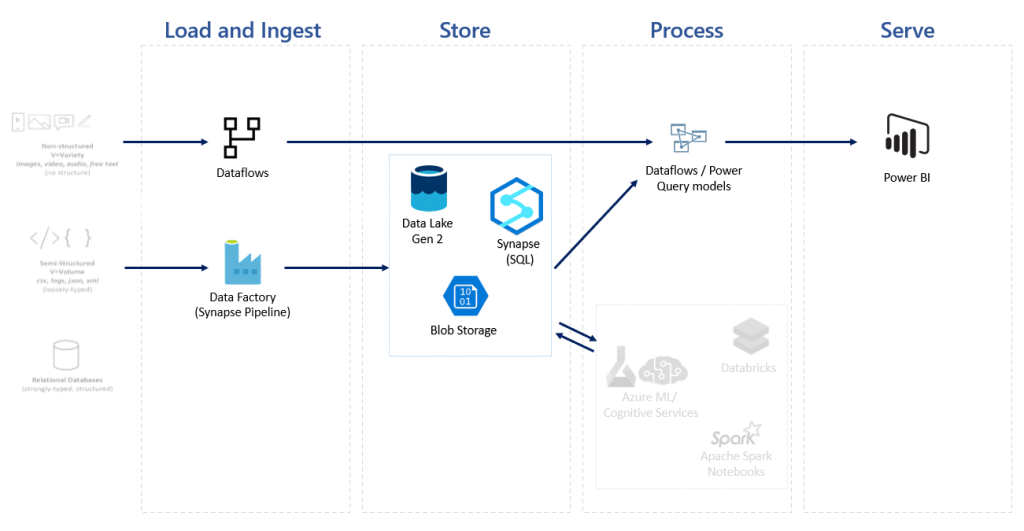
Power BI Developer
The Power BI Developer is responsible for building and owning data models for KPI and user reports. Therefore they will spend large parts of their time modeling and transforming data in Power Query or dataflows. In addition, a BI developer has good understanding of tabular models and how to write custom business logic in DAX. They may also be required to set up the Power BI architecture.
Skills
Expert in Power Query and DAX. Familiarity in tabular editor and DAX Studio. Plus knowledge on database designs and tabular modeling such as implementing good STAR schema. Great Power BI skills and ability on Power BI desktop.
Roles of a Power BI developer
UI/UX Engineer
In larger projects, report design can benefit from a UI/UX specialist. Power BI developers will often complete this, but specialists can be brought in to help design layouts, flow and brand consistency within the project. Usually, the Power BI developer will look after the models and logic. However, the UI/UX Engineer helps make sure the final reports are professional looking. In addition, they can be involved in storyboarding the design of reports. A UI/UX specialist is needed for projects with many reports, external facing reports or embedded solutions.
Skills
Design skills as in products such as Adobe Illustrator. Dashboard design (such as gestalt principles).
Roles of a UI/UX developer
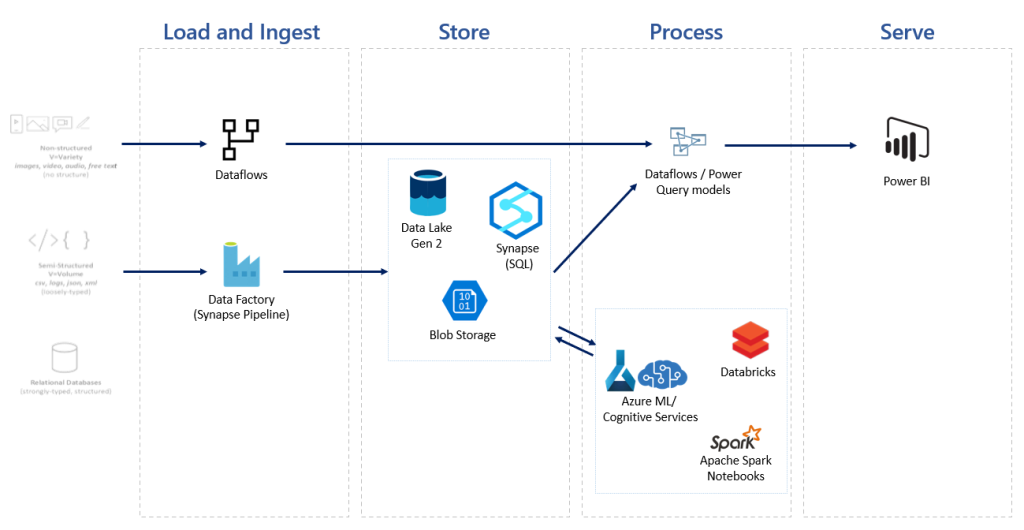
Data Engineer
A Data Engineer is responsible to get the data from the source and load it into Power BI. Smaller reporting projects may use only dataflows or power query, but larger ones might require more steps. The Data Engineer will move the data using tools such as data factory into a SQL database or Synapse storage. This allows larger enterprise solutions with massive volumes of data, or for complex machine learning to be performed on the data. In addition, Data Engineers will transform and clean the data making it suitable for reporting analysis or machine learning. They will then integrate this back into the solution.
Skills
Tools such as Azure Data Factory, Stream Analytics, Data Lakes or other data storage. In some projects a Data Engineer might work exclusively with dataflows or Power Query. Databricks, Spark Analytics and SQL are important for prepping and transforming big data. Engineers also can benefit from automating in languages such as PowerShell. Strong Power BI skills.
Roles of a Data Engineer
Data Architect
Data Architects are responsible for designing, managing and maintaining the reporting solution. Architects will suggest the best selection of tools and methods used. They would be the ones to recommend the team involved, the technologies used and the correct approach. Overall, they will set up the Power BI Architecture and machine learning solution.
Skills
Architects need to have vast knowledge and experience across all the technologies that can be used. This includes deep knowledge on Azure or Synapse, Power BI and data governance methodologies. They have solid understanding how machine learning can be integrated into a solution.
Roles of an Data Architect
AI Engineer
You may incorporate an AI Engineer in large projects that have a machine learning focus. Data Scientists spend large amounts of time writing custom algorithms. In contrast, AI Engineers use tools such as Azure cognitive services or Azure machine learning studio. On large projects they may work in tandem with Data Scientists helping to merge their code into the reporting system. They often spend time cleaning, transforming and prepping data. In many cases, this job is regularly undertaken by Data Engineers. However, projects with a heavy AI focus may benefit on having an AI Engineer or both a Data and AI Engineer.
Skills
While AI Engineers may not write custom algorithms from scratch, they need a solid understanding of machine learning principles. They also need to know how to prepare and clean data ready for machine learning solutions.
Roles of an AI Engineer
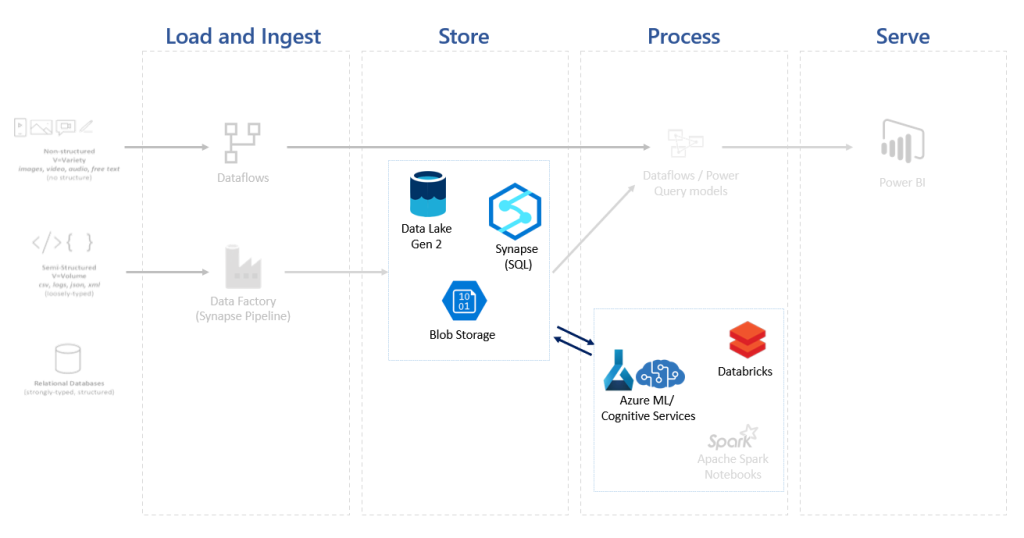
Data Scientist
The data science field has exploded in popularity over the recent years. Typically, a Data Scientist will spend their time cleaning, prepping and analyzing large volumes of data. Next, they write custom algorithms that can detect deeper insights. A Data Scientist often has years of experience and training coming from various backgrounds. Data Scientists write custom code in Synapse, Databricks or Apache Spark notebooks.
Skills
Expert in an analytical programming language, typically R or Python. They will have a unique blend of programming skills and statistics. Deep knowledge of designing and implementing different machine learning algorithms. In addition, they will be proficient at cleaning and preparing data.
Roles of a Data Scientist
Conclusion
As we can see, there can be many different roles involved in a data solution. Many times, one must wear many hats. Other times, organizations can benefit from having several specialists in different areas.
Microsoft is looking to unify the Power BI architecture and overall data solution through Synapse. This portal will make these roles easier to be completed by fewer people within the same portal. Still, there will always be a need for specialists. So if you are looking to expand your power bi skills, or finding new areas to expand into, make sure you familiarize yourself with these.
If you like the content from PowerBI.Tips please follow us on all the social outlets to stay up to date on all the latest features and free tutorials. Subscribe to our YouTube Channel. Or follow us on the social channels, Twitter and LinkedIn where we will post all the announcements for new tutorials and content.
Introducing our PowerBI.tips SWAG store. Check out all the fun PowerBI.tips clothing and products:
Manage Consent
To provide the best experiences, we use technologies like cookies to store and/or access device information. Consenting to these technologies will allow us to process data such as browsing behavior or unique IDs on this site. Not consenting or withdrawing consent, may adversely affect certain features and functions.
Functional
Always active
The technical storage or access is strictly necessary for the legitimate purpose of enabling the use of a specific service explicitly requested by the subscriber or user, or for the sole purpose of carrying out the transmission of a communication over an electronic communications network.
Preferences
The technical storage or access is necessary for the legitimate purpose of storing preferences that are not requested by the subscriber or user.
Statistics
The technical storage or access that is used exclusively for statistical purposes.The technical storage or access that is used exclusively for anonymous statistical purposes. Without a subpoena, voluntary compliance on the part of your Internet Service Provider, or additional records from a third party, information stored or retrieved for this purpose alone cannot usually be used to identify you.
Marketing
The technical storage or access is required to create user profiles to send advertising, or to track the user on a website or across several websites for similar marketing purposes.