
In podcast #286 we take the time to review an older video of John Cleese giving a talk about the Creative Process in Management. We thought this would be an outstanding conversation to draw parallels to the Business Intelligence world. There are so many different areas we can apply creative thinking in implementing Fabric & Power BI solutions.
You can check out that video by John Cleese here -> https://youtu.be/Pb5oIIPO62g?si=66KNV2I8p5ZlESzz
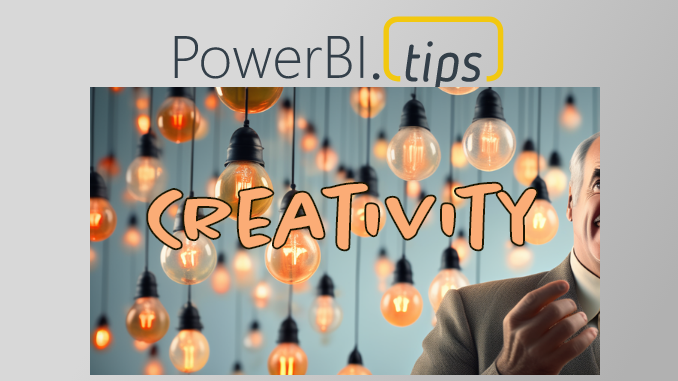
Episode 286 – Creativity in Power BI
Talking Points:
- What is Creativity, and what strategies can we use to be more creative?
- Discussion centered around the concept of being creative in handling data, building reports and fostering a data culture.
- Emphasize that creativity is not a talent but a mode of operation and discussed its relevance in the field of Business Intelligence.
Key Topics:
Where does creativity lie:
- Discussed the distinction between open and closed states.
- Strategies to foster creativity and measure its benefits.
- Dedicated time for creative thinking, challenging the conventional to-do list approach.
- Creating an oasis of quiet for pondering and problem-solving.
- Embracing humor as a catalyst for transitioning from closed to open thinking.
Overcoming Barriers:
- Identifying common obstacles to creativity within organizations dealing with technology and data.
- Evaluating the balance between analytical rigor and creative exploration in Power BI.
Applications and Tips:
- Exploring creativity in the adoption of BI practices, report building, and its application in day-to-day operations.
- Building reports with an open mindset.
- Allowing time for pondering before making decisions.
- Encouraging positive collaboration within a community.
- Applying the “art of the possible” by exploring new ideas.
Meeting Creativity:
- Examining the impact and value of injecting creativity into BI processes for organizational growth.
- Introducing humor in meetings to foster creativity.
- Building on ideas without fear of right or wrong.
- Utilizing random connections for innovative solutions.
- Creating a positive environment by avoiding negativity.
Report Building Process:
- Front-loading creativity in requirements gathering.
- Incorporating creative thinking in model design and building calculations for visuals.
This podcast episode is a treasure trove of insights for BI professionals looking to infuse creativity into their work, ultimately contributing to more innovative and effective business intelligence solutions. You can listen to the full conversation on the Explicit Measures podcast here:
As a special add-on for your enjoyment Tommy came up with a whole slew of jokes in the same vein that John Cleese told in the presentation. Feel free to use them in your next creative meeting!
Jokes Created by Tommy Puglia:
How many data scientists does it take to change a light bulb?
Three. One to replace the bulb, and two to model whether it was the most cost-effective light bulb choice.
How many machine learning experts does it take to change a light bulb?
Just one, but it will take thousands of tries to learn how to do it properly.
How many business analysts does it take to screw in a light bulb?
Two. One to assure everyone that everything is going according to the plan while the other screws the bulb into the water faucet.
How many BI consultants does it take to screw in a light bulb?
Only one, but they’ll first conduct a cost-benefit analysis to determine if the light bulb change will add value.
How many marketing analysts does it take to change a light bulb?
One, but they’ll also rebrand the room to make it look brighter.
How many sales analysts does it take to change a light bulb?
Just one, but they’ll convince you to upgrade to a smart bulb with a subscription plan.
How many data warehouse architects does it take to change a light bulb?
Two: one to change the bulb and another to ensure it integrates seamlessly with the existing lighting infrastructure.
How many AI developers does it take to change a light bulb?
They won’t. They’ll train a neural network to predict when the bulb will burn out and preemptively send a drone to replace it.
How many cloud storage experts does it take to change a light bulb?
None. They’ll just store light in the cloud and access it as needed.
How many Business Analysts does it take to screw in a light bulb?
Just one, but they will first interview everyone in the room to define the requirements for the ‘ideal light’ experience.
How many Data Analysts does it take to change a light bulb?
Two. One to replace the bulb, and the other to tell everyone how much brighter it could be with just a few more data points.
How many stakeholders does it take to change a light bulb?
Four. One to ask for a greener bulb, one to demand a cost-effective solution, one to insist on a smart bulb, and one to question why the bulb needs changing at all.
How many report requesters does it take to change a light bulb?
None. They’ll just ask for a daily report on the status of the light bulb but never actually replace it.
How many Data Analysts does it take to screw in a light bulb?
One, but by the time they’ve finished analyzing the best method, the technology for light bulbs has already changed.
How many stakeholders does it take to change a light bulb?
Five. One to change it and four to form a committee that debates whether it was better the old way.
How many report requesters does it take to change a light bulb?
None. They just keep requesting status updates on the darkness.
How many BI Consultants does it take to screw in a light bulb?
Two. One to assure the client that they’re leveraging cutting-edge lightbulb technology, and the other to outsource the actual screwing in to an intern.
How many BI Consultants does it take to change a light bulb at a large corporation?
An entire team, but the project will take three years and by the end, they’ll switch to a completely different kind of bulb.