Tag: Advanced Editor

  • Handle Errors in Data Refreshes with Power Automate

    Handle Errors in Data Refreshes with Power Automate

    This article examines using the advanced editor in Power Query to better handle when things go wrong. It will also allow custom actions to be triggered using Power Automate, allowing the rest of the data to be refreshed while alerting the owner by email of data source errors.

    Note that this article requires edit Power Query (M) code. If you want to review this, consider reading this article:
    Query Editor – Editing M Code

    Data Sources

    Data can be messy. Thankfully, Power Query has given us an excellent and efficient way to extract, transform and load the data to manipulate it to the way we want it. It is extremely versatile and can connect to a huge host of data sources. These can include third party sources as well as internal data.

    While beneficial, we need to ask what happens if the third-party source suddenly shuts down or changes its access policies. What if there is bad data recorded in the on-premise excel sheet or databases? An error in any Power Query step can stop the entire report refreshing. We can opt to receive alerts on the service, but these can be unspecific and require us to dig deep into the report.

    The technique laid out here allows to receive a specific alert of the exact step the error occurred. What’s more, we can ensure it won’t break our queries and continue to refresh the rest of the data.

    Step 1 – Base Query

    First we need to set up the query that we want to error handle. For this example, I’m going to send a web request to get some information about the Microsoft stock price. For more information on this API or to pull other stock data, check out this article.

    Open Power Query and Select the New Source > Web on the Home ribbon.

    Paste the following link:

    https://query1.finance.yahoo.com/v8/finance/chart/MSFT?range=5y&interval=1d

    This will automatically return a JSON object and parse it for us.

    Note: This link returns 5 years of daily daily historical stock price.

    For simplicity, I will just return the meta data to ensure the API call is working. The automatic parsing will return a table with clickable elements. To explore into the JSON we, click through the following steps:

    chart:Record > result:list > Record > Meta:Record

    Note: See sample of nested structure below for chart:Record

    Once we have expanded all the way down to the Meta level, Press the Convert Into Table Button found on the newly appeared Convert ribbon.

    Here is the final code, which you can see by Clicking the Advanced Editor button on the Home ribbon revealing the advanced editor:

    let 
        Source = Json.Document(Web.Contents("https://query1.finance.yahoo.com/v8/finance/chart/MSFT?range=5y&interval=1d")),
        chart = Source[chart],
        result = chart[result],
        result1 = result{0},
        #"meta" = result1[meta],
        #"Converted to Table" = Record.ToTable(#"meta")
    in
        #"Converted to Table
    

    Rename this “Stock Query” by editing the name in the properties pane on the right.

    Step 2 – Create the flow

    Next we create the Power Automate flow that will alert us something is wrong. Navigate to the Power Automate website. Once logged in, Click on the new Instant flow button.

    Give the flow an appropriate name. For the trigger, select the option When an HTTP request is received. Next press the button Create to make the flow.

    Once we save the flow will supply us with a URL. This URL will trigger the flow any time it is visited. You can use any action you want, but I will have the flow send me an email to let me know the refresh failed.

    I’ll search for the item Send an email (V2). Make sure you fill in the email address you want to send it to, and write an appropriate message and subject.

    That’s our flow! Hit Save. After you have saved, click on the When a HTTP request is received step to expand it. You’ll see that a URL has been generated. Copy the link using the Copy button on the right. You’ll need this to enter it into Power BI.

    Step 3 – Make the Flow Trigger Query

    Next, set up the query in Power BI to call this flow. In Power Query, make a new query by selecting New Source > Web. Paste in the Web URL you copied in the previous step. Open the advanced editor. Inside you see the code uses the Web.Contents() function. You’ll need to copy this code in a later step.

    This will send an email as it runs the query. For testing, if you press the Refresh Preview icon, you can trigger the actions to run again. If you don’t want to wait for the email or chose a different action, you can check if the flow ran by checking it on the power automate site. Click My Flows on the left, open the flow and scroll down to Runs.
    Press the refresh button on the runs section to check when the flow ran.

    Step 4 – Set up the Error Handling Code

    Now we need to add the logic to have the Power Automate run on error, which is going to take a little coding.

    Back in Power Query, start by adding a blank query by clicking New Source > Blank Query on the Home Ribbon.
    Next, open the Advanced Editor and the code should look like this:

    Now we will employ the try … otherwise statement. This is Power Query’s error handing statement. We can add a placeholder for now.
    Replace the step:

    Source = "" 

    with the following code:

    Source = try 1+1 otherwise “error”

    How this works

    Any code between the try and otherwise keywords will be attempted to be executed. If this is successful, the result will be returned and the next step will be evaluated, in this case the number 2. If this returns an error, however, the result will be discarded and the query after the word otherwise will be returned, in this case the word “error” .

    We can add this statement as the Source step. I’ll also wrap both statements in parenthesis as this will come in handy as we add more steps. It’s important to keep good syntax to make it readable, so here is my code:

    As 1+1 is valid, this will return the value 2. If you change the 1+1 to 1+“A”, this is not valid so it will return the word error.

    Now we can see its working, delete everything between the parenthesis in both the try and otherwise statement to set up for the next step. Do not worry if you get an error as we will be adding code to it.


    Step 5 – Update the Error Handling Code

    Now we’ve got the placeholder set up we can copy our previous code into each step.
    Open the Stock Query we made in steps 1 and 2.
    Click Advanced Editor and copy the entire code.
    Now, come back to the try..otherwise query.
    Open the advanced editor in this step and make sure you delete anything between the parenthesis in the try statement if you did not before.
    Paste the entire code you just copied.

    Next, go to the Flow Error Query, open the advanced editor and copy all the text.
    Go back to the try..otherwise and paste everything between the two parenthesis for the otherwise statement.

    Step 6 – Tidying the Code Up

    The URLs are prone to change so it is code practice to separate them as a variable. To do this, you can simply state them at the beginning of the query as a step.
    Here, add the URLs to variables called WebURL and FlowURL.
    To add WebURL, at the beginning of query after the let keyword, add the line:

    webURL = "https://query1.finance.yahoo.com/v8/finance/chart/MSFT?range=5y&interval=1d",

    Don’t forget the comma at the end. Do the same with the FlowURL. Then, replace the URLs with the variable name.

    Additionally, it will help to change the word Source outside the try..otherwise to Output. This makes it easier to follow, as we have several steps called source. Also update it after the keyword in.

    Output:

    Final code to copy (you will need to update to your correct URLS):

    let
        flowURL ="https://prod-68.westus.logic.azure.com:443/workflows/ RestofURL",
        webURL = "https://query1.finance.yahoo.com/v8/finance/chart/MSFaaT?range=5y&interval=1d",
        
        Output =   
        try 
        (
            let 
                Source = Json.Document(Web.Contents(webURL)),
                chart = Source[chart],
                result = chart[result],
                result1 = result{0},
                #"meta" = result1[meta],
                #"Converted to Table" = Record.ToTable(#"meta")
            in
                #"Converted to Table"
        )
        otherwise    
        (
            let
                Source =  Web.Contents(flowURL)         
            in
                Source
        ) 
    
    in
        Output
    

    Optional Step 7.1 – Adding POST Parameter – Flow

    Now we have set up our workflow, it may be useful to reuse this on multiple datasets. Instead of setting up a different flow for each dataset, we can allow the flow to accept inputs, such as the dataset name.

    Navigate back to Power Automate site and on the flow set up previously, click edit.

    Open the step and paste in the following code into Request body JSON.

    {
        "type": "object",
        "properties": {
            "datasetName": {
                "type": "string"
            }
        }
    }

    Next, expand advanced options and change it to POST.

    This will create a variable called datasetName. This is the name of the dataset we will pass from Power BI. We can use datasetName in the email to inform us which dataset had an error. The variable will appear in a list when you click to edit the email message – click on the name to add it.

    In addition, I added the expression utcNow(). You can find this by searching in the Expression tab of the pop up. This just displays the time it is sent. Thus we can see in the email when it failed. Notice the variable from the first step is green, while the expression is pink.
    Personalize this message as you wish.

    Optional Step 7.2 – Adding POST Parameter – Power BI

    The final step is to pass this in from Power BI. In our query, open the advanced editor and add three more parameters before webURL and flowURL:

        datasetName = "Stock Query",
        content = " { ""datasetName"": """ & datasetName & """}",
        headers = [ #"Content-Type"="application/json"],
    

    dataset name is the name of the datset we pass into the flow and ultimately appear in the email. Right now it’s set to Stock Query, but this is what we can edit for each dataset we use this query to pass a different name.

    content and headers build the correct format to pass into the API call. This will create a POST request and provide the correct format.

    Now we can edit the Web.Contents(webURL) step to include our parameters:

    Source =  Web.Contents(flowURL, [Headers = headers, Content=Text.ToBinary(content)])  

    Final output:

    Final code to copy (you will need to update to your correct URLS):

    let
        datasetName = "Stock Query",
        content = " { ""datasetName"": """ & datasetName & """}",
        headers = [ #"Content-Type"="application/json"],
        flowURL ="https://prod-68.westus.logic.azure.com:443/workflows/RestofURL",
        webURL = "https://query1.finance.yahoo.com/v8/finance/chart/MSFaaT?range=5y&interval=1d",
        
        Output =   
        try 
        (
            let 
                Source = Json.Document(Web.Contents(webURL)),
                chart = Source[chart],
                result = chart[result],
                result1 = result{0},
                #"meta" = result1[meta],
                #"Converted to Table" = Record.ToTable(#"meta")
            in
                #"Converted to Table"
        )
        otherwise    
        (
            let
                Source =  Web.Contents(flowURL, [Headers = headers, Content=Text.ToBinary(content)])         
            in
                Source
        ) 
    
    in
        Output
    

    Limitations and Considerations

    This technique uses premium Power Automate features and a valid license is required. However, only one service account license is needed.

    This query has been designed to return blank data if the query fails. This could break your model if this data is required.

    This blog does not examine securing the Power Automate endpoint, so be aware if the URL was discovered people could execute the end action (in this case sending an email).

    If you like the content from PowerBI.Tips please follow us on all the social outlets to stay up to date on all the latest features and free tutorials.  Subscribe to our YouTube Channel.  Or follow us on the social channels, Twitter and LinkedIn where we will post all the announcements for new tutorials and content.

    Introducing our PowerBI.tips SWAG store. Check out all the fun PowerBI.tips clothing and products:
    Store Merchandise

  • Crazy Table Gymnastics – Part 2 – Build Support Materials

    Crazy Table Gymnastics – Part 2 – Build Support Materials

    This is part 2 in the 3 part series on developing super cool tables using some fancy measures.  In part 1 we walked through how to build a table that uses an un-pivoted data source in the Query Editor.  This technique allows you to change the types of categorical values in a table.  If you missed part 1 and want to get caught up follow this link.  Now, continuing with the series, Part 2, we will build the supporting materials (Selector Table, What If Slicers, and measures) for the report.

    Once we are done the final product will look like the following:

    Part 2… Go.

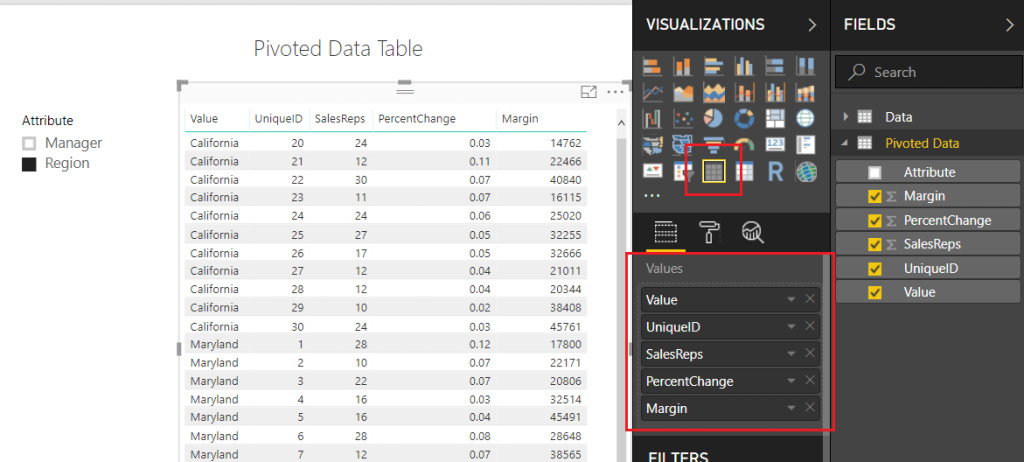
    To make sure we are starting off on the correct step.  We left off part 1 when we had completed a Pivoted Data Table and included an Attribute Slicer that would allow us to toggle between the Manager and Region Categories.  Your table should look like the following diagram:  (If you don’t have this you might want to start with Part 1 found here)

    Pivoted Data Table
    Pivoted Data Table

    Note: I have also included a Slicer which is used with the Attribute field.

    Next, we will need to add a table that will allow us to use the SalesReps, PercentChange, and Margin column headers in our report.  On the Home ribbon click Edit Queries, then select New Source on the Home ribbon.  In the Get Data window select Blank Query, click Connect to proceed.  Open the advanced editor by clicking the Advanced Editor button found on the Home ribbon.  Enter the following M code into the Advanced Editor:

    let
       Source = #"Pivoted Data",
       #"Kept First Rows" = Table.FirstN(Source,1),
       #"Removed Columns" = Table.RemoveColumns(#"Kept First Rows",{"Attribute", "Value", "UniqueID"}),
       #"Unpivoted Columns" = Table.UnpivotOtherColumns(#"Removed Columns", {}, "Attribute", "Value"),
       #"Removed Columns1" = Table.RemoveColumns(#"Unpivoted Columns",{"Value"})
    in
       #"Removed Columns1"

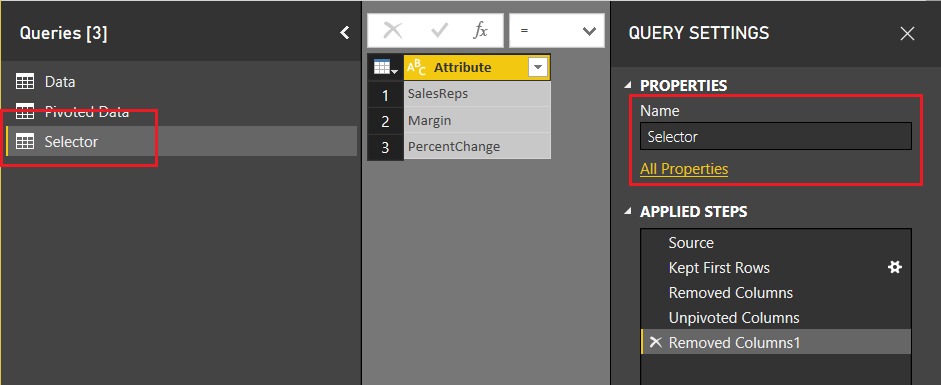
    Click Done to close the Advanced Editor.  Rename the table to Selector.  When you are finished your table should look like the following:

    Create Selector Table
    Create Selector Table

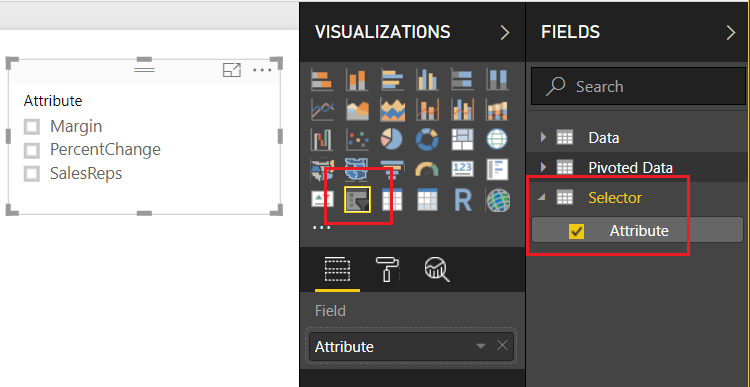
    Click Close & Apply on the Home ribbon to close the Query Editor.  Add a slicer with the following selections:
    Add Selector Attribute Slicer
    Add Selector Attribute Slicer

    Now, we want to detect which of the Attributes have been selected from this table.  We can accomplish this by creating a measure using the DAX function SELECTEDVALUE.  Right Click on the table named Selector and from the drop down select New Measure.  Enter the following DAX equation:
    rankBy = SELECTEDVALUE(Selector[Attribute])

    In addition to the knowledge of which column was selected from the selector table, we will also want to detect to make sure at least one categorical value has been selected.  The categorical values we are talking about were generated earlier.  The values could be either the Manager or Region values of the Attribute column in the Pivoted Data table.  Using the ISFILTERED DAX function enables this section.  Add the following measure to the Pivoted Data table:

    Attribute Filtered = ISFILTERED('Pivoted Data'[Attribute])

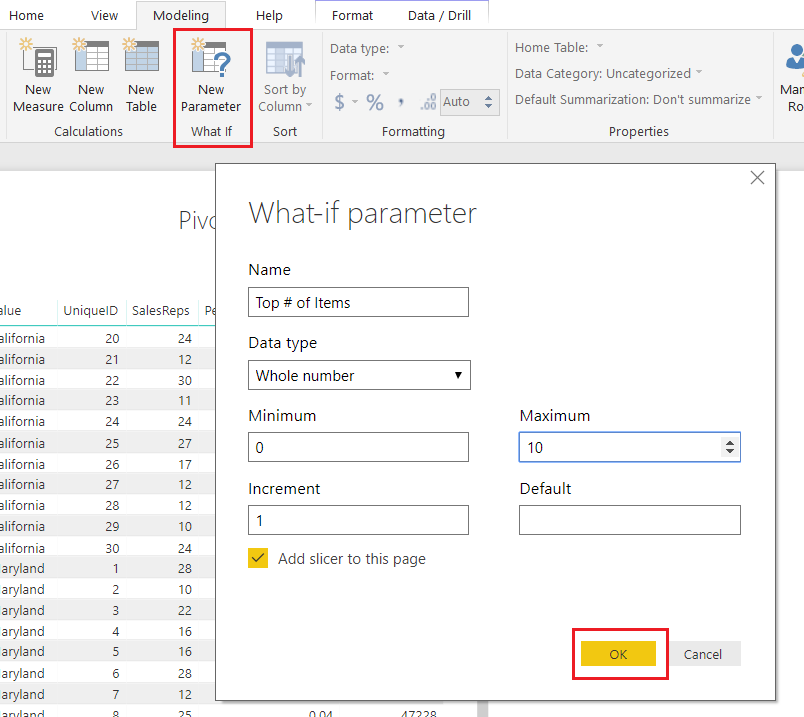
    Next, we need to gather some user input in the form of a number from 1 to 10.  To input this information we need to produce a What If Parameter.  On the Modeling ribbon click New Parameter in the What If section of the ribbon.  Enter the following information into the What-if parameter dialog box:

    What If Parameter
    What If Parameter

    Note: Don’t forget to change the Name of the parameter.

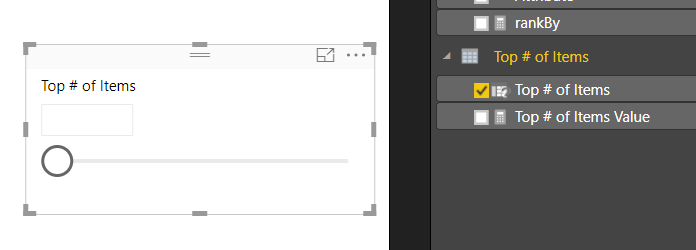
    Click OK to proceed.  Power BI will automatically produce a measure table, a measure and a slicer on the report page.

    Slicer Produced by What-if
    Slicer Produced by What-if

    Note: By default there is nothing selected in the box.  However, you can adjust the slicer and a number will appear within the value box.  You can also type in a number between 1 and 10 to the box to adjust the value.

    This is where we go crazy with DAX.  This portion of DAX is where all the magic happens.

    We start off by building our totals measures.  Place all these measures in the Pivoted Data table.

    Total % Change = MAX( 'Pivoted Data'[PercentChange] )
    Total Margin = SUM( 'Pivoted Data'[Margin] )
    Total SalesReps = SUM( 'Pivoted Data'[SalesReps] )

    These will be used repeatedly in our next group of DAX formulas.

    The following measures will produce a calculated ranking for each numerical column.  OK, Pause, This part really excites me here because the next few measures are where the magic happens.  Pay close attention to what is happening here.  Un-Pause, by using the DAX Switch function we can dynamically tell Power BI to adjust which column we want to see ranked by the top items.  For example, if we select SalesReps in our attribute slicer.  The following measures will automatically rank all the items in the table by the column named SalesReps.  Thus, the items with the highest counts of SalesReps will be listed first.  When you select Margin, the table will automatically adjust and re-rank the items by the Margin column.  This is being done in the switch statement.  For each column we are calculating custom rankings and then hiding or replacing values with the Blank() DAX function to not show items we don’t want.

    Enter the following three measures into the Pivoted Data Table:

    Rank Margin = if( [Attribute Filtered],
        SWITCH( [rankBy]
            ,"Margin", CALCULATE( [Total Margin], FILTER('Pivoted Data', RANKX( ALLEXCEPT('Pivoted Data','Pivoted Data'[Value]), [Total Margin]) <= [Top # of Items Value]) )
            ,"PercentChange", CALCULATE( [Total Margin], FILTER('Pivoted Data', RANKX( ALLEXCEPT('Pivoted Data','Pivoted Data'[Value]), [Total % Change]) <= [Top # of Items Value]))
            ,"SalesReps", CALCULATE( [Total Margin], FILTER('Pivoted Data', RANKX( ALLEXCEPT('Pivoted Data','Pivoted Data'[Value]),[Total SalesReps]) <= [Top # of Items Value]))
        )
        , BLANK() )
    
    Rank PercentChange = if( [Attribute Filtered],
         SWITCH( [rankBy],
           "PercentChange", CALCULATE( [Total % Change], FILTER('Pivoted Data', RANKX( ALLEXCEPT('Pivoted Data','Pivoted Data'[Value]), [Total % Change]) <= [Top # of Items Value]))
           ,"Margin", CALCULATE( [Total % Change], FILTER('Pivoted Data', RANKX( ALLEXCEPT('Pivoted Data','Pivoted Data'[Value]), [Total Margin]) <= [Top # of Items Value]))
           ,"SalesReps", CALCULATE( [Total % Change], FILTER('Pivoted Data', RANKX( ALLEXCEPT('Pivoted Data','Pivoted Data'[Value]), [Total SalesReps]) <= [Top # of Items Value]))
        )
        , BLANK() )
    
    Rank SalesReps = if( [Attribute Filtered],
        SWITCH( [rankBy]
            ,"SalesReps", CALCULATE( [Total SalesReps], FILTER('Pivoted Data', RANKX( ALLEXCEPT('Pivoted Data','Pivoted Data'[Value]), [Total SalesReps]) <= [Top # of Items Value]))
            ,"Margin", CALCULATE( [Total SalesReps], FILTER('Pivoted Data', RANKX( ALLEXCEPT('Pivoted Data','Pivoted Data'[Value]), [Total Margin]) <= [Top # of Items Value]))
            ,"PercentChange", CALCULATE( [Total SalesReps], FILTER('Pivoted Data', RANKX( ALLEXCEPT('Pivoted Data','Pivoted Data'[Value]), [Total % Change]) <= [Top # of Items Value]))
        )
        , BLANK() )

    Whew, that was a ton of measures.  All the key components are complete now.  In part 3 we will clean up our report page and make it shine.  I hope you enjoyed this tutorial. Also, follow me on Twitter and Linkedin where I will post all the announcements for new tutorials and content.

    Linkedin Twitter
  • Map with Data Labels in R

    Map with Data Labels in R

    Mapping is one of the better features of PowerBI.  It is one of the more distinguishing feature differences between Excel and PowerBI.  You can produce a map inside an excel document using Bing maps, however, the experience has always felt a little like an after-thought.  Mapping within PowerBI has a planned, and thoughtful integration.  While the mapping functionalities within PowerBI Desktop are far improved when compared to excel, there are still some limitations to the mapping visuals.  This past week I encountered such an example.  We wanted to draw a map of the United States, add state name labels and some dimensional property like year over year percent change.

    I started with the standard map visual, but this didn’t work because there is no ability to shade each state individually.  This just looked like a bubbled mess.

    Globe Map Visual
    Globe Map Visual

    Next, I tried the Filled Map visual.  While this mapping visual provides the colored states it lacks the ability to add data labels onto the map.  Clicking on the map would filter down to the selected state, which could show a numerical value.  Alternatively, you can place your mouse over a state and the resulting tag will show the details of the state (hovering example provided below).

    Filled Map Visual
    Filled Map Visual

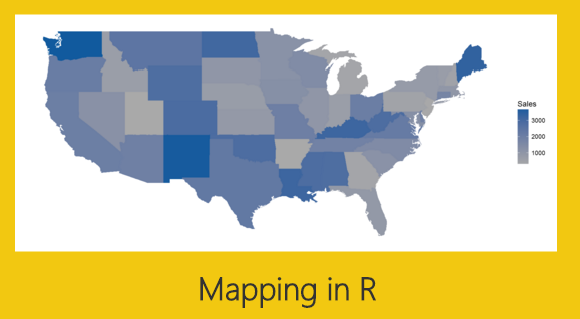
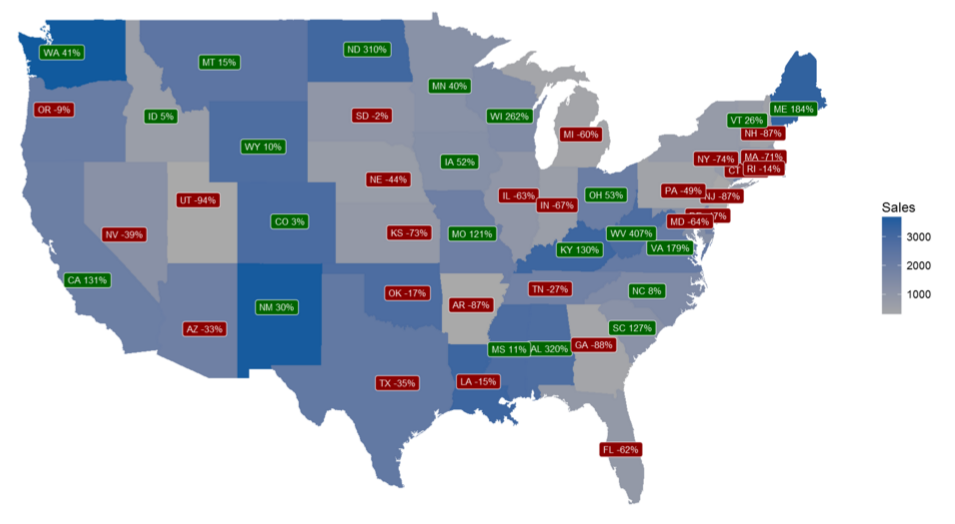
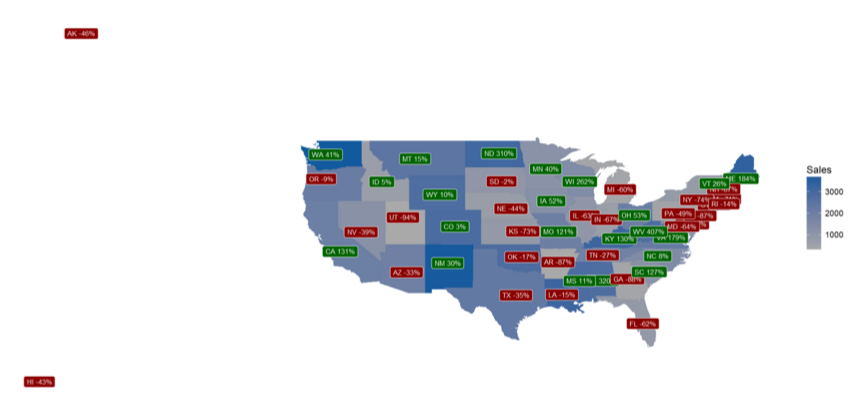
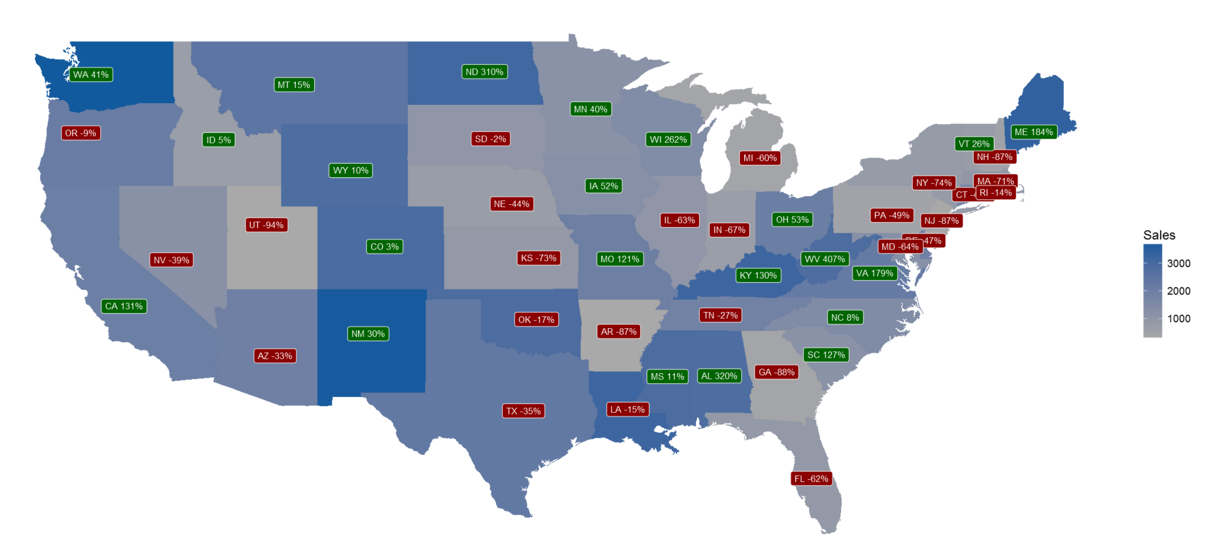
    Still this did not quite meet my visual requirements.  I finally decided to build the visual in R which provided the correct amount of flexibility. See below for final result.  You can download the pbix file from the Microsoft R Script Showcase.

    R Map Visual
    R Map Visual

    In this visual, each state is shaded with a gradient color scale.  The states with the lowest sales are grey and the states with higher sales numbers transition to dark blue.  The darker the blue the more sales the state saw.  Each state has an applied label.  The color of the label denotes the percent change in sales.  If the color is green then the sales this year were higher than last year, red means that the state sales were lower this year.  The state name is listed in the label as well as the calculation for the year over year percent change.

    Alright, let’s start the tutorial.

    First, before we open PowerBI we need to load the appropriate packages for R.  For this visual you will need to load both the maps and the ggplot2 packages from Microsoft R Open.

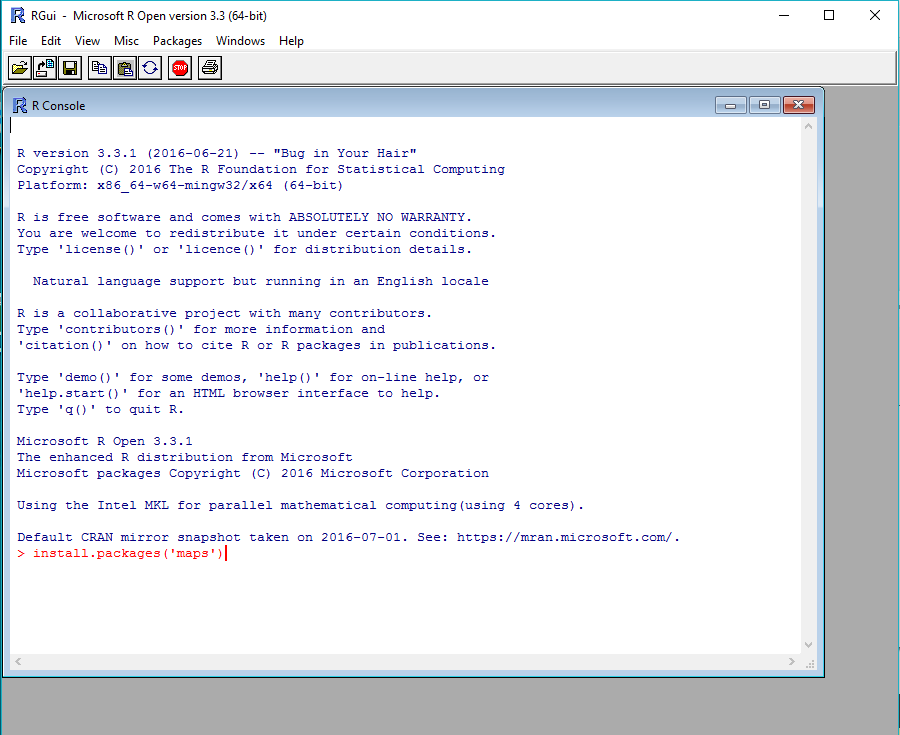
    Open the R console and use the following code to install maps.

    install.packages('maps')

    Install Maps Package
    Install Maps Package

    Repeat this process for installing ggplot2.

    install.packages('ggplot2')

    After installing the R packages we are ready to work in PowerBI Desktop.  First, we need to load our sample data.  Open up PowerBI Desktop and start a blank query.  On the View ribbon in the query editor open the Advanced Editor and enter the following M code.

    Note: If you need some more help loading the data follow this tutorial about loading data using the Advanced Query Editor.  This tutorial teaches you how to copy and paste M code into the Advanced Editor.

    let
      Source = Excel.Workbook(Web.Contents("https://powerbitips03.blob.core.windows.net/blobpowerbitips03/wp-content/uploads/2016/10/State-Data.xlsx"), null, true),
      StateData_Table = Source{[Item="StateData",Kind="Table"]}[Data],
      #"Changed Type" = Table.TransformColumnTypes(StateData_Table,{{"StateName", type text}, {"Abb", type text}, {"TY Sales", Int64.Type}, {"state", type text}, {"Latitude", type number}, {"Longitude", type number}, {"LY Sales", Int64.Type}, {"Chng", type number}}),
      #"Renamed Columns" = Table.RenameColumns(#"Changed Type",{{"TY Sales", "Sales"}})
    in
      #"Renamed Columns"

    After pasting the code into the Advanced Editor click Done to load the data.  While in the Query Editor, rename the query to be StateData, then click Close & Apply on the Home ribbon.

    Load Mapping Data
    Load Mapping Data

    We still need to prepare the data further by adding two calculated columns.  Click the bottom half of the New Measure button on the Home ribbon and select New Column.

    Add New Column
    Add New Column

    Enter the following code into the formula bar that appears after clicking New Column.

    Change = StateData[Abb] & " " & ROUND(100*StateData[Chng],0) & "%"

    Change Column Measure
    Change Column Measure

    Again, click on the New Column button found on the Home ribbon and add the code for a color column.

    Color = if(StateData[Chng] > 0 , "Dark Green", "Dark Red")

    Color Column Measure
    Color Column Measure

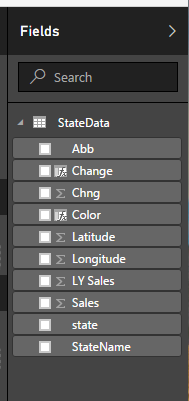
    The Fields list should now look like the following.

    Fields List
    Fields List

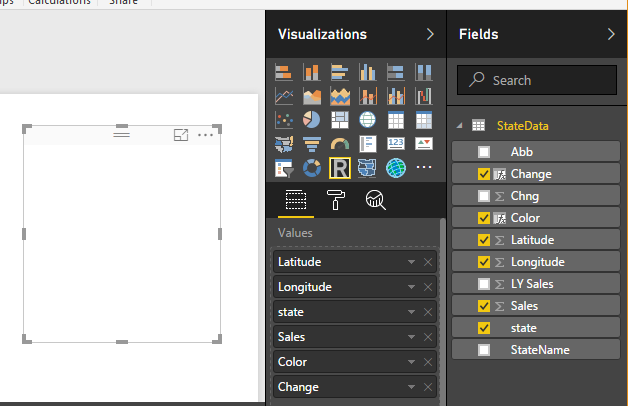
    Add the R visual with the following fields.

    R Visual Fields
    R Visual Fields

    Add the following R script into the R Script Editor.

    # Load the ggplot2 and maps packages
     library(ggplot2)
     library(maps)
    
    # Load the mapping data into a dataframe called states_map
     states_map <- map_data("state")
    
    # Start ggplot2 by sending it the dataset and setting the map_id variable to state
     ggplot(dataset, aes(map_id = state)) +
    
    # Add the map layer, define the map as our data frame defined earlier
     # as states_map, and define the fill for those states as the Sales data
     geom_map(map = states_map, aes(fill=Sales)) +
    
    # Add the data for the labels
     # the aes defines the x and y cordinates for longitude and latitude
     # colour = white defines the text color of the labels
     # fill = dataset$Color defines the label color according to the column labeled Color
     # label = dataset$Change defines the text wording of the label
     # size = 3 defines the size of the label text
     geom_label( aes(x=Longitude, y=Latitude), 
      colour="white", 
      fill=dataset$Color, 
      label=dataset$Change, size=3
      ) +
    
    # define the x and y limits for the map
     expand_limits(x = states_map$long, y = states_map$lat) +
    
    # define the color gradient for the state images
     scale_fill_gradient( low = "dark grey", high = "#115a9e") +
    
    # remove all x and y axis labels
     labs(x=NULL, y=NULL) +
    
    # remove all grid lines
     theme_classic() +
    
    # remove other elements of the graph
     theme(
      panel.border = element_blank(),
      panel.background = element_blank(),
      axis.ticks = element_blank(),
      axis.text = element_blank()
      )

    After adding the R script press the execute button to reveal the map.

    Paste R Script
    Paste R Script

    Final Map Product
    Final Map Product

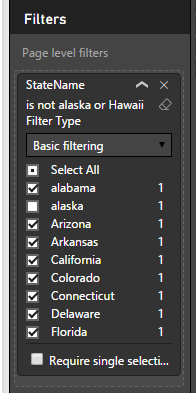
    Notice how we have data included for Alaska and Hawaii but those states are not drawn.  We want to remove the Alaska and Hawaii data points.  Add the StateName field to the Page Level Filters and then click Select All.  Now, un-check the boxes next to Alaska and Hawaii.  The data is now clean and the map correctly displays only the continental United States.

    Page Level Filters
    Page Level Filters

    Here is the filtered final map product.

    Filtered Final Map
    Filtered Final Map

    Thanks for following along.  I hope you enjoyed this tutorial.  Please share if you liked this content.  See you next week.


  • Using Advanced Mapping in ArcGIS Preview

    Using Advanced Mapping in ArcGIS Preview

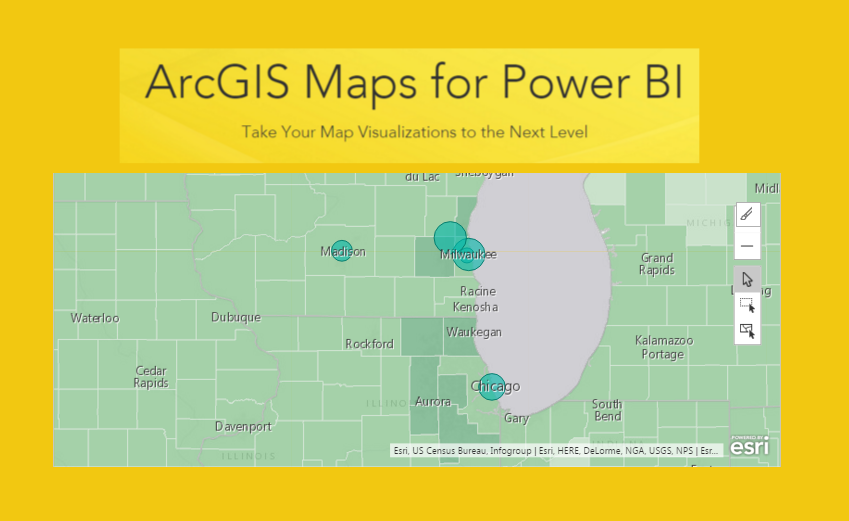
    In the September 2016 release of PowerBI, Microsoft introduced a new visual called the ArcGIS Maps preview.  For more information on the maps integration you can read the following post from Microsoft.  This tutorial will review how to load data using Latitude and Longitude data and map those points on the ArcGIS map.

    First, we need to open PowerBI Desktop and then we will load some data.  The version of PowerBI Desktop for this tutorial is 2.39.4526.362 64-bit (September, 2016).  You can download the latest version of the software here.

    On the Home ribbon click on the Get Data button and from the Get Data window select Blank Query.  Click Connect to proceed.

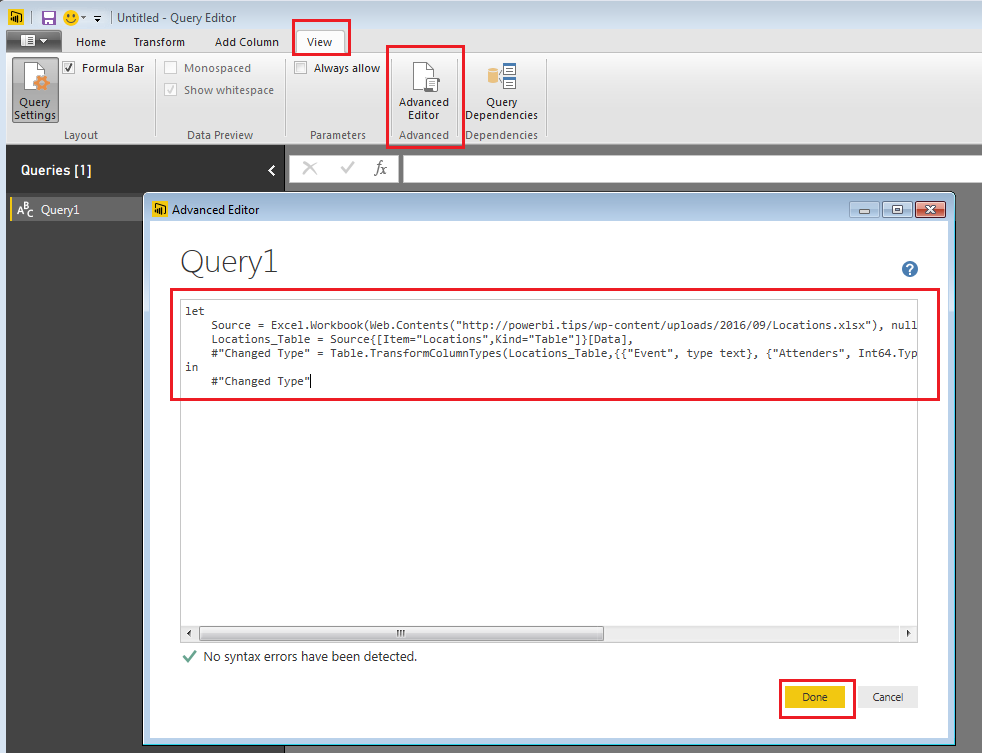
    Now you will be in the Query Editor, click on the View ribbon and select the Advanced Editor button.  The Advanced Editor will now open.

    Enter the following code into the Advanced Editor: (you can copy and paste the code directly from this site)  Click Done to load the data.

    let
     Source = Excel.Workbook(Web.Contents("https://powerbitips03.blob.core.windows.net/blobpowerbitips03/wp-content/uploads/2016/09/Locations.xlsx"), null, true),
     Locations_Table = Source{[Item="Locations",Kind="Table"]}[Data],
     #"Changed Type" = Table.TransformColumnTypes(Locations_Table,{{"Event", type text}, {"Attenders", Int64.Type}, {"Zip", Int64.Type}, {"Latitude", type number}, {"Longitude", type number}})
    in
     #"Changed Type"

    Note: this will load an excel file that is hosted on PowerBI.Tips, so make sure you have an internet connection.

    Load Map Data
    Load Query

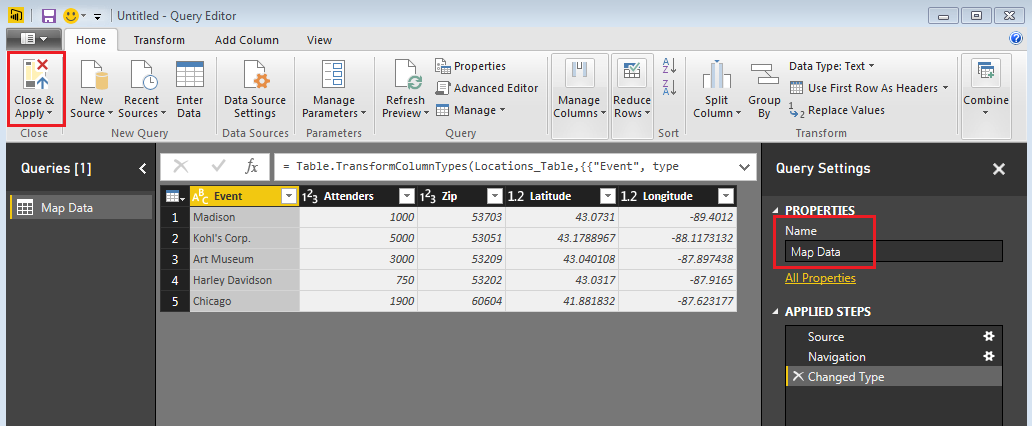
    Re-name your query to Map Data and then on the Home ribbon click Close & Apply.

    Load Map Data In PBI
    Load Map Data In PBI

    Before working on this tutorial, you will want to make sure you have enabled the ArcGIS map which is in preview.

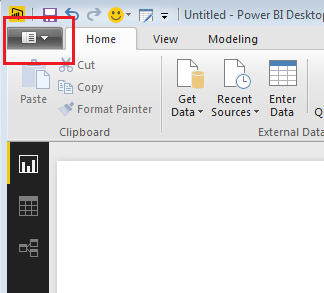
    Click the Menu button to open up the menu options.

    PBI Menu Button
    PBI Menu Button

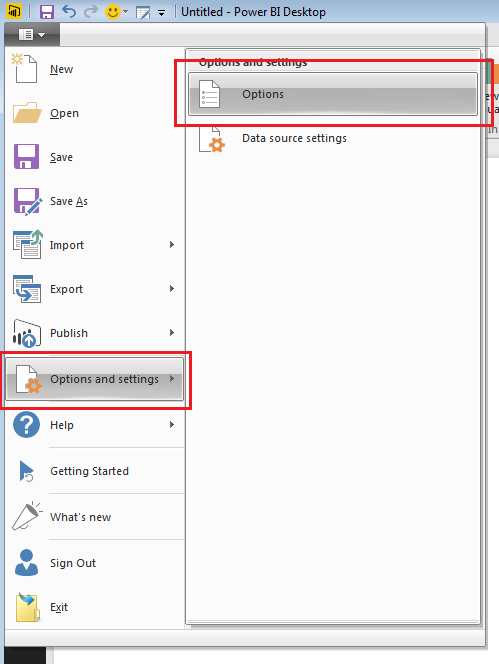
    This will expose the menu.  With the menu open click on Options and Settings and then click on Options.

    Selecting Options
    Selecting Options

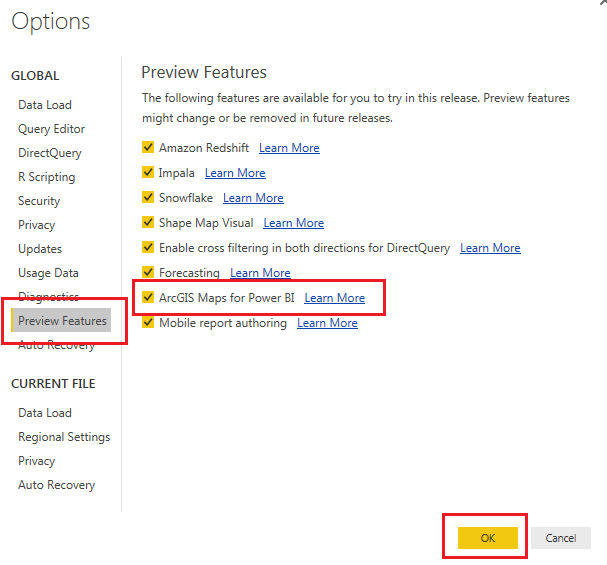
    Once the Options menu is open, click on Preview Features and then make sure the ArcGIS Maps for PowerBI preview feature is check.  Then click OK to close the options menu.

    Options Menu
    Options Menu

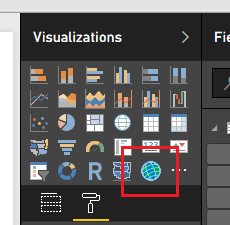
    You should now see a new bright blue icon listed in the Visualizations window.

    ArcGIS Maps Icon
    ArcGIS Maps Icon

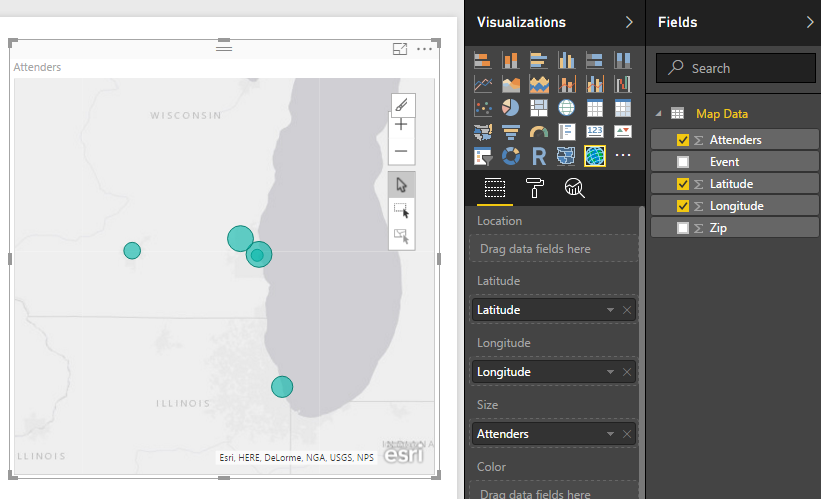
    Click on the ArcGIS visualization and then add the following following columns of data from the Fields window into the visual.

    Fields for ArcGIS Map
    Fields for ArcGIS Map

    OK, Wow, seems like a normal map.  So, why all the hype?  Well, unlike other mapping visualizations, this map enhances the selection methods for points on a map.

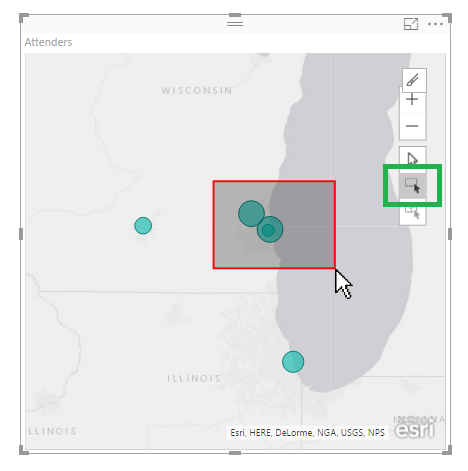
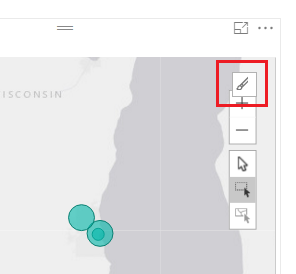
    By clicking on the square with the black mouse arrow (highlighted with a green box here because the selection tool for the visual uses a red box)  You can then click drag a red box across the map to select multiple geographical points on the map.

    Highlighting Points on Map
    Highlighting Points on Map

    Selecting points on the map will filter other visuals on the page.

    Add a Table visual with the following fields:

    Table Visual Fields
    Table Visual Fields

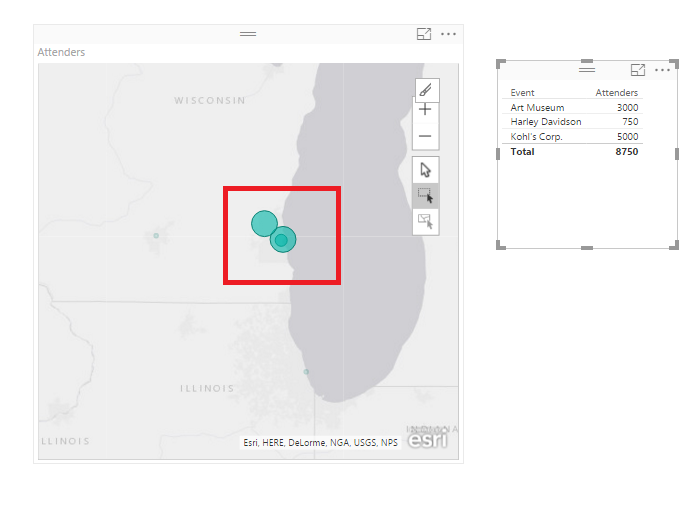
    Now click the Multi-Select button and highlight some points on the map.

    Multi-Select Button
    Multi-Select Button

    Notice how only the selected points are highlighted on the map and the table filters to only those points.

    To enhance the map further click the In-Focus Edit Mode button.

    In-Focus Edit Mode
    In-Focus Edit Mode

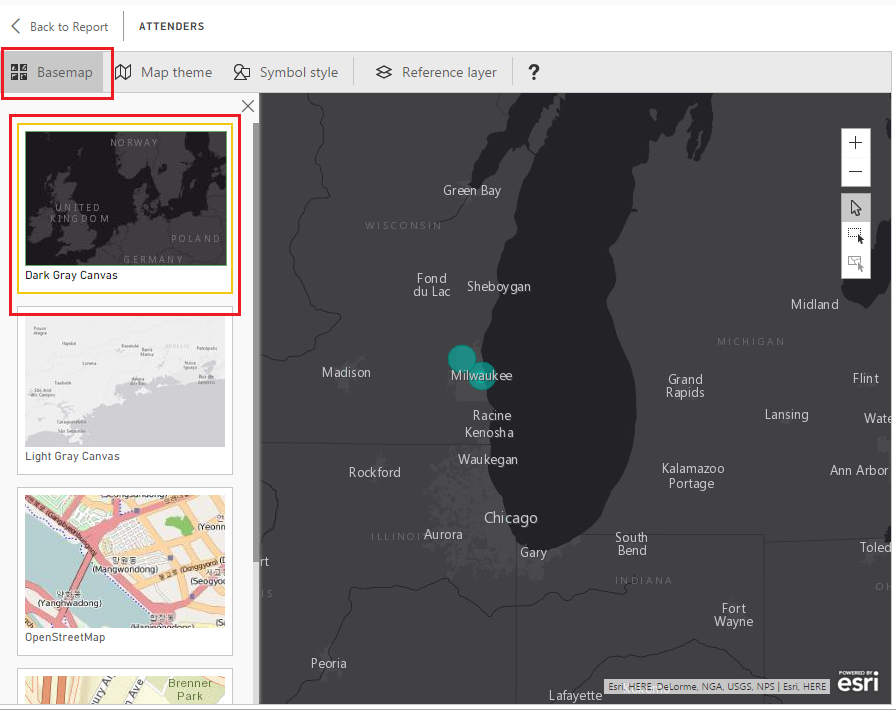
    Now, the map editor opens.  This allows you to change the basemap view, the theme of the map, symbols on the map and adds other data to enhance the coloring of the map.

    Click on the Basemap button and then select the Dark Gray Canvas.  We have turned the map in to a sort of night mode.

    Basemap Change
    Basemap Change

    Have fun here and explore a couple of the other map types.

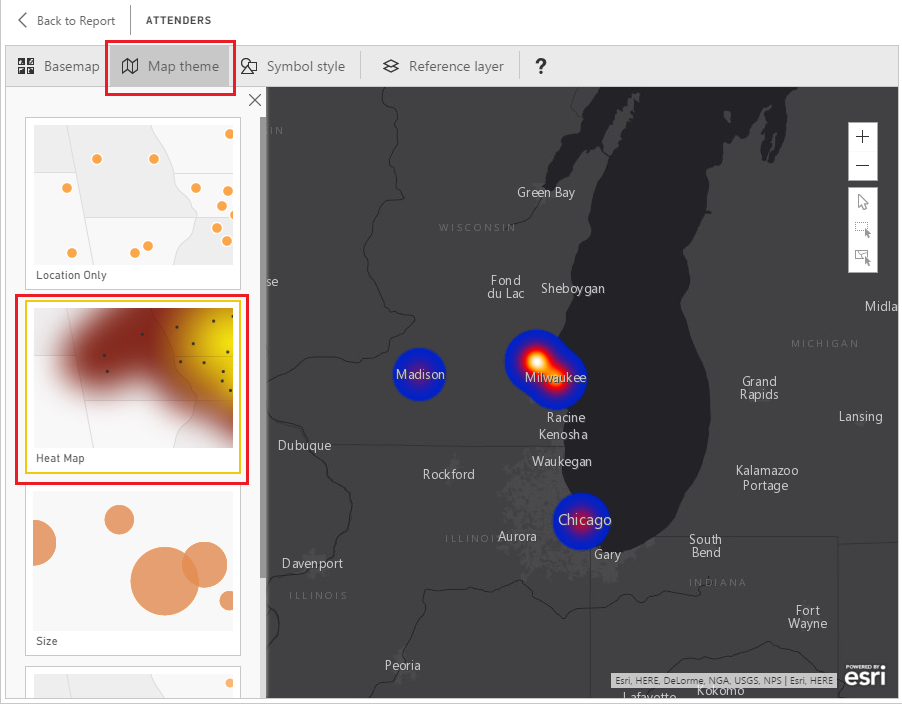
    Next Click on the Map Theme then click on the Heat Map.  Alright, this is getting pretty cool.

    Heat Map Selection
    Heat Map Selection

    In the next section Symbol Style you can change the properties of the points on the map.  For the heat map you can change the Transparency and the Area of Influence of the points.  Each map theme, Location, Heat Map, Size, and Clustering have different Symbol Style properties.  So you might want to select a couple different Map Themes and try adjusting the Symbol Styles to see how they change.

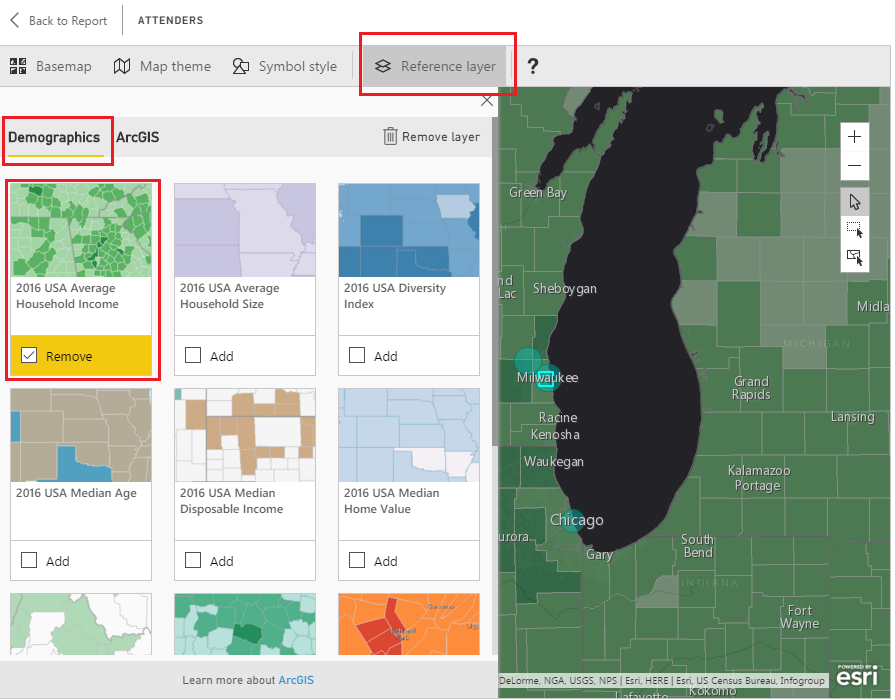
    Now finally, the best part of the ArcGIS mapping, the Reference Layer.  This will blow your mind!

    Click the Reference layer button then select a layer to add from the Demographics tab.  For this example, I chose the USA Average Household Income.

    Household Income Layer
    Household Income Layer

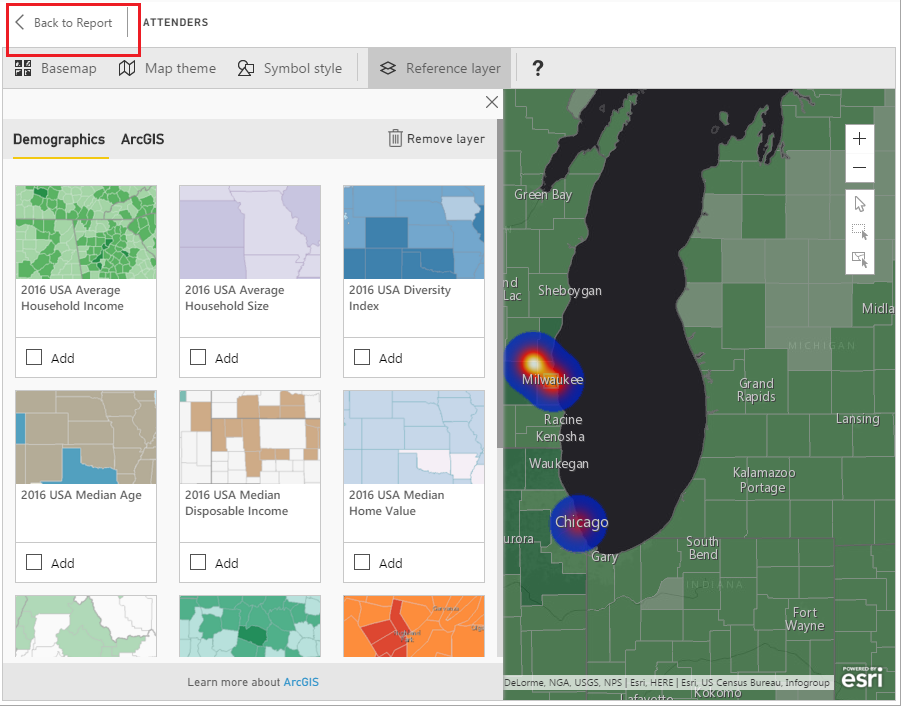
    To return to the Report click the Back to Report button in the upper left hand corner of the page view.

    Back to Report
    Back to Report

    The layer feature is by far the most helpful part of this tool.  Imagine the time required to collect all that regional demographics data, model it and then to apply it to the mapping visual.  The ArcGIS mapping tool is quite impressive.

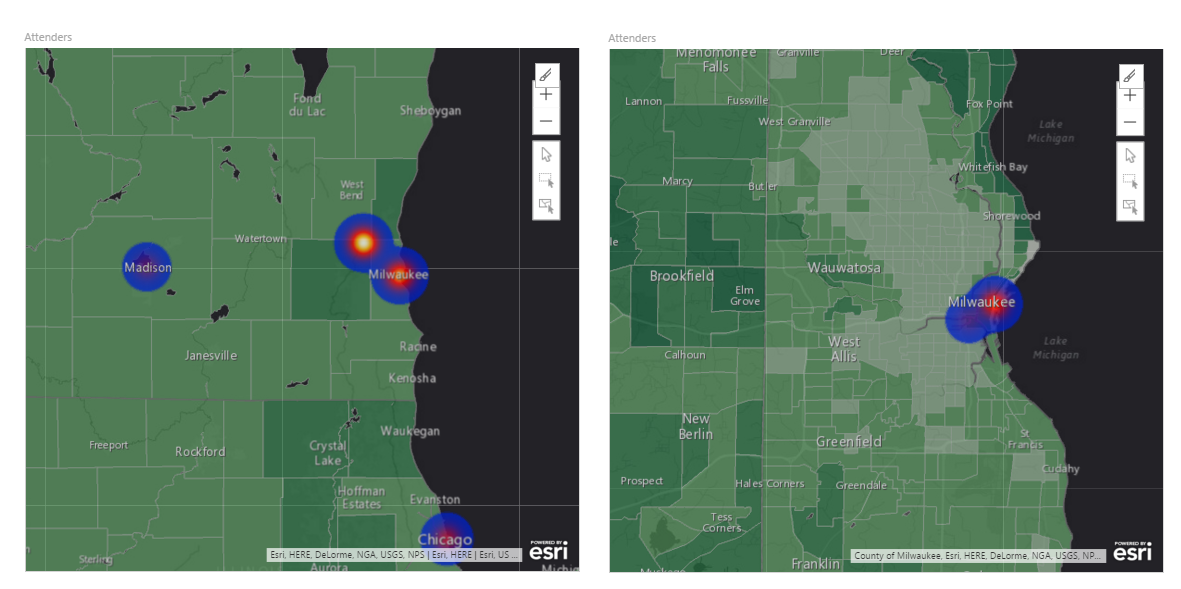
    One other note before we leave.  Now that you are back on the report level view.  Use your mouse scrolling wheel and zoom in and out on the map visual.  Notice the closer you zoom into the data points the more detailed the regional views become. See comparison below:

    Zoomed Views
    Zoomed Views

    Thanks for following along.  Remember to share if you liked this tutorial.  See you next week.