April 20, 2016
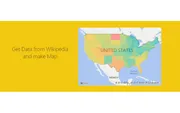
From Wikipedia to a Colorful Map
Learn how to pull data directly from Wikipedia into Power BI and create a beautiful filled map showing US population growth by state.
Tag
2 posts
April 20, 2016
Learn how to pull data directly from Wikipedia into Power BI and create a beautiful filled map showing US population growth by state.
April 14, 2016
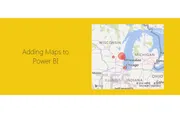
Learn how to create impressive map visualizations in Power BI Desktop using latitude and longitude data with this step-by-step mapping tutorial.