
Drill Down Maps in Power BI with MapBox

If you’ve played around with MapBox in Power BI – you’ll know that it has loads of great features to create really rich and beautiful maps! One feature I love is the ability to ‘drill down’ to dynamically uncover different layers of your spatial data hierarchy, just in the same way that you can drill down on a standard column chart or matrix in Power BI.
Why Drill Down on a Map?
- See the big picture: Using drill down, we can visualize the data set at the ‘big picture’ scale, and then explore finer details for areas of interest (just think of the classic spatial hierarchy of Country -> State -> City -> Suburb)
- Save on real estate: We can also display multiple datasets at different levels in the same map – which goes a long way to conserving your precious report page real estate by reducing the number of visuals in your report!
- Performance: Following on from above, less visuals almost always equates to better report performance! And this is especially true when using MapBox, which is at the slower end of the Power BI performance scale at the best of times – so using drill down to reduce the number of maps combined with filtering your datasets goes a long way to speeding up your reports!
Create a Drill Down Map in MapBox
Setting up a drill down map in MapBox is pretty simple once you get the hang of configuring Choropleth maps, and in this video blog I walk through the key steps:
- Create a MapBox ‘Choropleth’ map (check out the video on MapBox 101 if you’re new to MapBox, or need a refresher on creating Choropleth maps).
- Add hierarchy layers to the ‘location’ MapBox field well
- Enter the vector layer properties from the MapBox Studio for the additional map levels
In my example, I create a drill down map of priority Catchments and Rivers across Victoria using ‘synthetic’ data, which I created to visualize the nutrient concentration over time (for demonstration purposes only!).
Instructions
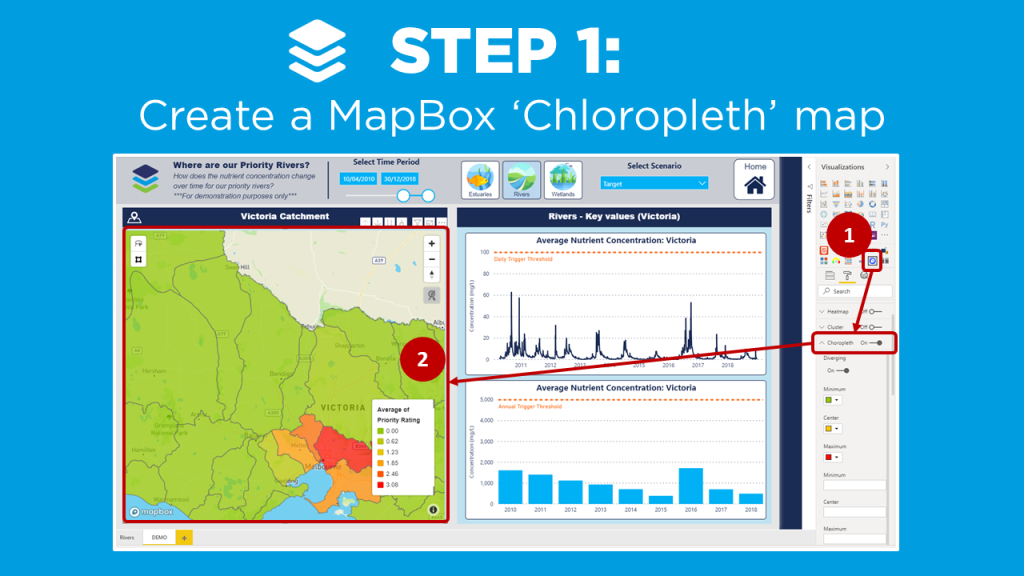
ps://powerbi.tips/2020/04/mapbox-101-for-power-bi/
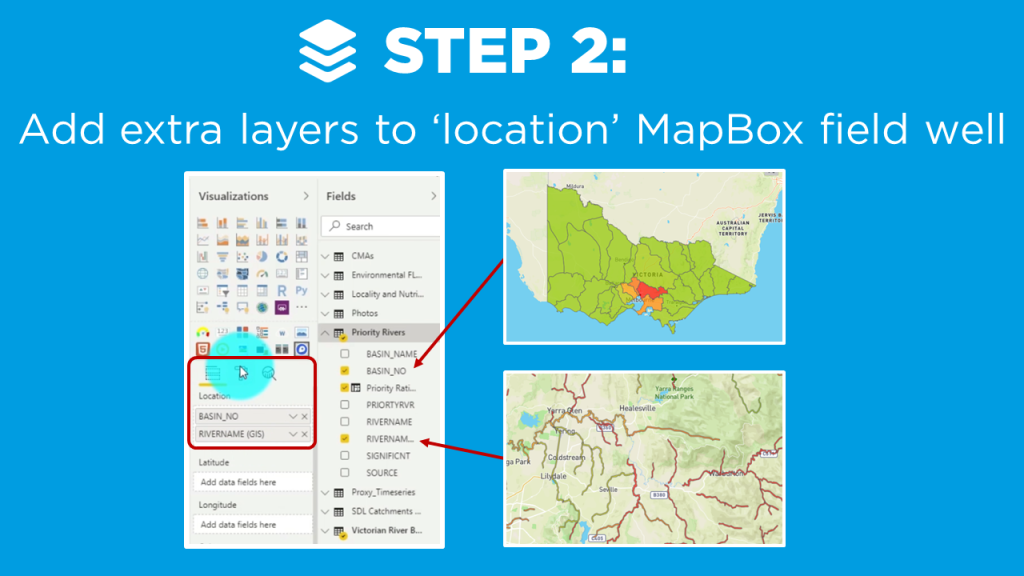
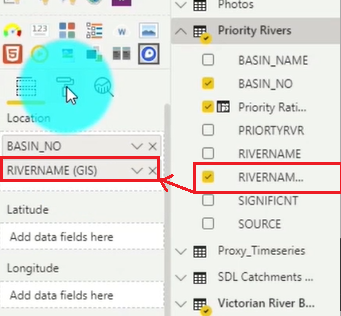
Locate the RIVERNAME field and Drag & Drop it into the second position in the Location field well under BASIN_NO.
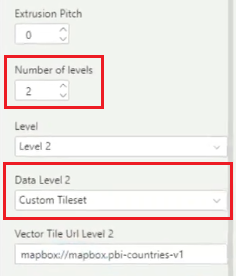
Now navigate to the Format area and select the Choropleth section again. Increase the Number of levels to 2, and Select the Custom Tileset in the Data Level 2 section.
After you set the above you need to jump out of the Power BI Desktop and head over to the mapbox studio. Here you would take the second layer of the map that you created by choosing another tileset. (For details on how to do that watch the Mapbox 101 tutorial.)
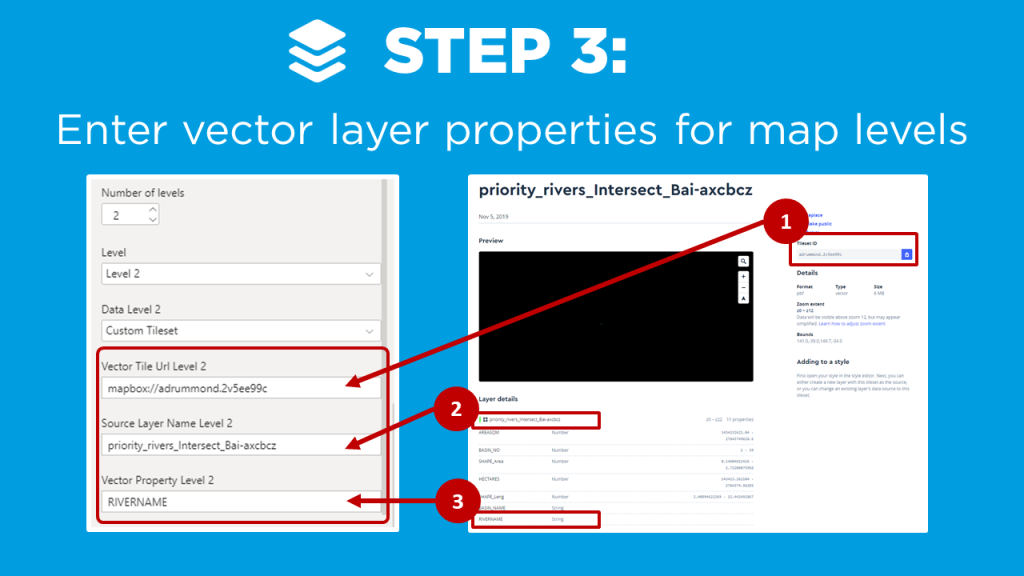
- Copy the Tileset ID from Mapbox and insert that value into the PBI Desktop Vector Tile Url Level 2 property still under the Choropleth section.
- Copy the layer name from Mapbox and Paste into the Source Layer Name Level 2 property.
- Copy the field you want from the attribute list in Mapbox and Paste into the Vector Property Level 2.
Mapbox Drill Down Results
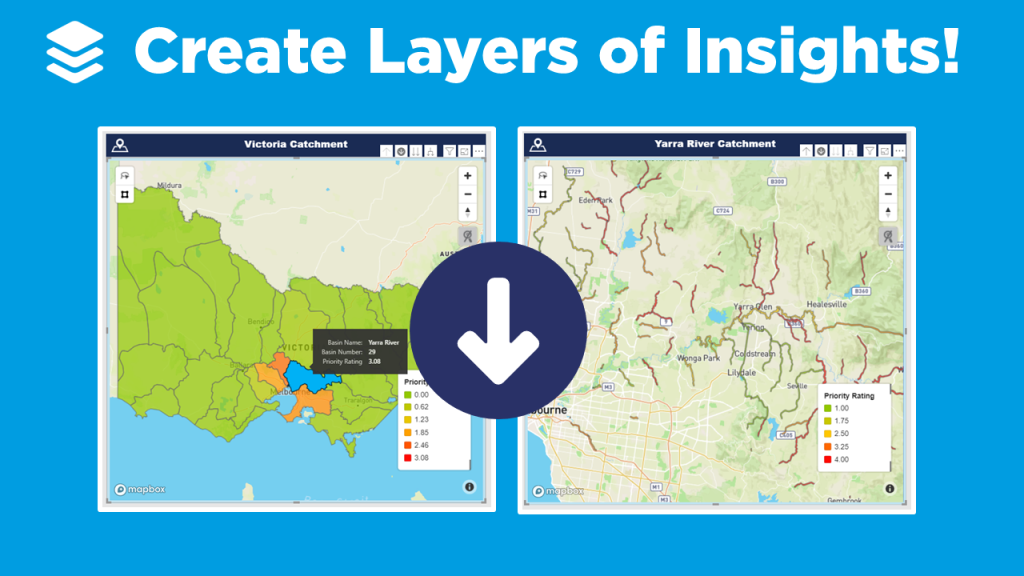
We now have the ability to select our map area and drill down into the second layer. In our example, the rivers are now shown under each catchment.
If you’re keen to learn how to create really cool customized maps for your Power BI reports, then make sure to check out the other blogs in this 4-part MapBox series, where we provide an introductory MapBox 101, explore how to create 3D maps, and how to design your own styles!
And if you want to learn how you can create really beautiful and engaging Power BI reports, get in touch with one of the DiscoverEI team to register for our brand-new online training courses:
- Power BI Designer Masterclass
- Power BI for the Environmental Industry
- Power BI for the Water Industry
Take a look here for more details (https://www.discoverei.com/training)