Ok, I’ve got to be honest the first two tutorials (Loading Excel Files, Loading CSV Files) were only there to get things kicked off. Now we are getting to some of the good stuff.
When I first saw this feature in Power Query for excel I nearly had a conniption. My first thought is this is going to CHANGE EVERYTHING, and to be perfectly honest it has. My entire view of Excel and Power BI has been shaped by this simple but powerful idea; Automated Data Loading.
In all my years as an engineer I would have to constantly copy and paste data from one excel file to another. Then perform some transformations just to produce a bar chart or a line graph, uggh. This is slow and boring. I was really good at being boring, and I felt like I was able to become quite ingenious by writing macros and automating parts of my data transformations. Now I have seen the light, The simple ability of being able to load a group files from a folder is AWESOME! Had I had this feature in my engineering days I could have saved so much time. So in true homage of my engineering roots this post is for you, the all mighty data hungry engineer.
Alright, enough of be babbling, Lets get to it.
Materials for this Tutorial:
- Zip file with (3) three excel files download Data Set.
- Power BI Desktop (I’m using the March 2016 version, 2.33.4337.281) download the latest version from Microsoft Here.
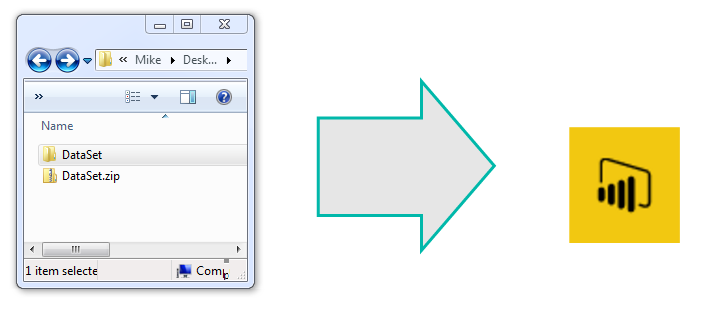
Lets start off by downloading the Data Set and unzipping the file to a folder called DataSet. For this demo I unzipped the files to my desktop folder.
Next we will open up Power BI Desktop. On the Home ribbon select the Get Data button. The Get Data window will be presented and this time we will select the Folder icon in the menu.
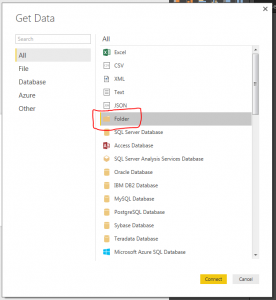
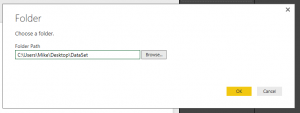
Click the Connect button at the bottom right of the screen. A folder window will display. This is where we will select the location of our data in the folder we unzipped earlier. Click OK once you’ve selected the location of the folder.
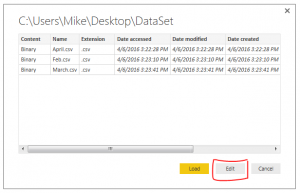
The next window to open shows the files that Power BI Desktop is able to see in the folder location. Normally we would press Load and move forward but in this case we want to further manipulate our query to load the data. Therefore, Click the Edit button to modify the query to load data.
We are now in the Query Editor. This is where we can manipulate the incoming data before we visualize it.
Note: The Query Editor is a graphical representation of the M-language which is used to load data. Each button press in the Query Editor performs a transformation to your data. Each step writes a little line of code that handles the transformations. To see the code Click the View ribbon then click the button labeled Advance Editor. For more documentation on the M language look at the Microsoft documentation located here.
Here is an image of the files we loaded in from our folder location in the Query Editor.
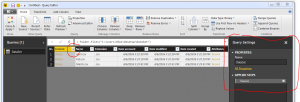
The next step is to combine all the files into one combined data model. To do this click the Double Down Arrows that are circled in red on the left side in the column called content.
Note: I also circled the Query Settings in Red on the right. The Query Settings window will become very useful, especially when trouble shooting a query. You will notice as we make additional data transformations more steps will accumulate in the query settings.
We now have a final view of all the data from each of the three CSV files.
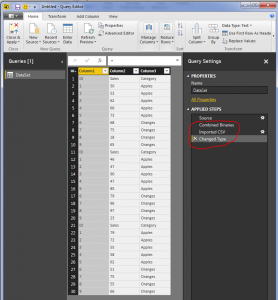
The file needs a little clean up to remove some unwanted data rows. Notice now that we have loaded all three files. In each file we had a header row. Now in our data model we have three rows with headers. We want to use the first row as column names. To do this, Click the Use First Row as Headers button on the Home ribbon.
Also, notice there are rows of data that contain the initial header rows from the other two files.
Now we will apply a filter to remove these rows. Click the Arrow in the ID row. This will present a menu. There are various transformations on this screen, you can sort a row in Ascending, or Descending order, Filter out text items, etc…
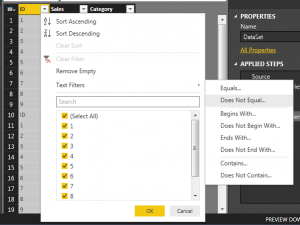
Click Text Filters and select Does Not Equal and enter ID into the filter. Click OK to proceed. This will add a step to remove any row that had ID listed in the ID column.
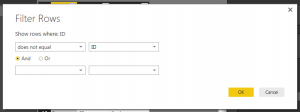
We have transformed our data and now have cleaned the data and it’s ready for use. Click Close and Apply to load the data to the data model. Now the data is ready for visualizations. Thanks for following along.
Make sure you take some time to share if you enjoyed this tutorial.
This is great and it worked perfectly with your data and mine THANK YOU. I now have an issue I can’t figure out how to get around. I want to add a another file, one with the same headers and add it to this folder and have it append to the end of what we have already built. I have this a lot where I get monthly files and have to append them. I was hoping to get data from a file originally and then keep adding a monthly file (with the exact same header row) as I get them to this folder. Eventually you would have a folder with 24 folders representing 2 years of monthly folders. HELP PLEASE.
I’m so happy this is helping you. I really believe in the technology and feel like for many business users this will be a game changer. To answer your question to append multiple files together, if your using csv files and loading the data from a folder this post will help you. However, if you are loading excel files try this post, http://powerbi.tips/2016/08/load-multiple-excel-xlsx-files/ In this post I walk through how to load multiple excel files with the same headers into one table. I think this will meet your need. Here is another way of loading multiple files but making a custom formula to do this. I have done this multiple times, but it feels a bit more clunky to me and you really have to be comfortable with code. http://www.excelguru.ca/blog/2015/02/25/combine-multiple-excel-workbooks-in-power-query/ I hope this helps. Enjoy and have fun!!
Mike,
Again Thank you. I love your posts
When I did the original multi file folder upload I had nine files (Jan – Sep) and it worked perfectly. I now have an October file and when I dropped it in the folder, then refreshed the data set as you had said it brought in the file, again perfectly, but also brought in the header row which I need to now manually delete. Is there a way to not have to manually find that header row and delete it each each time I drop a new months file in the folder and refresh the data?
There are two solutions to this. First would be to bring in the header rows with the data, as in the CSV example found here. Then picking any column and then applying a Text filter to remove the added header rows.
The alternative is to follows the process outlined here in this tutorial loading many excel files from a folder. In this tutorial this is a similar process to the CSV file load but with excel files. In this tutorial you will add two columns during the data load. The first column reads each file and is denoted by the equation in the tutorial as ” =Excel.Workbook([Content]) “. The second column promotes the headers of each of the files ” =Table.PromoteHeaders([ExcelFileLoad.Data]) “. In the second column the header promotion step removes the need to have to delete the header row from your data that you receive.
Depending on whether you are loading Excel files or CSV files you will need a slightly different query code. In the provided example for the excel files we are loading multiple excel files with promoted headers using the M function “Excel.Workbook()“. If you want to do the same with CSV files you will need to replace the Excel.Workbook() with Csv.Document() function. Here is an example of the M Code from a folder on my Desktop with 3 CSV files.
let
Source = Folder.Files(“C:\Users\Mike\Desktop\Samples”),
#”Removed Other Columns” = Table.SelectColumns(Source,{“Content”, “Name”}),
#”Added Custom” = Table.AddColumn(#”Removed Other Columns”, “Read”, each Csv.Document([Content])),
#”Added Custom1″ = Table.AddColumn(#”Added Custom”, “PromoteHeaders”, each Table.PromoteHeaders([Read])),
#”Expanded PromoteHeaders” = Table.ExpandTableColumn(#”Added Custom1″, “PromoteHeaders”, {“Category”, “ID”, “Sales”}, {“Category”, “ID”, “Sales”}),
#”Removed Columns” = Table.RemoveColumns(#”Expanded PromoteHeaders”,{“Content”, “Read”})
in
#”Removed Columns”
Hope that helps. Happy Power BI-ing
Thank you. I will try it.
I really appreciate your patience.
Can’t you filter out for those headers ?
Check out this tutorial where we actually add a data manipulation step to promote the headers: https://powerbi.tips/2016/08/load-multiple-excel-xlsx-files/
This is where you would remove the headers by promoting the top row of data. An alternative approach would be to filter out the headers in the query editor before loading your data.
Hi, Im trying to connect to a folder with excel (1997-2007) files and I encountered this error. “UNABLE TO CONNECT” We encountered an error while trying to connect.
Details: “Query´Sample Binary Parameter1 (2) (Step Source) references other queries or steps, so it may no directly access a data source. Please rebuild this data combination”
Any tips?
Make sure your files of xlsx or xlsm. This is a limitation of the loading data from excel in the query editor. You will likely have to re-save your file into the newer version of excel files (xlsx, or xlsm). See more documentation located here (Microsoft Documentation)
Thanks Mike! I had the same problem that Juan and that was exactly the issue
Hi,
Thanks, the post was extremely helpful. I wanted to check if there is number of files (max) limit from a folder that is set by Power BI as I plan to make an iterative folder to append every month’s file. Also, if additional columns are to be added in all of the source files, will that affect the original pbix refresh.
Many thanks, Vrinda
I have been able to load 100s of excel files before. So I have never come across a case where Power BI limits you. I would say, the more files the longer it will take to load. If your file sizes are large you will need more memory on the machine doing the loading.
any additional columns you add to the excel files will be picked up. During the loading file dialog box where it asks you to select the file to be used as the example, you will want to make sure the file with the added columns is the sample file. This will ensure that all the data is being loaded as expected.