Month: January 2018

  • Adding Data Types Within Query Editor

    Adding Data Types Within Query Editor

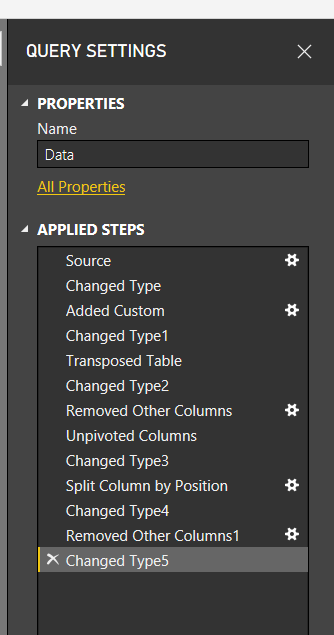
    If you have spent any time working in Power BI, your very first step is to, wait for it… Get Data.  Using Get Data will start loading your data into the Query Editor for Extracting, Transforming and Loading (ETL).  When you start out in Power BI it is likely that you don’t spend much time in the Query Editor.  However, the longer you use Power BI desktop, and the more you learn, you find that the Query Editor is highly under-rated.  There are so many amazing transformations that you can perform on your data.  After some time getting comfortable you’ll be building larger queries with many, many, steps.  Eventually, it may look something like this:
    Multiple Query Transformations
    Multiple Query Transformations

    Perhaps your queries are already long, or may be even longer.  Wouldn’t it be nice to shorten the number of steps?  It would make it easier to read.  In this tutorial we are going to talk through how we can combine several steps when you create a new column.  This is achieved by modifying the M scripts or equations slightly when new columns are created.

    While doing this won’t cut down every query in half, but it will remove a couple of additional steps per query.  This makes your queries easier to read and maintain.  Also, using this best practice, will save you headaches in the future.  At some point you will run into a data type error.  This is seen when you try to join multiple tables on columns with different data types, or when you need a measure to create a SUM but the column data type is still text.

    Let’s get to the tutorial.

    Open up your Power BI Desktop program and on the Home ribbon click Enter Data.  Using the dialog box for entering data enter the following table of data:

    Sales
    100
    120
    94
    20
    80

    Once you’ve entered your data the Create Table screen should look like the following.  Be sure to name your table, in this case I named my data table Data…. yea, feeling a lack of creativity today.  Next, click Edit to modify the query before loading the data into Power BI.
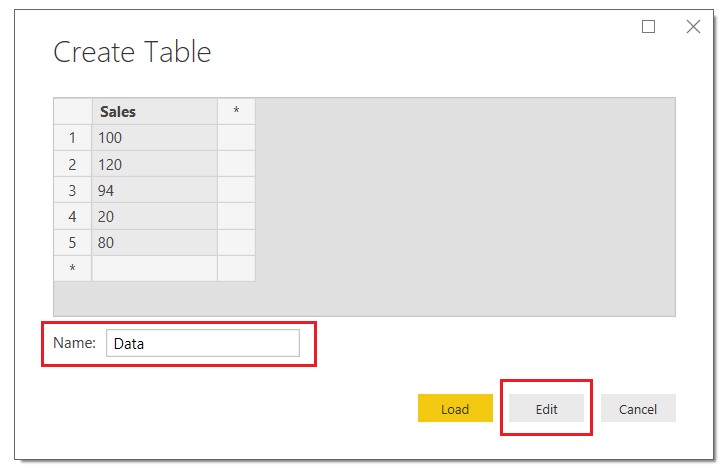
     

    Create Table
    Create Table

    This will open the query editor.  Click on the Add Column ribbon, then select Custom Column.  The Custom Column dialog box will open.

    Note: When you bring in the created table that the Sales column already has the data transformed into a whole number. Also note in the right under Applied steps we have two steps, one for the source and one for Changed Type.  This is because not every M equation (M language is the language used to perform the ETL in the query editor) can handle data types.  
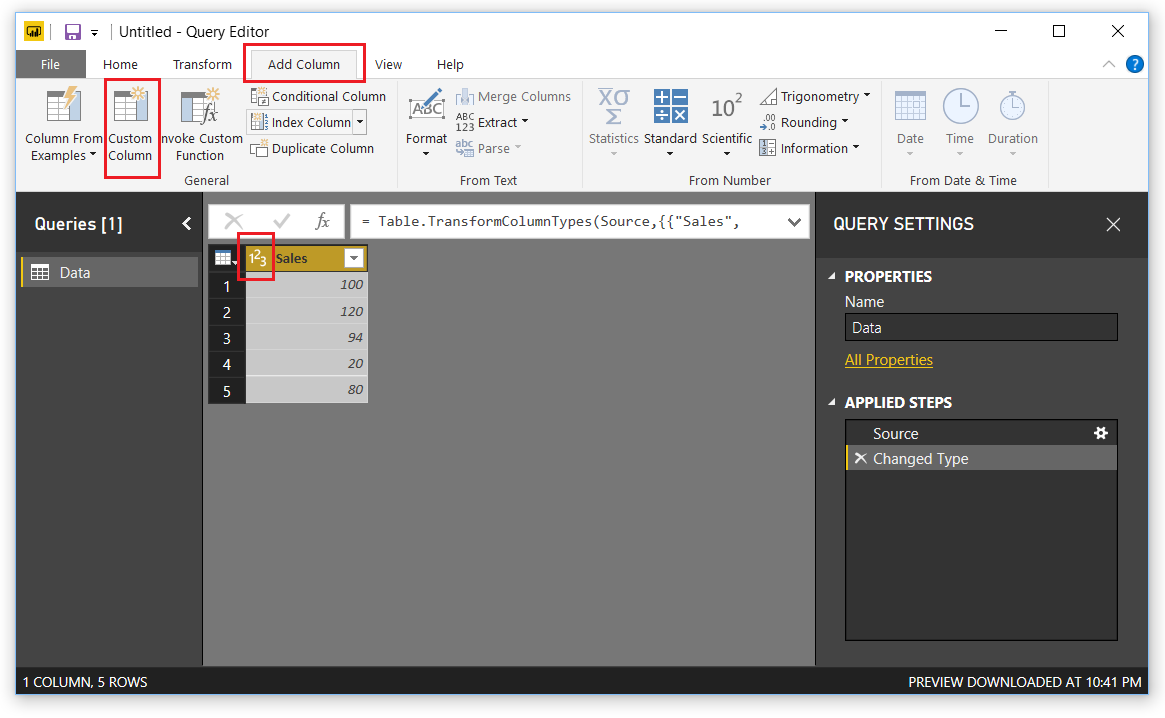
    Add Custom Column
    Add Custom Column

    In the Custom Column dialog box enter the following, the column name, the equation below.  Click OK to add the column.
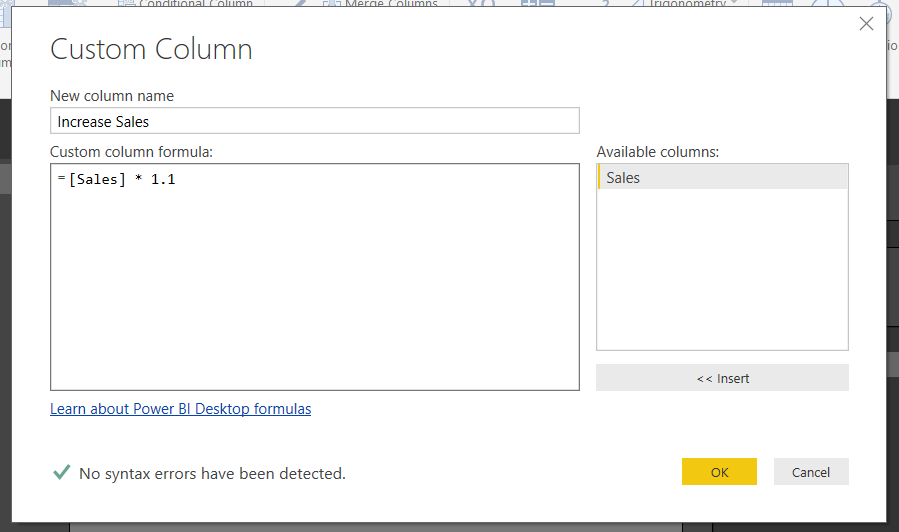
    Insert Custom Column
    Insert Custom Column

    Note: It is good practice to name the new column something meaningful.  This helps when you are working in the query editor.  When you come back to your query months later and wondered what you were creating, the column names will help!  Trust me I learned this lesson the hard way… 

    Great, now we have our new column.  Notice the image in front of our column named Increase Sales.  This means Power BI thinks that the data type of this column could be Text or a Number.  Let’s change it.  Click on the ABC123 icon and select Whole Number.  Now the column data type has changed to numbers only.
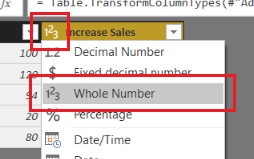
    Change Column Type to Whole Number
    Change Column Type to Whole Number

    If we glance at the Query Setting under the Applied Steps, we now have 4 steps.  Two were added, one for the added column and the second for the data type of the column.  This is not what we want.  Instead we would like the column to be added with the appropriate data type right from the beginning.

    Let’s remove the very last step labeled Changed Type1.  To do this we will click on the little X next to the step.  This will remove the step.  While highlighting the Added Custom step click in the formula bar and modify the equation to include the following statement in RED.  Press the Enter to execute the new formula.

    = Table.AddColumn(#"Changed Type", "Increase Sales", each [Sales] * 1.1, Int64.Type)

    Note: if you don’t see the formula bar it can be toggled on or off in the View ribbon in the check box titled Formula Bar.

    The query editor should now look like the following:
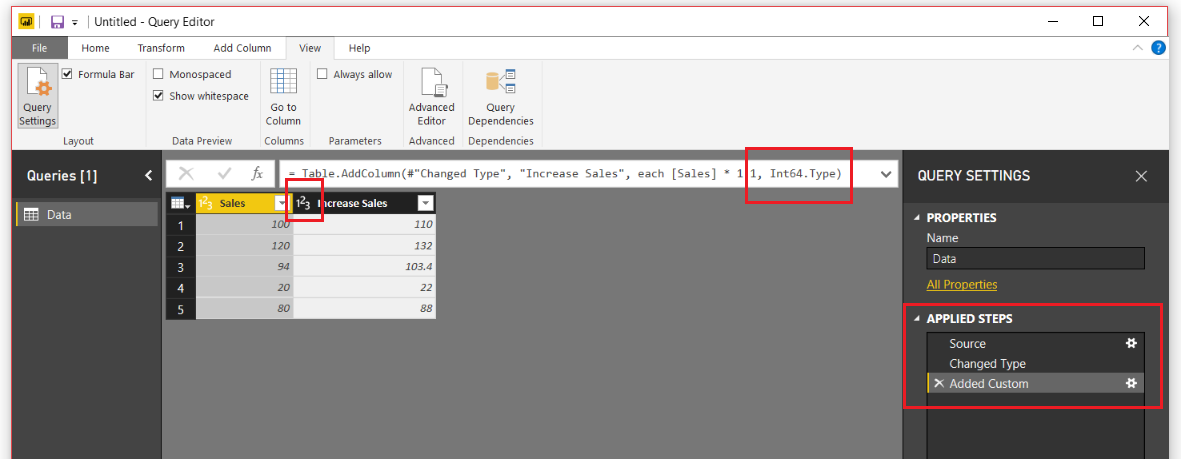
    Desired Data Type
    Desired Data Type

    Without adding an extra step on the Query Settings, we have changed the data type.  I know this might seem trivial, but when you are creating large queries, they can get difficult to read.  For me, I find this technique quite useful, and it doesn’t only support whole numbers.  This technique also supports the following data types:

    Data Type Syntax
    Whole Number Int64.Type
    Decimal Number Number.Type
    Dates Date.Type
    Text Text.Type

    Thanks for following along.  If you liked this tutorial, please share it with someone else who might find this valuable.  Be sure to follow me in LinkedIn an Twitter for posts about new tutorials and great content from PowerBI.Tips

    Linkedin Twitter
  • New Layout – Splash o Red

    New Layout – Splash o Red

    First off, let me say WOW!  The announcement of Layouts was well received by the Power BI Community.  Thank you so much for the positive feedback.  So much so, that I got excited and developed another Layout, Splash o Red.

    This new layout is called contains two pages.  It uses the drill through feature to navigate from the main page to the sub page.  The demo below shows you how it works.  I hope you enjoy this new layout, you can download it here.

    To see how to load data into the Layouts check out the following video below.  It will guide you through the process.  Additionally, each layout download will contain an instructions sheet just in case.

    You can check out all the layouts here.

    [products columns=”4″ category=”Layouts”]

  • Introducing Layouts

    Introducing Layouts

    PowerBI.tips is extremely happy to be part of, and contribute to, the Power BI Community. We’re constantly trying to think of new and interesting ways we can enhance the Power BI experience for everyone by providing helpful tips & tools. Some examples of what we’ve done so far are Power BI Desktop Theme generator, and the Power BI toolbox:


    Image Link to Advanced Color Theme Generator V3

    Image Link to Advanced Color Theme Generator V3

    Today we’re happy to announce another tool that we hope you will get an immense amount of use from.

    Introducing:

    Layouts

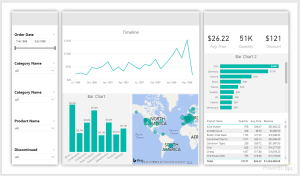
    Layouts are Power BI Template (PBIT) files that will contain layouts with visualizations already in place and only require your data to light up. We have, and will be, using as many of the visualization techniques.  We are taking some of the best layouts we’ve seen, and those we’ve developed to create these files for you. This means that you don’t have to spend any time worrying about the vast number of design techniques.  Additionally, it will save you time placing or moving things around on the report page.  All that is required of you, is to download the PBIT file, load your data, and start selecting the pre-placed visualizations.  With each layout template there will be a sample file (demo) that will show you the look and feel of each layout so you can easily choose the layout you want on each report page. You can always change the visual type with the click of a button.

    Today, we’re releasing the first of our efforts with a 3 tab layout focused on the business analyst. These layouts are designed with maximum flexibility in mind, to let you alter color themes, easily change the visualization type, and provide enough visualizations to give you a huge initial benefit. One of the best parts about the Layout is that you are not limited by our designs, they are just the starting point, you can fully customize them however you would like. We just provide you with a solid foundation to build from.

    Layouts - Basic
    Click Image to Download Layout Files

    Demo of Layouts:

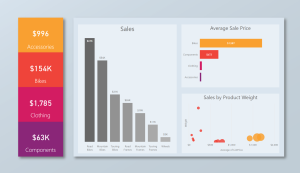
    In addition to the first analyst layout, we’re releasing an Info-graphic style layout that contains some deeper interactions using Bookmarks.  However, these Layouts will be a bit more restrictive in terms of how much you can change visually.  This is due to the need to rely more heavily on other tools to create the look & feel.  Thus, you will have limits in just how much you can change. Our hope with these is to build more stunning report layouts that will maximize presentation, or help wow an audience.

    Layout - Sunset
    Click Image to Download Layout

    We are releasing layouts for the analyst, executives and still have some fun with highly stylized files. We hope you get as much use out of these new Layouts as we know we will! Over time, we will continue to develop and produce an entire library of the selections. Thanks to all of you who make this such a fun and great Community to be a part of.

  • Move Visuals Between Reports

    Move Visuals Between Reports

    There are cases when working with Power BI files, that you would want to transfer a visual from one report to another report.  While this feature is not available within the Power BI desktop program as of today, this is available within the PowerBI.com service.

    To copy a visual from one report to another, both reports need to be located with the PowerBI.com service.

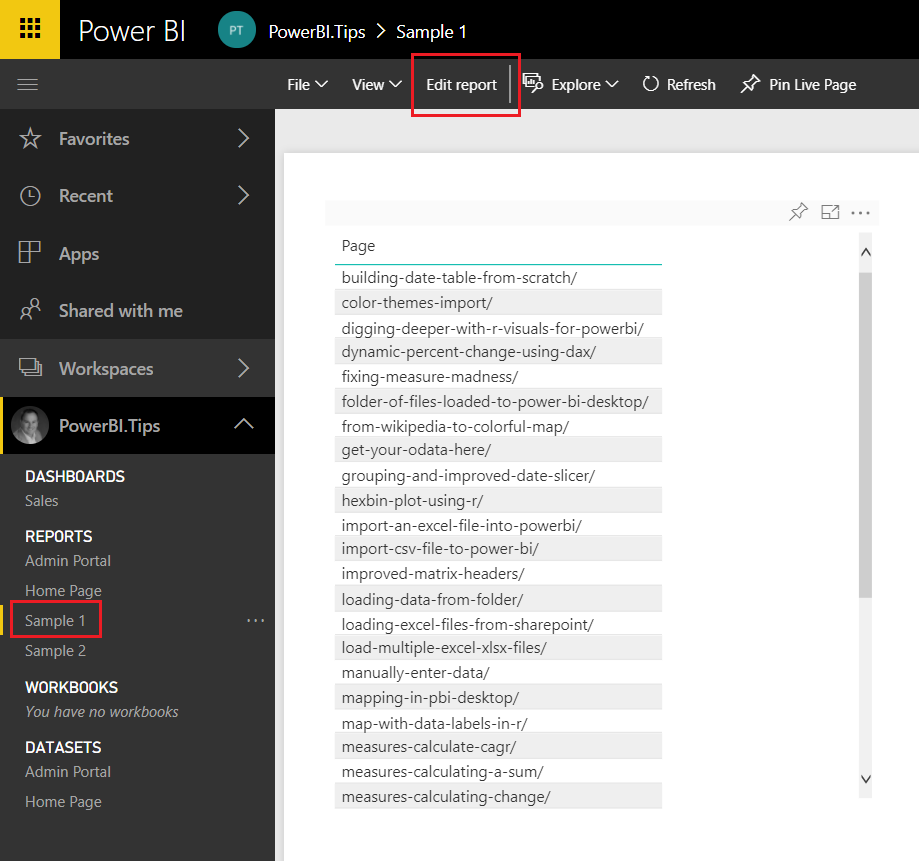
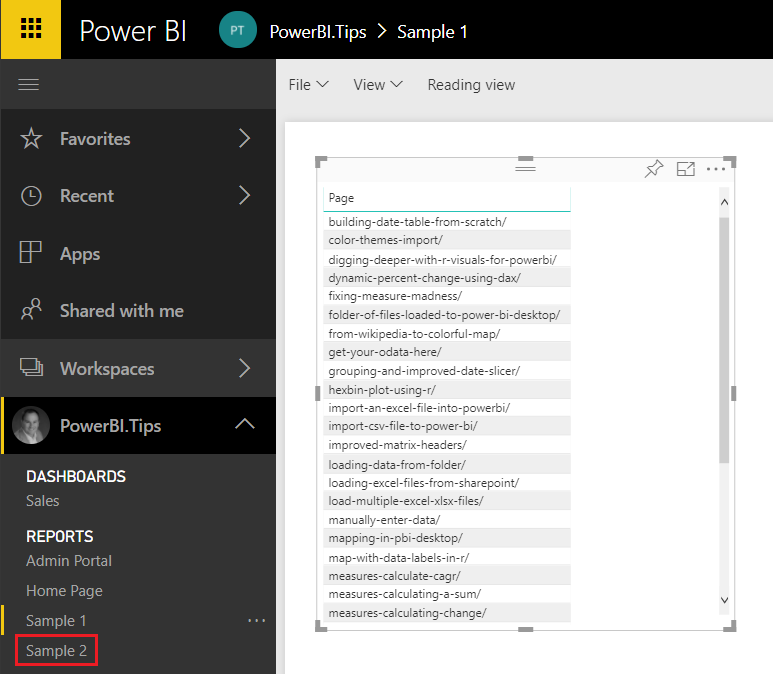
    Navigate to the report where you want to copy the visual from.  In this example I have created two reports, Sample 1 and Sample 2.  I will copy a table visual from Report Sample 1 and paste it into Report Sample 2.  Once you have opened the report Click the Edit report button on the top navigation bar.  This will change the report into edit mode and provide additional options.

    Navigate to Sample 1 Report
    Navigate to Sample 1 Report

    Select the visual you wish to copy and press CTRLC, to copy the visual.  Next click on the new report Sample 2, in our example, where you want to paste the visual.

    Select Sample 2 Report
    Select Sample 2 Report

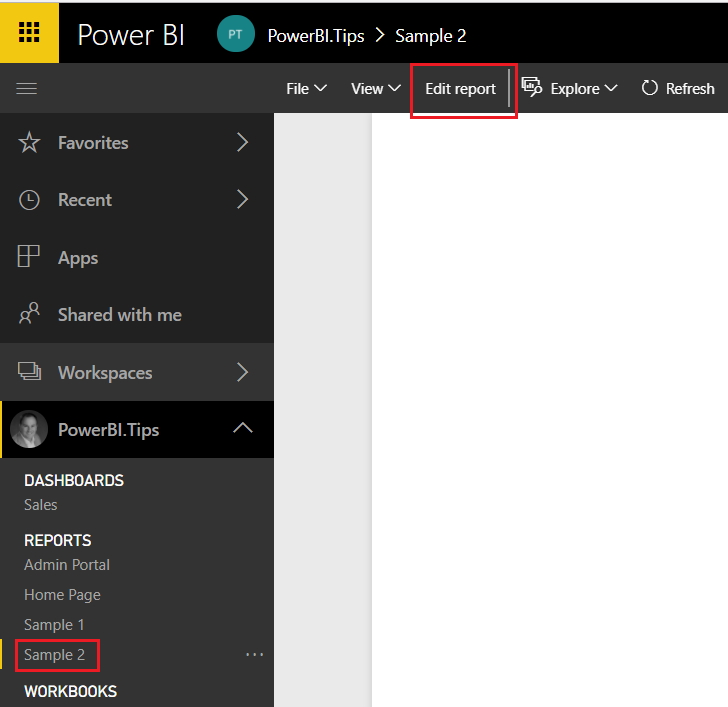
    Again, click the Edit report on the report (Sample 2) where the visual is being placed.

    Edit Sample 2 Report
    Edit Sample 2 Report

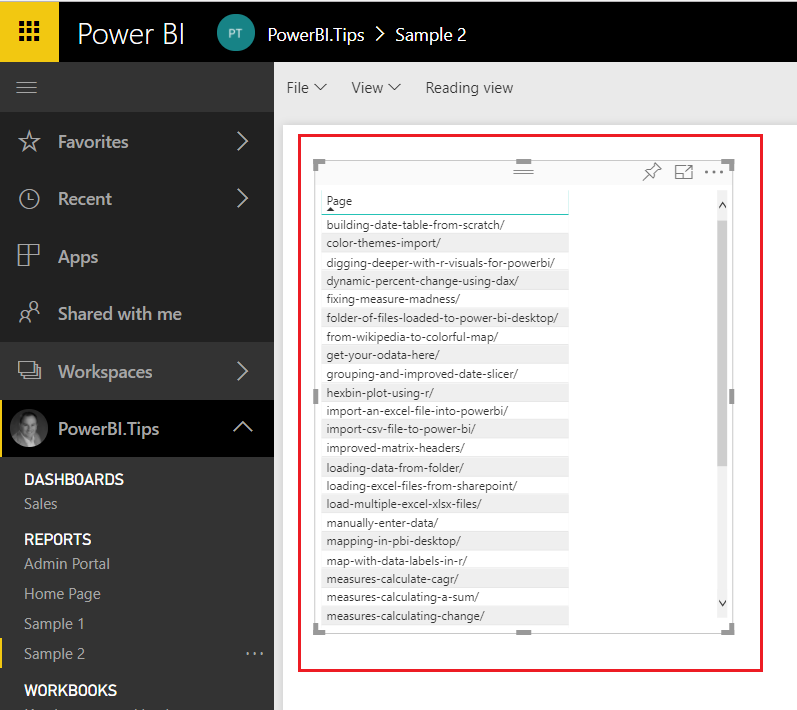
    Finally, click anywhere on the white space within the report page and press CTRL + V to paste the visual into the new report.

    Paste Visual to Sample 2 Report
    Paste Visual to Sample 2 Report

    That is it.  You have successfully moved a visual from one report to another.

    Points to Consider:

    1. Both the Copy From report and the Copy To reports need to be in the PowerBI.com service.
    2. Once you have copied the visual over to the new report you can download the report by clicking File, then selecting Download report (Preview).  You can only download reports from PowerBI.com, if the report was originally authored by the Power BI Desktop program.  If the report is made using the PowerBI.com service, the download report option will be grayed out.
    3. When coping from one report to another, you have to use the same tab in either internet explorer or chrome.  For this demo I used google chrome and was able to copy and paste the visual between report pages.

    I hope you enjoyed this little trick.  Please share it with someone else that might find this valuable.