
Move Visuals Between Reports
There are cases when working with Power BI files, that you would want to transfer a visual from one report to another report. While this feature is not available within the Power BI desktop program as of today, this is available within the PowerBI.com service.
To copy a visual from one report to another, both reports need to be located with the PowerBI.com service.
Navigate to the report where you want to copy the visual from. In this example I have created two reports, Sample 1 and Sample 2. I will copy a table visual from Report Sample 1 and paste it into Report Sample 2. Once you have opened the report Click the Edit report button on the top navigation bar. This will change the report into edit mode and provide additional options.
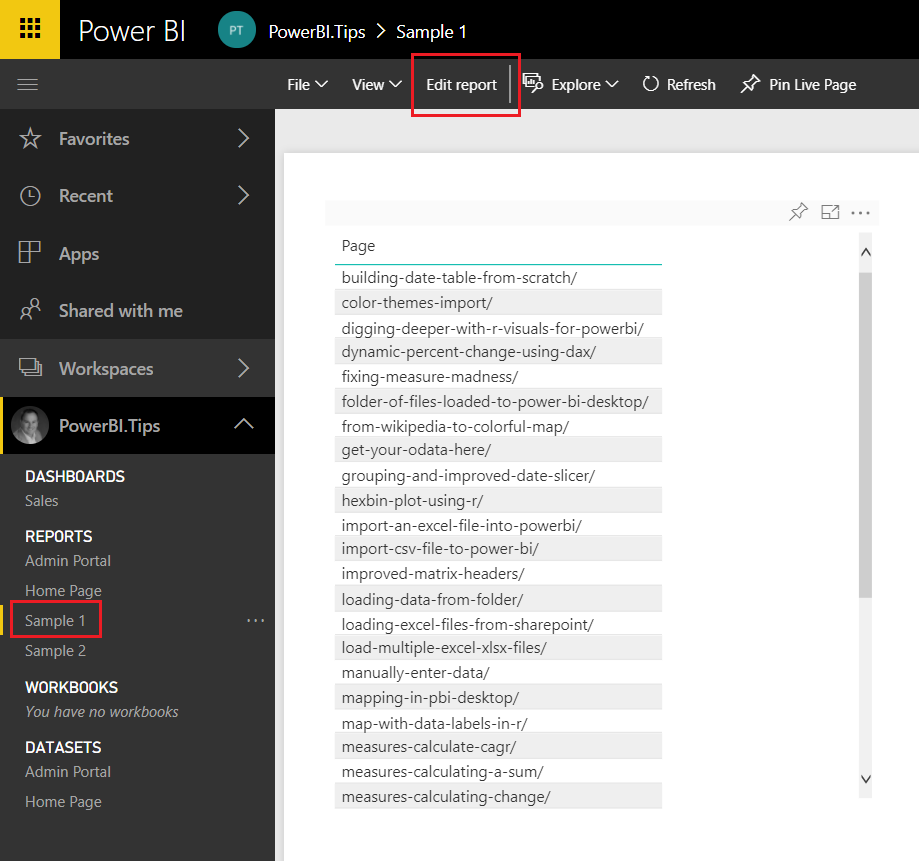
Navigate to Sample 1 Report
Select the visual you wish to copy and press CTRL + C, to copy the visual. Next click on the new report Sample 2, in our example, where you want to paste the visual.
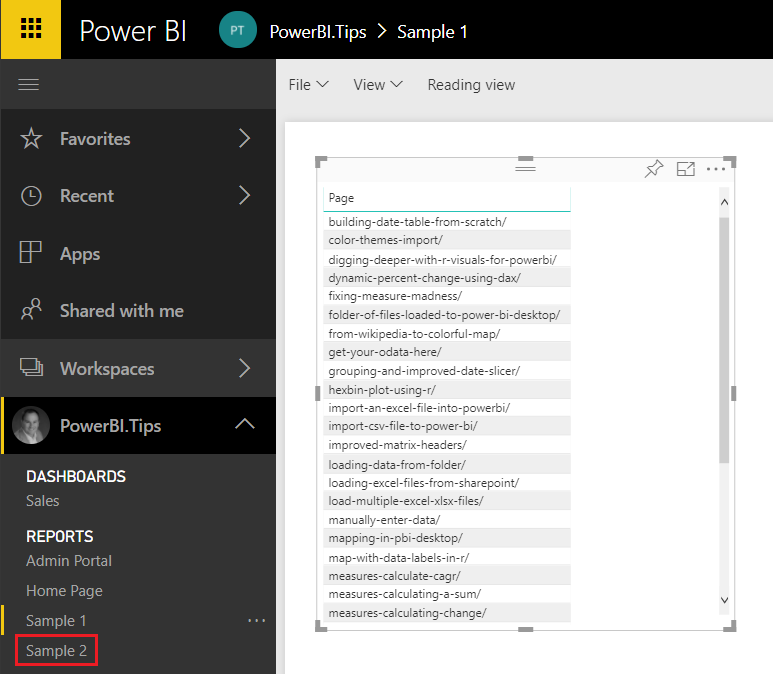
Select Sample 2 Report
Again, click the Edit report on the report (Sample 2) where the visual is being placed.
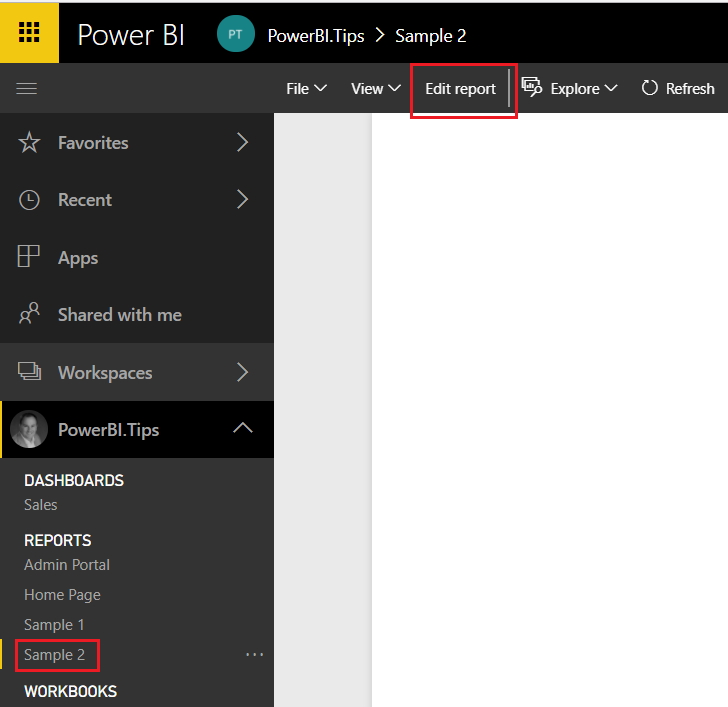
Edit Sample 2 Report
Finally, click anywhere on the white space within the report page and press CTRL + V to paste the visual into the new report.
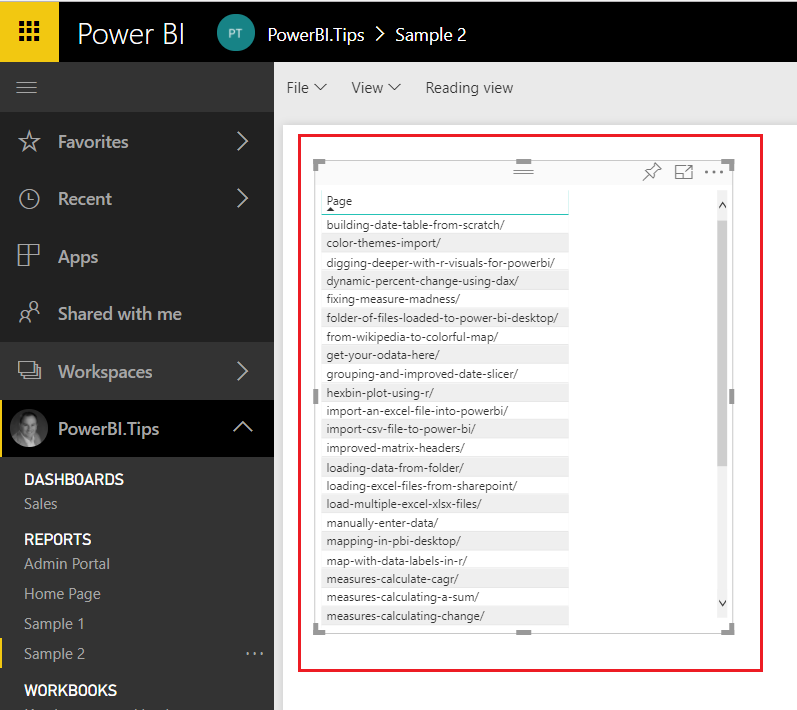
Paste Visual to Sample 2 Report
That is it. You have successfully moved a visual from one report to another.
Points to Consider:
- Both the Copy From report and the Copy To reports need to be in the PowerBI.com service.
- Once you have copied the visual over to the new report you can download the report by clicking File, then selecting Download report (Preview). You can only download reports from PowerBI.com, if the report was originally authored by the Power BI Desktop program. If the report is made using the PowerBI.com service, the download report option will be grayed out.
- When coping from one report to another, you have to use the same tab in either internet explorer or chrome. For this demo I used google chrome and was able to copy and paste the visual between report pages.
I hope you enjoyed this little trick. Please share it with someone else that might find this valuable.