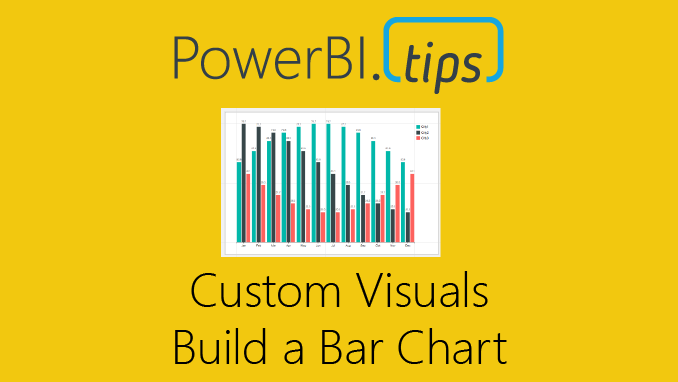
With the release of the custom visuals building tool Charts.PowerBI.Tips we received a number of comments requesting tutorials on how to build visuals. Ask and you shall receive! Below is a basic tutorial on how to create a Bar chart. Within this tutorial we review a couple of the features of the chart tool and how to use them.
Video Tutorial on Building a Basic Bar Chart Custom Visual
Comment below on other topics you would like to see.
Be sure to follow:
If you like the content from PowerBI.Tips please follow us on all the social outlets to stay up to date on all the latest features and free tutorials. Subscribe on YouTube. Or follow us on the social channels, Twitter and LinkedIn where we will post all the announcements for new tutorials and content.

