
If you’ve played around with MapBox in Power BI – you’ll know that it has loads of great features to create really rich and beautiful maps! And one of my favorite ways to get a new client excited about Power BI is to create an awesome 3D map of their city. Now, I know that 3D features get a bit of a bad wrap in traditional data viz circles (don’t even think about creating a 3D pie chart!!!), so why then are 3D maps different?
Why use 3D maps?
- Greater context: We see our world in 3D, so when we transform a flat 2D map of our cities or mountains into a 3D map, it immediately creates greater connection and a sense of perspective.
- Another dimension: 3D maps don’t just have to be based on ‘relative’ heights, you can use the 3D effect to add a new dimension to your visualisation, such as population per town, to communicate key insights at a glance.
- They just look really fancy: Sometimes half our battle as data analysts revolves around getting people within our (or our clients) organisations engaged and connected to their data. Creating 3D maps can go a long way to get that ‘wow’ factor which gets people excited and interested in the data!
Get started with MapBox
There are a couple of tricks to getting the 3D features working in MapBox, so in this video blog I walk through the key steps to help you create your own 3D maps using MapBox:
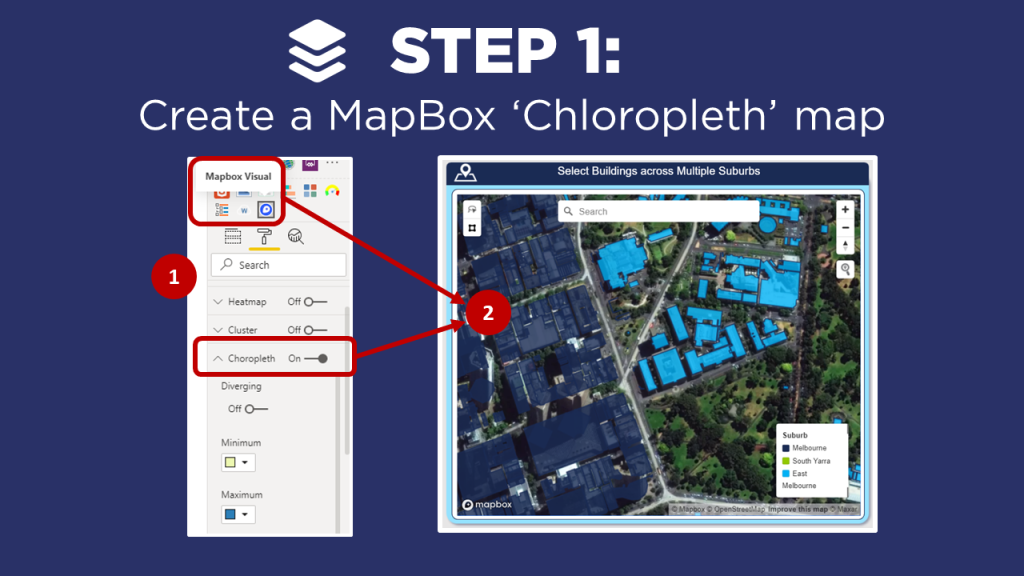
- Create a MapBox ‘Choropleth’ map (check out the video on MapBox 101 if you’re new to MapBox, or need a refresher on creating Choropleth maps).
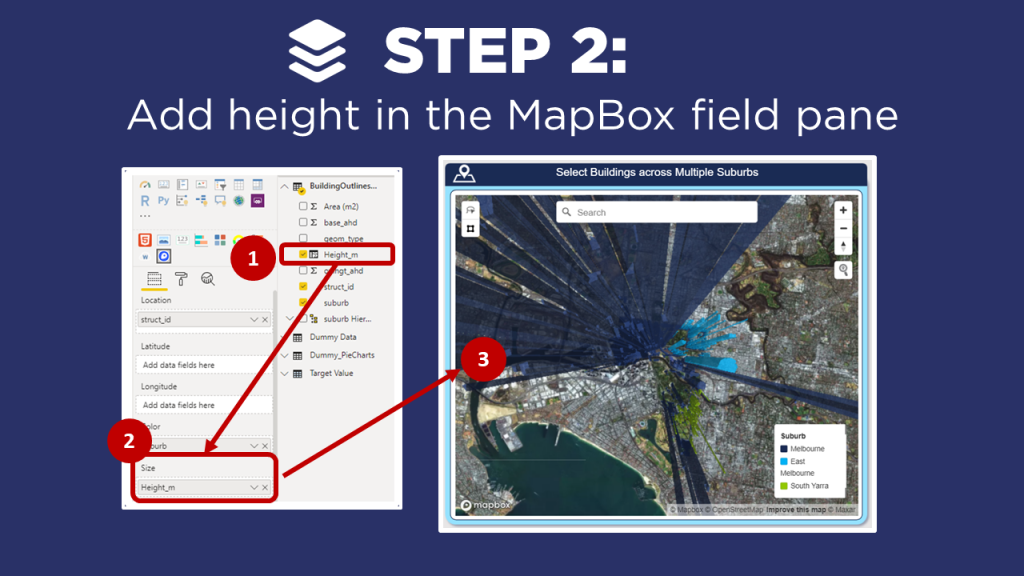
- Add height in the MapBox field pane
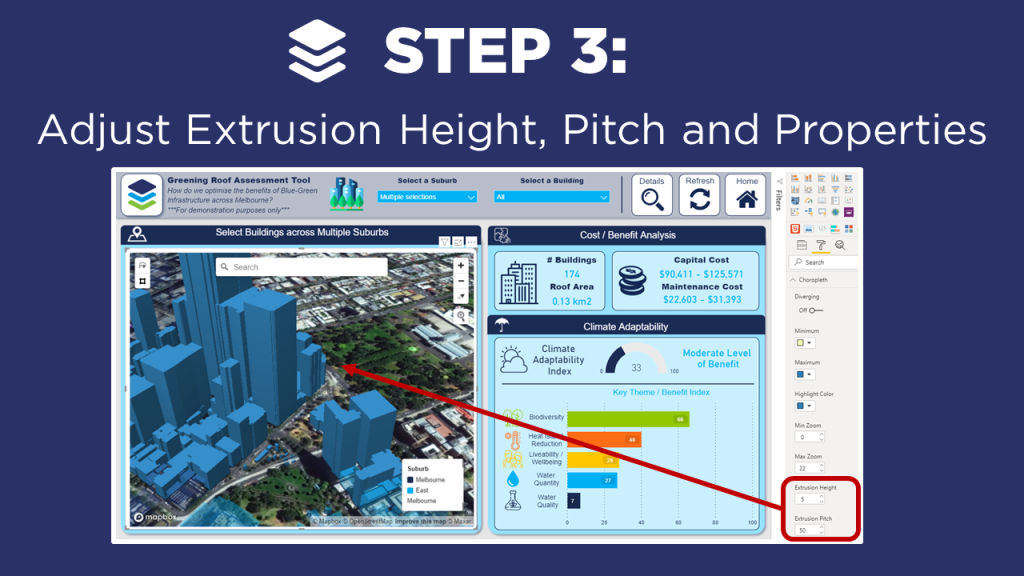
- Adjust Extrusion Height, Pitch and Properties
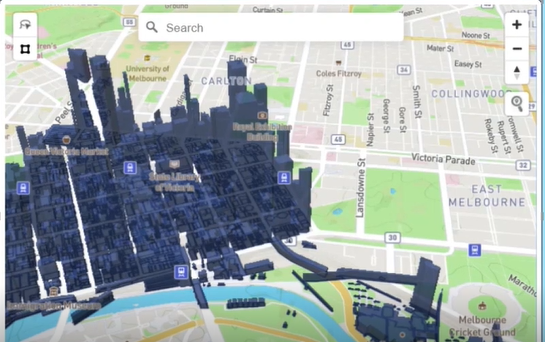
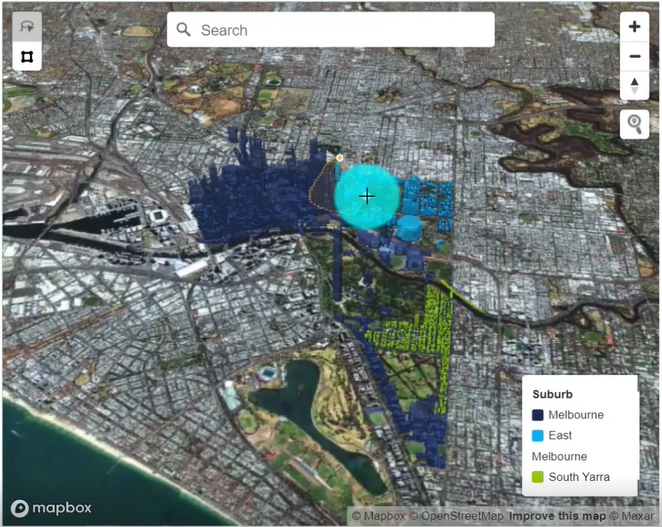
In my example, I create a 3D map of buildings across Melbourne as part of a ‘Green Roof’ assessment tool to help optimize the benefits of blue-green infrastructure across Melbourne. Note that I have anonymized this data and the calculations so that I can share it with the Power BI community (for demonstration purposes only!).
Instructions
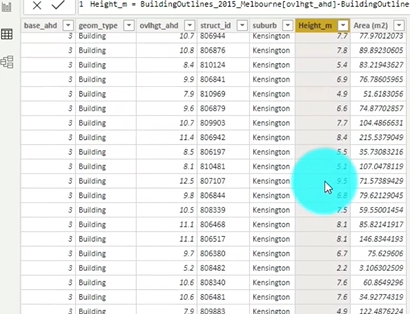
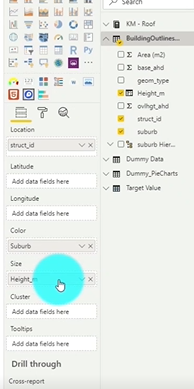
Create a data set that includes the height of the objects, in this case the height of buildings.
Drag the Height column from your data set into the Size field well.
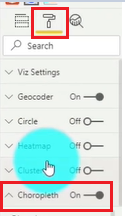
Click on the Format section of the visual and select the Choropleth toggle.
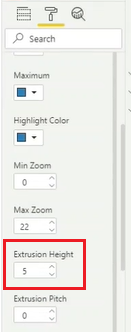
Scroll till you find the Extrusion Height. You will likely need to Adjust the value to a lower value. In our case, we take it from 500 to 5. The Extrusion Height is a multiplier of the Height value from our data set.
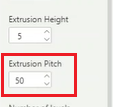
Now, we can look one option below and we see Extrusion Pitch. We are going to Adjust this from 0 to 30. This will provide an angled view of the map which provides a clearer picture of the dimensions.
Adjust MapBox Properties
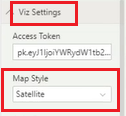
Under the Viz Settings we want to Select the Map Style and change it to Satellite
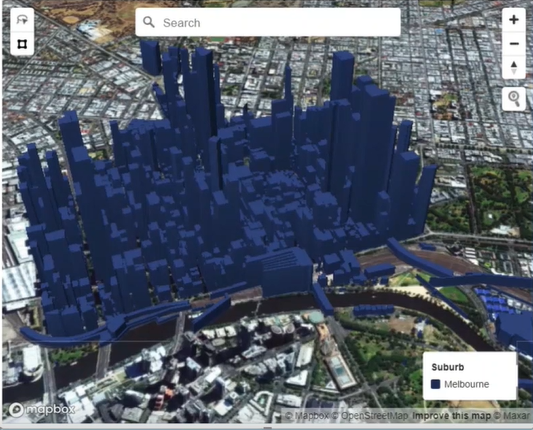
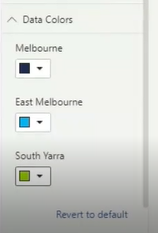
Add Color to the different suburbs. Select the Data Colors header and Click to open up the options. Now you can Set the colors of the different areas to visually separate them.
If you’re keen to learn how to create really cool customized maps for your Power BI reports, then make sure to check out the other blogs in this 4-part MapBox series, where we provide an introductory MapBox 101, explore how to create multi-layer drill down maps, and how to design your own styles!
And if you want to learn how you can create really beautiful and engaging Power BI reports, get in touch with one of the DiscoverEI team to register for our brand-new online training courses:
- Power BI Designer Masterclass
- Power BI for the Environmental Industry
- Power BI for the Water Industry
Take a look here for more details (https://www.discoverei.com/training)
If you like the content from PowerBI.Tips please follow us on all the social outlets. Stay up to date on all the latest features and free tutorials. Subscribe to our YouTube Channel. Or follow us on the social channels, Twitter and LinkedIn where we will post all the announcements for new tutorials and content.
Introducing our PowerBI.tips SWAG store. Check out all the fun PowerBI.tips clothing and products:
Check out the new Merch!


