
If you’ve played around with MapBox in Power BI – you’ll know that it has loads of great features to create really rich and beautiful maps, including some great ‘out of the box’ map styles (i.e. base maps). However, you might not be aware that it also gives you the ability to design custom Mapbox styles with your own spatial layers. I discovered this feature on a recent project where my client wanted to include Victoria’s Catchment Management Authority (or CMA) boundaries on their base-map to provide greater context to help interpret their data. Up until this point, the only option I knew of was to purchase an expensive ArcGIS Online licence to create custom map styles. So, you can imagine just how excited I was when I discovered that I could also do this in MapBox – for FREE!!!
Reasons to Design Your Own Style
There are plenty of reasons to design your own map styles, including:
- Provide Context: I touched on this above, but the ability to add your own layers to the backgrounds on your maps goes a long way to providing additional context to help your report users understand and interpret their data.
- Simplify: Sometimes you need to peel back the complexity to help your data stand out. Customizing base maps allows you to remove unnecessary elements which may distract your users from the data, and dynamically add back complexity at different zoom intervals (watch Step 4 of the Video to see how this works!)
- Consistency, Branding, and Themes: Customizing the style allows you to design your maps with a similar ‘look and feel’ to other visuals in your report, as well as corporate branding and color themes. For the passionate Power BI designers out there – you’ll LOVE this feature (we’re always on the hunt for new formatting options in Power BI!)
I’m not going to lie, there are a couple of steps involved in designing your own custom styles for MapBox in Power BI, but believe me – it’s totally worth it! I walk through the key steps in this short video, which include:
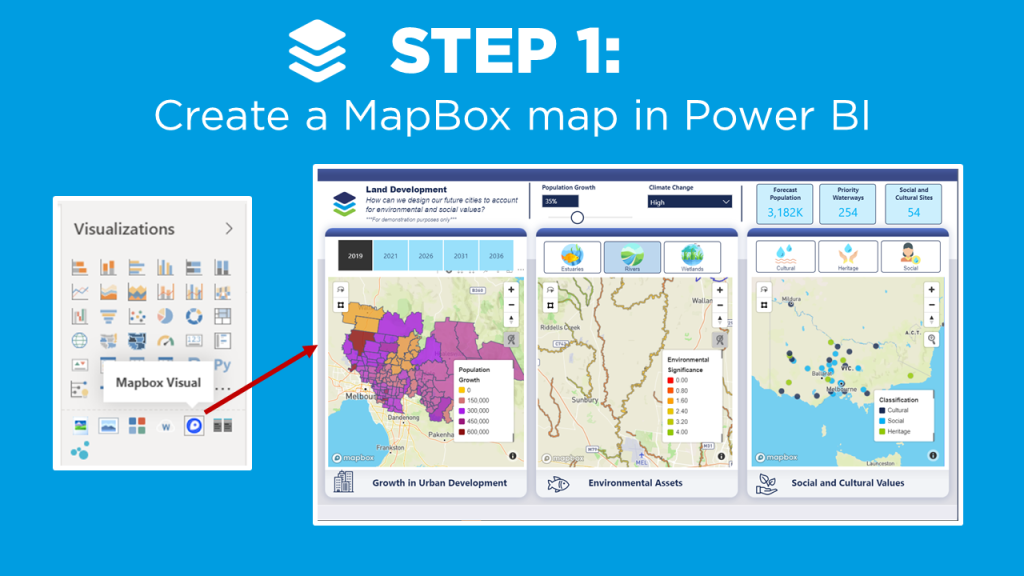
- Create a MapBox map in Power BI (check out the video on MapBox 101 if you’re new to MapBox, or need a refresher).
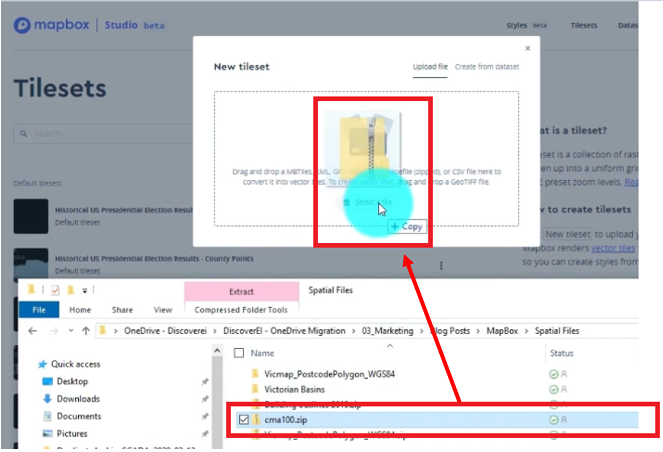
- Upload your custom tilesets into MapBox Studio
- Duplicate an existing MapBox style from gallery
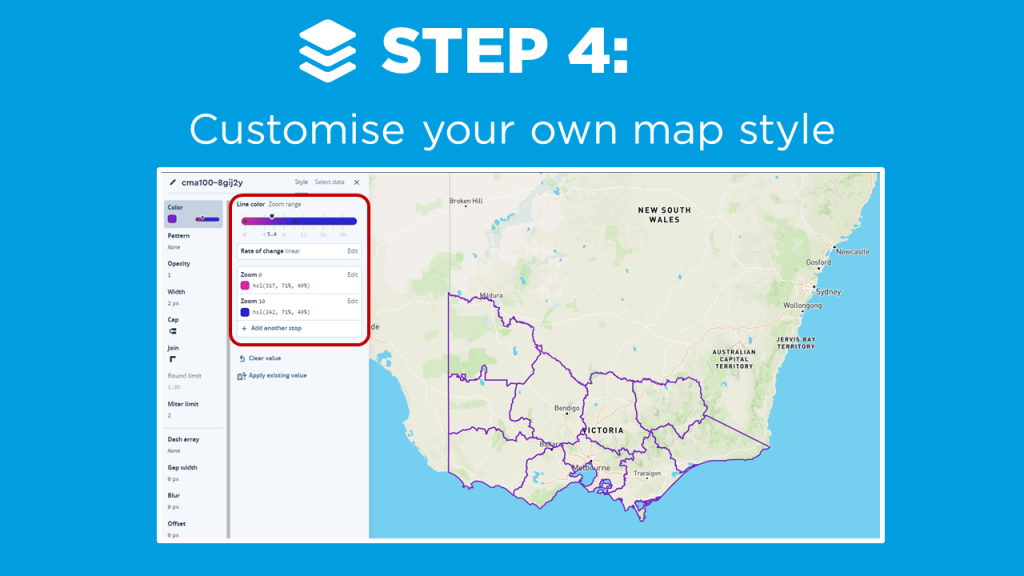
- Customise your own map style
- Add your custom style into your MapBox visual in Power BI!
First, you can leverage the base choropleth map you created in the Mapbox 101 tutorial to get a starting point. The following steps describe how to enhance the style of the map to make it pop even more!
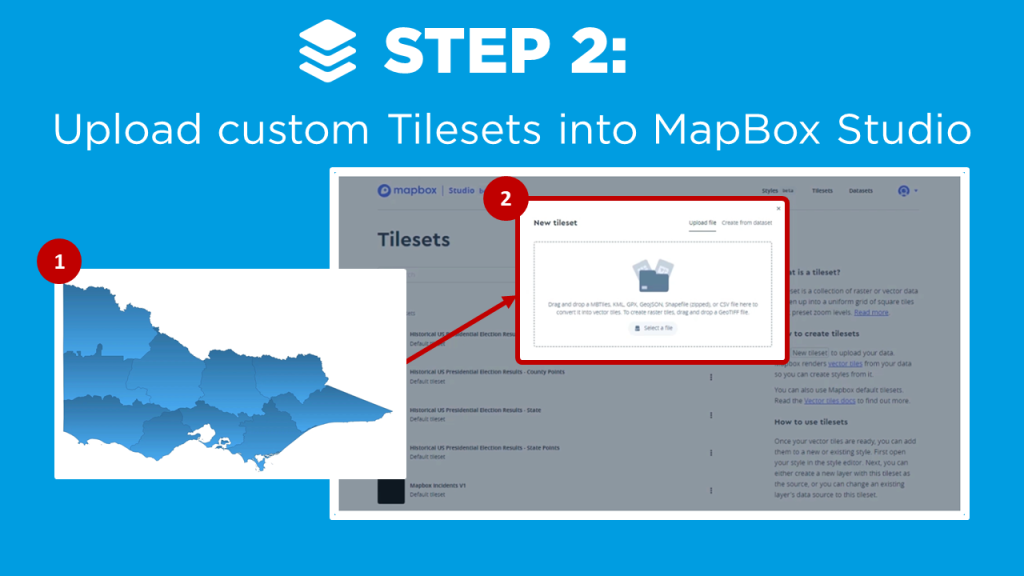
In this tutorial we want to add a boundry onto the base map. This will help us outline the specific areas around the rivers that we added as a layer in our Drill Down tutorial. A shape file was created and the zip loaded into Mapbox as a new tileset.
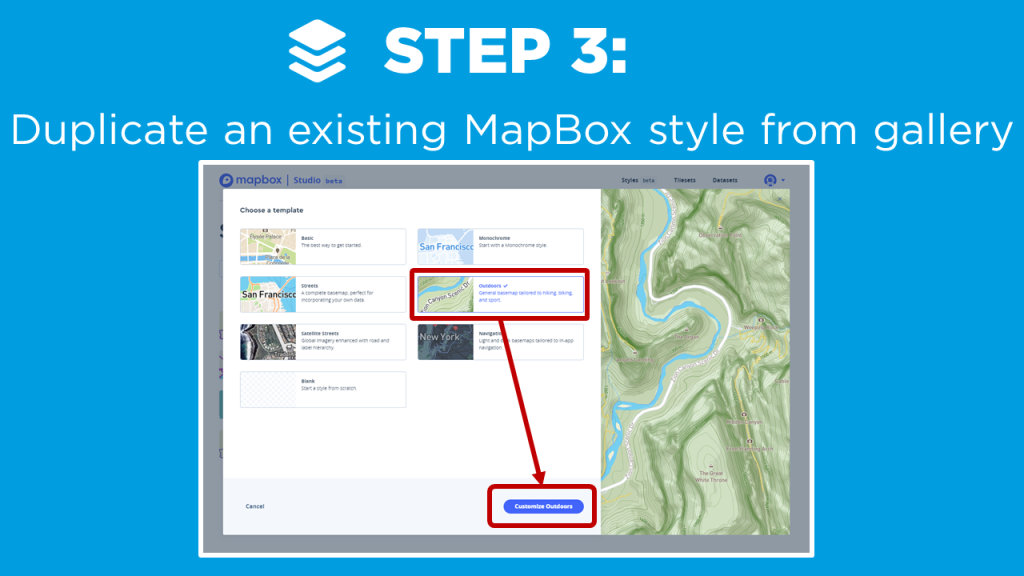
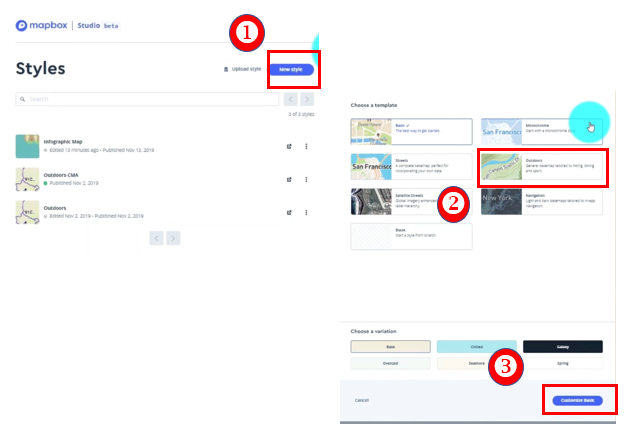
The next step is to duplicate an existing map style.
1) Select New style
2) Choose a template
3) Click Customize Basic
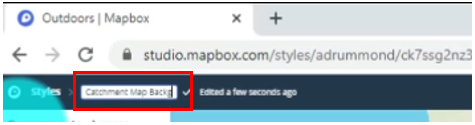
Rename your Mapbox style (upper left side of page)
Create your own custom layers and features to the map. Here are the changes made to this example.
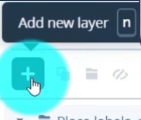
Click Add new layer
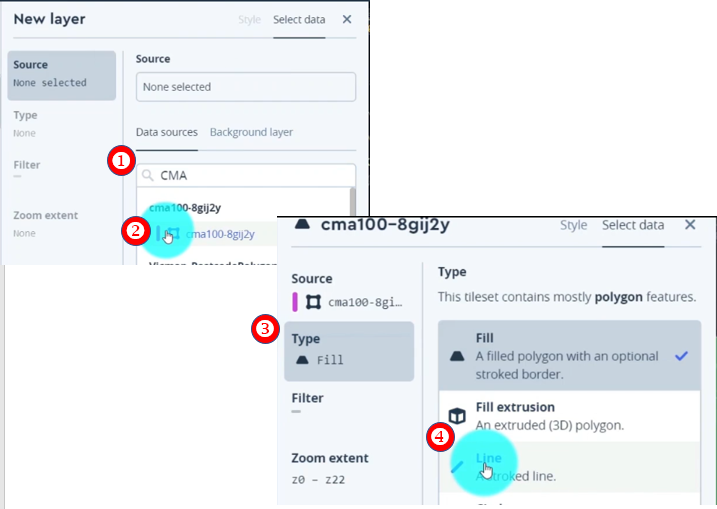
Search for tileset. (Our example uses the new boundry layer we created.)
1) Search for the tileset (ex. “CMA”)
2) Select tileset
This will add the tileset to the base style we selected.
3) Click Type
4) Select Line to change the setting
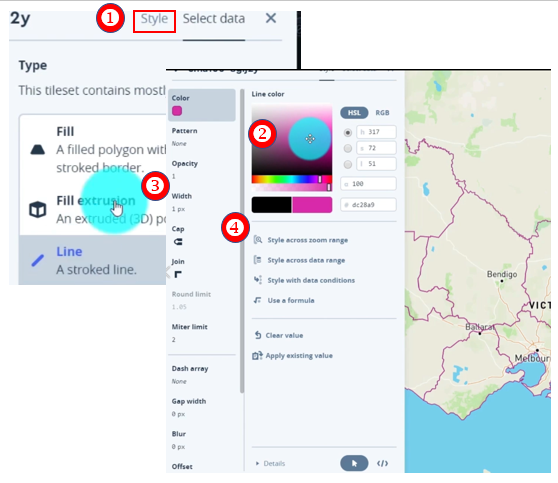
- Select Style
- Choose Color
- Adjust width by clicking on the Width field
- Style the color based on a zoom range. Select Style across zoom range to adjust the slider.
- Add new Zoom Range by Clicking on the Zoom Range bar
- Select second zoom range field (Zoom 22)
- Adjust zoom range to different value (10)
- Change the color (Blue)
- Scroll down and Click Done
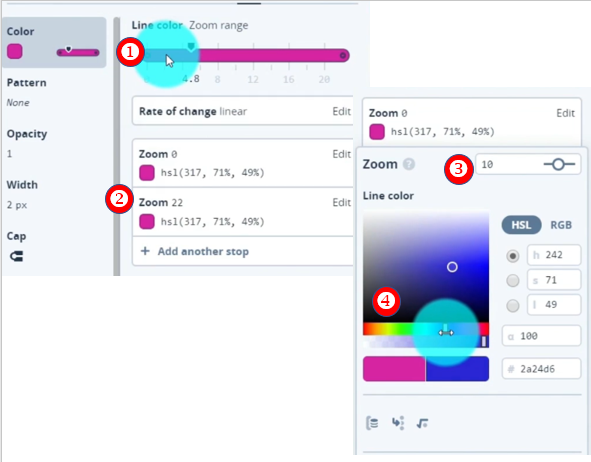
Great! Now as you zoom in and out of the map you can see the boundaries change color from pink to a blue. You can imagine how powerful this visual change can be in directing the attention in different map visuals.
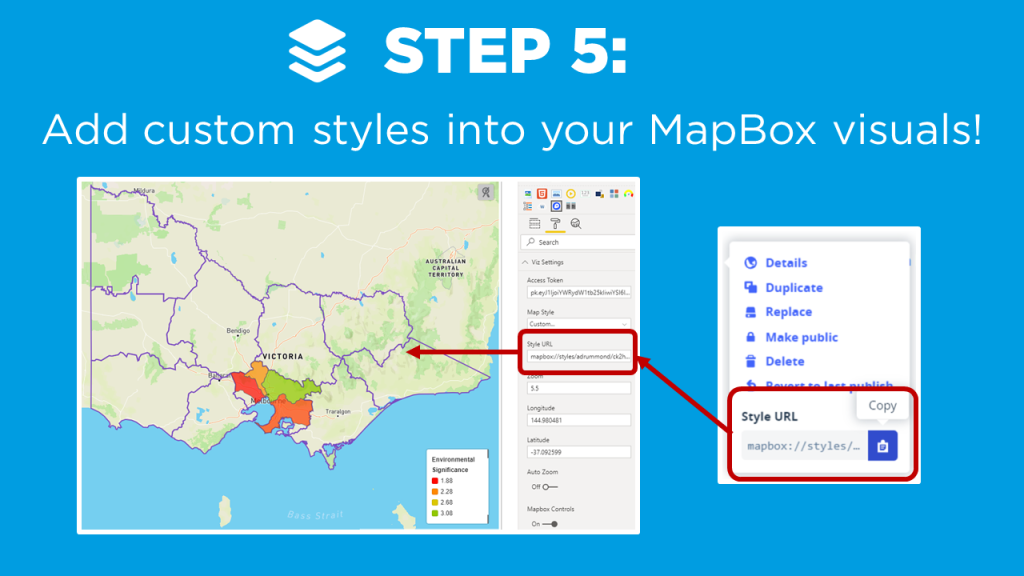
The final step is to take our new style and apply it to the Mapbox visual!
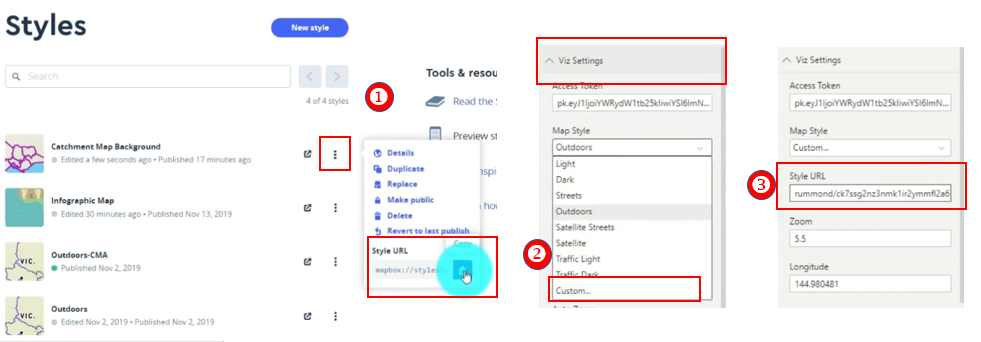
- Select the ellipses of our style
- Copy the Style URL
- Jump back into the Power BI Desktop. Under Viz Setting and the Map Style Property, Select Custom.
- Paste the copied URL from step 2 into the Style URL
Final Custom Mapbox Style
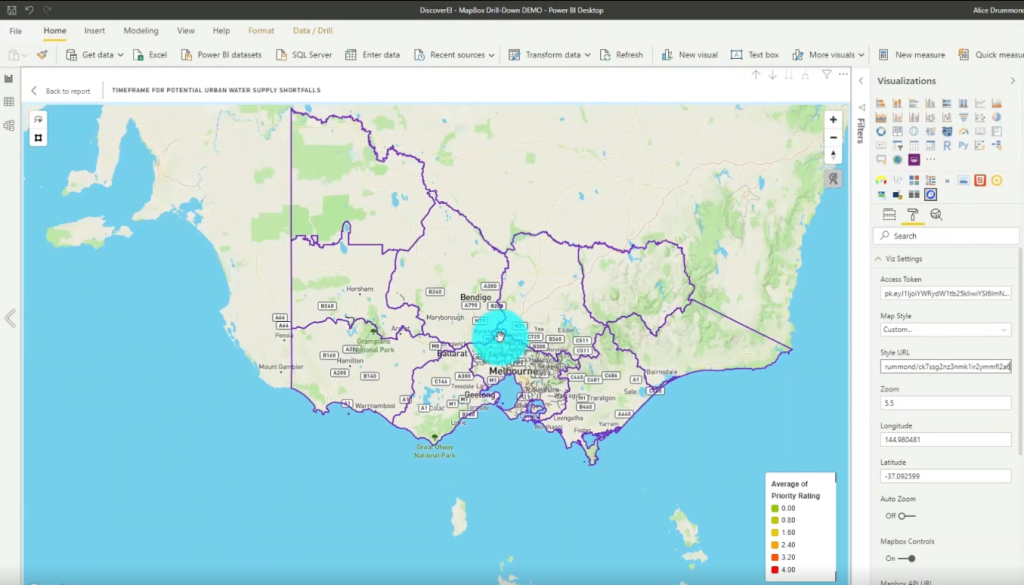
The case study I present is a Power BI report with three maps to help design our future cities to account for population growth, while also considering our environmental and social values (created using ‘synthetic’ datasets for demonstration purposes only). I modify the default ‘Outdoor’ MapBox style to include my own custom tileset, and show how to create dynamic color gradients based on different zoom intervals.
If you’re keen to learn how to create really cool customized maps for your Power BI reports, then make sure to check out the other blogs in this 4-part MapBox series, where we provide an introductory MapBox 101, explore how to create 3D maps, and how to design drill down maps!
And if you want to learn how you can create really beautiful and engaging Power BI reports, get in touch with one of the DiscoverEI team to register for our brand-new online training courses:
- Power BI Designer Masterclass
- Power BI for the Environmental Industry
- Power BI for the Water Industry
Take a look here for more details (https://www.discoverei.com/training)
If you like the content from PowerBI.Tips please follow us on all the social outlets. Stay up to date on all the latest features and free tutorials. Subscribe to our YouTube Channel. Or follow us on the social channels, Twitter and LinkedIn where we will post all the announcements for new tutorials and content.
Introducing our PowerBI.tips SWAG store. Check out all the fun PowerBI.tips clothing and products:
Check out the new Merch!


